


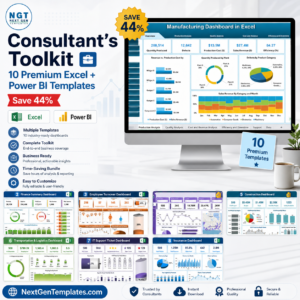
The Manufacturing Dashboard in Excel is a plug-and-play production analytics template built for plant managers, operations leaders, and quality teams who need to track factory performance without writing a single formula. Drop your data into the input sheet and instantly monitor 15+ manufacturing KPIs — Overall Equipment Effectiveness (OEE), Throughput, Downtime, Scrap Rate, First Pass Yield (FPY), MTBF, MTTR, On-Time Delivery, and more — across shifts, machines, and product lines.
Unlike generic spreadsheets, this Excel dashboard template is purpose-built for discrete and process manufacturing. Every chart, slicer, and KPI card is pre-wired, so a complete production performance view works from day one. Whether you run a small job shop, a mid-sized factory, or a multi-plant operation, the template scales with your data and is fully editable — no VBA, no macros, and no external connections required.
Use Production Data to Focus Your Review
Review production output alongside quality losses and downtime to identify questions for your operations team. Compare your own reporting periods and targets rather than assuming a universal improvement rate.
What’s Inside the Manufacturing Dashboard in Excel
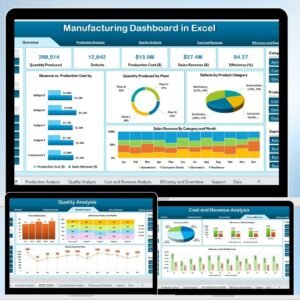
The template ships with a multi-page layout, a realistic sample dataset, and a support sheet you can adapt for your own production data. Each page is a standalone view that drills from the big picture down to machine-level detail.
📊 Page 1 — Production Overview
A single-screen summary of everything that matters: total units produced, target vs. actual output, average OEE, downtime hours, and scrap percentage. KPI cards are colour-coded against targets so issues surface immediately, and the trend line helps spot drift before it becomes a problem.
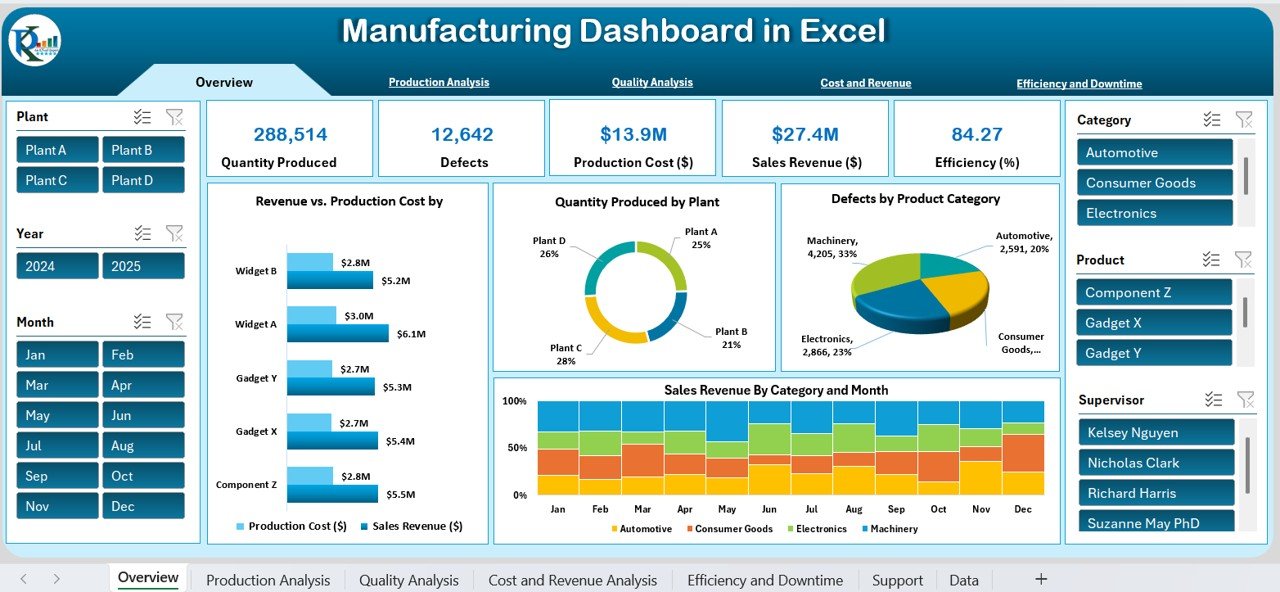 Main dashboard: Production KPIs, output trends, and efficiency summary
📈 Page 2 — Production Efficiency & OEE
Monitor Overall Equipment Effectiveness with its three classic components: Availability, Performance, and Quality. The page compares efficiency across machines, shifts, and product lines, helping you identify assets associated with production losses. For deeper OEE-only analysis, pair this with our Manufacturing Performance KPI Dashboard in Excel or the focused Manufacturing Efficiency KPI Dashboard.
 Production efficiency and OEE breakdown by machine and shift
📝 Page 3 — Quality & Defect Analysis
Track First Pass Yield, defects per million opportunities (DPMO), rework rate, and scrap cost. Pareto charts rank defect types by frequency so you can target the vital few. Teams running formal QA programs should also explore the Manufacturing Quality Assurance KPI Dashboard and our full library of quality control templates.
 Quality control: Defect rate, scrap analysis, and First Pass Yield
🎯 Already convinced? Scroll up, click Add to Cart, and your Manufacturing Dashboard downloads instantly — ready to use in under five minutes.
⚙️ Page 4 — Downtime & Machine Reliability
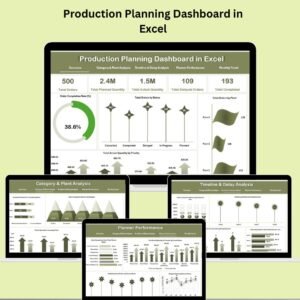
Break down downtime by reason code (planned, unplanned, changeover, breakdown), machine, and shift. MTBF and MTTR are calculated automatically, so maintenance and production leaders share the same language. Combine this with our Production Planning Dashboard in Excel to close the loop from planning to execution, or the Preventive Maintenance Dashboard for predictive upkeep.
 Downtime tracking: MTBF, MTTR, and machine-level reliability
📦 Page 5 — Inventory & Materials
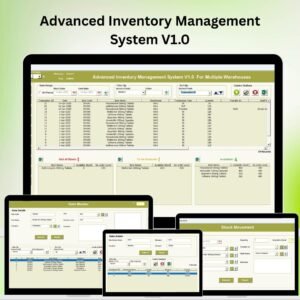
Stay on top of raw materials, work-in-progress (WIP), and finished goods with stock-out alerts and inventory turnover ratios. The page flags items below reorder point so procurement and production planning stay in sync. Need deeper inventory control? Add our Inventory Management System V3.0 or browse our complete inventory management templates.
 Inventory view: Raw materials, WIP, and finished goods
🗂️ Page 6 & 7 — Data & Support Sheet
A clean, labelled data sheet holds your production records in a simple tabular format — no complex ETL required. Every chart and KPI reads from this single source of truth, so updates propagate automatically. The support sheet controls dropdowns, targets, and lookup lists so you can customise the dashboard without breaking any formulas.
 Data sheet: Clean, structured input format — replace with your own records
 Support sheet: Dropdowns, KPI targets, and lookup lists — the dashboard’s control panel
Manufacturing KPIs Tracked by This Excel Dashboard
This Excel manufacturing dashboard automatically calculates the metrics operations teams report every day:
- 🎯 Overall Equipment Effectiveness (OEE) — with Availability, Performance, and Quality sub-components
- 🎯 Throughput & Cycle Time — units per hour, units per shift, average cycle time
- 🎯 First Pass Yield (FPY) — the percentage of units passing inspection on the first try
- 🎯 Scrap Rate & Rework Rate — quality loss measured in both units and cost
- 🎯 Downtime Analysis — planned vs. unplanned, broken down by reason and machine
- 🎯 MTBF & MTTR — Mean Time Between Failures and Mean Time to Repair
- 🎯 On-Time Delivery & Schedule Attainment — how reliably you meet customer commitments
- 🎯 Production Cost Variance — standard vs. actual production cost per unit
- 🎯 Inventory Turnover & Stock-out Rate — working capital efficiency
- 🎯 Capacity Utilisation — theoretical output vs. what you actually deliver
Excel vs. Power BI vs. Google Sheets — Which Manufacturing Dashboard Format Should You Pick?
We publish the same analysis across three platforms so you can match the tool to the team. Here’s how they compare:
| Capability | 📊 Excel (This Dashboard) | 📘 Power BI Version | 📗 Google Sheets Version |
|---|---|---|---|
| Works offline | ✅ Yes | ⚠️ Desktop only | ❌ Internet required |
| Licence needed | ✅ Excel 2016+ / M365 | ❌ Power BI Pro for sharing | ✅ Free Google account |
| Team collaboration | Single file sharing | Native workspaces | ✅ Real-time multi-user |
| Data refresh | Manual paste / auto-refresh | Scheduled refresh | Manual / Apps Script |
| Learning curve | ✅ Lowest | Moderate (DAX) | Low |
| Best for | Most factories — one-off / per-plant use | Multi-plant enterprise rollouts | Cloud-first, remote teams |
| Price | $17.99 (this page) | See Power BI version | See Google Sheets version |
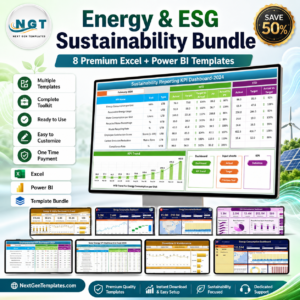
If you want everything at once: the Manufacturing Excellence Bundle includes eight premium manufacturing templates across Excel and Power BI at a significant discount.
Who Uses the Manufacturing Dashboard in Excel
| Role | How They Use the Dashboard |
|---|---|
| Plant Managers & Production Supervisors | One-page daily standup — OEE, output vs. target, yesterday’s top downtime reason |
| Operations Directors | Compare performance across plants, lines, and shifts in one view |
| Quality & Continuous Improvement Teams | Pareto defect analysis, FPY trend, scrap cost tracking for Six Sigma projects |
| Maintenance Managers | MTBF, MTTR, breakdown-reason reporting to leadership |
| Supply Chain & Inventory Managers | WIP, raw material, and finished-goods visibility alongside production output |
| Manufacturing Consultants & Lean/Six Sigma Practitioners | Client-ready dashboards without the custom build time |
| Small & Mid-Sized Manufacturers | Full factory analytics without a full MES or BI stack |
Industries This Template Already Works For
The Manufacturing Dashboard in Excel is industry-agnostic. The KPI logic works for any operation that produces, assembles, or fabricates units. Common use cases include:
- ⚙️ Automotive parts and assembly — line OEE, changeover tracking, first-time-right rates
- 🍞 Food and beverage processing — yield loss, giveaway, CIP downtime — see also the Food Manufacturing KPI Dashboard
- 👕 Apparel and textiles — see the Apparel Manufacturing KPI Dashboard
- 💊 Pharmaceuticals and chemicals — batch yield, deviation rates, compliance KPIs
- 🔌 Electronics and PCB assembly — DPMO, test yield, rework tracking
- 🏭 General industrial manufacturing — use the Industrial Manufacturing KPI Dashboard for heavy industry
- 🧪 Plastics and polymer processing — cycle time, scrap, mould changeover
For deeper vertical-specific analytics, browse the full Manufacturing Excel template library or the complete Excel KPI Dashboard catalog.
Why Choose This Manufacturing Excel Dashboard
- ✅ No learning curve — every formula, chart, and slicer is pre-built. Replace sample data and it works.
- ✅ Excel native — no add-ins, no Power Pivot required, no internet connection needed to open or use.
- ✅ Fully editable — change colours, add KPIs, rename machines, or extend date ranges without touching a single line of VBA.
- ✅ Sample data included — study a working example before plugging in your own records.
- ✅ Instant download — get the
.xlsxfile the moment your payment completes. - ✅ Lifetime access — one-time payment, unlimited future downloads, no subscription, no user limits.
- ✅ Scales from one plant to many — handles thousands of production records without slowing down.
How to Use the Manufacturing Dashboard in Excel
- Download — purchase and download the
.xlsxfile instantly. Works in Excel 2016, 2019, 2021, and Microsoft 365 on Windows and Mac. - Review the sample data — open the Data sheet to understand the expected column structure (date, shift, machine, units, downtime, defects).
- Replace with your data — paste your production records into the Data sheet — same columns, any number of rows.
- Refresh — every KPI card, chart, and analysis page updates automatically the moment the data changes.
- Customise — adjust targets on the Support sheet, rename machines/lines, or apply your brand colours.
- Share — email the file, publish to SharePoint, or drop it in a shared drive. Excel’s native file portability means no BI licence or cloud account is required for your readers.
Explore Related Manufacturing Templates
- 📘 Power BI version — Manufacturing Efficiency Dashboard in Power BI
- 📗 Google Sheets version — Manufacturing KPI Dashboard in Google Sheets
- 📊 Excel KPI focus — Manufacturing KPI Dashboard, Manufacturing Cost Efficiency KPI Dashboard, Manufacturing Revenue Tracking KPI Dashboard
- 🏭 Industry-specific — Industrial Manufacturing, Food Manufacturing, Apparel Manufacturing
- 🔧 Operations pair-ups — Production Planning Dashboard, Preventive Maintenance Dashboard, Inventory Management System V3.0
- 💰 Save significantly — Manufacturing Excellence Bundle (8 Premium Templates)
- 🗂️ Browse everything — all Manufacturing Excel templates and the complete Excel KPI Dashboard library.
Frequently Asked Questions
What is a Manufacturing Dashboard in Excel?
A Manufacturing Dashboard in Excel is a pre-built spreadsheet template that visualises production KPIs — such as OEE, throughput, downtime, scrap rate, and First Pass Yield — in a single interactive view. It replaces manual monthly reports with real-time charts and KPI cards that refresh automatically when you enter new production data. This Manufacturing Dashboard in Excel by NextGenTemplates covers 7 pages of analysis and is ready to use in under 5 minutes.
What manufacturing KPIs does this Excel dashboard track?
The Manufacturing Dashboard in Excel tracks 15+ production and quality KPIs including Overall Equipment Effectiveness (OEE), throughput, cycle time, First Pass Yield (FPY), scrap rate, rework rate, downtime (planned and unplanned), Mean Time Between Failures (MTBF), Mean Time to Repair (MTTR), on-time delivery, schedule attainment, inventory turnover, capacity utilisation, and production cost variance.
Do I need Power BI or macros to use this dashboard?
No. The Manufacturing Dashboard in Excel is 100% native Excel — no Power BI, no VBA macros, no Power Pivot, and no add-ins required. It works offline and is compatible with Excel 2016, 2019, 2021, and Microsoft 365 on Windows and Mac.
Can I use this manufacturing dashboard with my own data?
Yes. The template includes a clean Data sheet and a Support sheet. Replace the sample rows with your own production records, adjust the targets on the Support sheet, and every chart and KPI updates automatically. The structure handles thousands of rows without performance issues.
Is there a Power BI or Google Sheets version of this dashboard?
Yes. The same analysis is available in multiple formats: the Manufacturing Efficiency Dashboard in Power BI and the Manufacturing KPI Dashboard in Google Sheets. For maximum value, the Manufacturing Excellence Bundle groups 8 premium manufacturing templates at a significant discount.
Which manufacturing industries can use this template?
The Manufacturing Dashboard in Excel is industry-agnostic and works for discrete manufacturing, process manufacturing, assembly, and fabrication. It’s used by automotive parts, food and beverage, apparel and textiles, electronics, pharmaceuticals, chemicals, plastics, and general industrial manufacturing teams. For vertical-specific dashboards, browse our full manufacturing template collection.
What is a good OEE benchmark for a factory?
World-class OEE is 85%. Typical factories operate between 40% and 60% OEE. Anything above 60% is considered competitive, and 75%+ is strong for discrete manufacturing. The Manufacturing Dashboard in Excel calculates OEE automatically from your Availability, Performance, and Quality inputs so you can benchmark week-on-week without spreadsheet gymnastics.
How much does this Manufacturing Dashboard in Excel cost?
The Manufacturing Dashboard in Excel is priced at $17.99 as a one-time payment. There are no recurring fees, user limits, or expiry dates. The dashboard includes all 7 analysis pages, the sample dataset, the support sheet, and lifetime updates. Team and multi-plant licensing is available on request.
Excel vs. Power BI for a manufacturing dashboard — which should I pick?
Pick Excel if you want no licence friction, offline use, and the lowest learning curve — this dashboard fits most small-to-mid factories. Pick Power BI if you need scheduled data refresh, enterprise-grade sharing across multiple plants, or advanced DAX modelling. Many NextGenTemplates customers buy both via the Manufacturing Excellence Bundle for flexibility.
Is this a one-time purchase or a subscription?
One-time purchase. You pay once, download immediately, and own the template for life. There are no recurring fees, no user limits, and no expiry dates.
Ready to Transform Your Factory Reporting?
Stop rebuilding the same monthly production report in Excel. The Manufacturing Dashboard in Excel gives you a complete, professional-grade view of OEE, quality, downtime, and inventory — today, not next quarter. Click Add to Cart above, download instantly, and have your first dashboard live in under five minutes.
📖 Read the full Manufacturing Dashboard walkthrough on our blog
For step-by-step video tutorials on Excel dashboards, visit our YouTube channel: Youtube.com/@PKAnExcelExpert
Watch the demo video
For related templates and reporting options, explore our manufacturing reporting guide.














Reviews
There are no reviews yet.