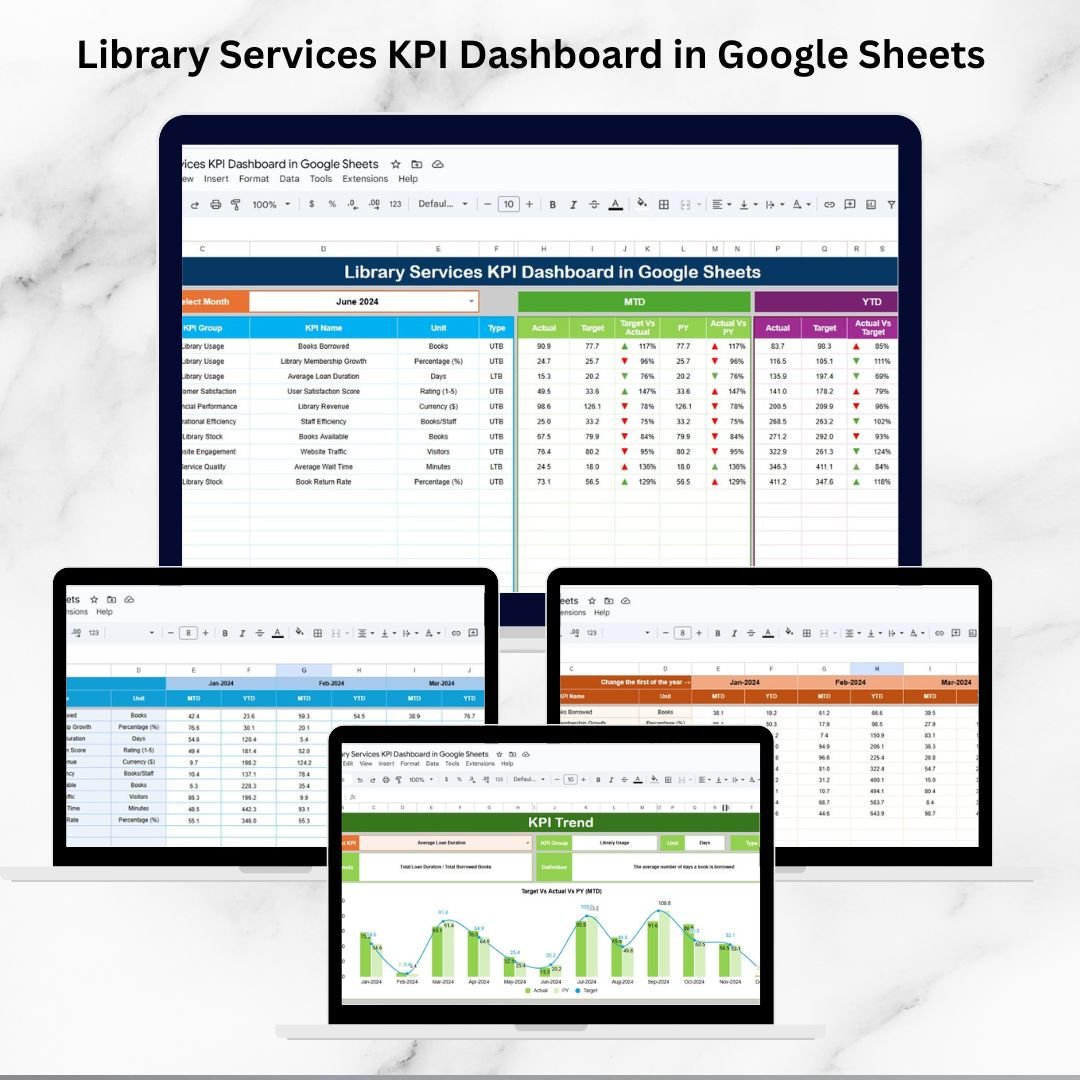
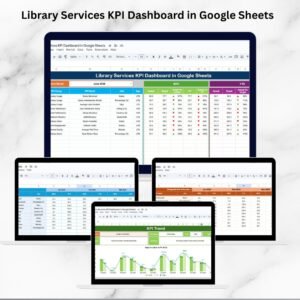
Libraries are no longer just about lending books—they are dynamic centers for learning, community engagement, and knowledge sharing. To run them effectively, managers need clear insights into performance metrics like user satisfaction, resource utilization, and service efficiency. The Library Services KPI Dashboard in Google Sheets provides exactly that: a ready-to-use tool to track, analyze, and optimize library performance. 📚📊Library Services KPI Dashboard in Google Sheets
This interactive dashboard consolidates all library KPIs into a single platform, making it easier to monitor progress, compare targets with actuals, and identify trends over time. Whether you’re managing a public library, a university resource center, or a pri
🔑 Key Features of Library Services KPI Dashboard in Google Sheets
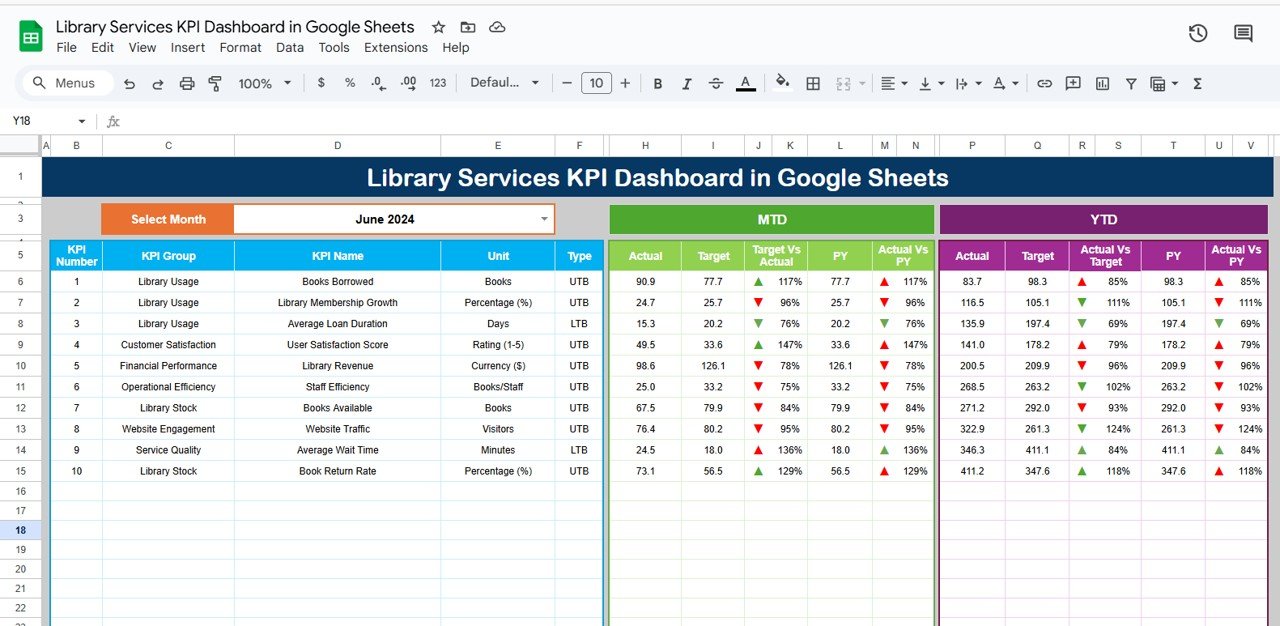
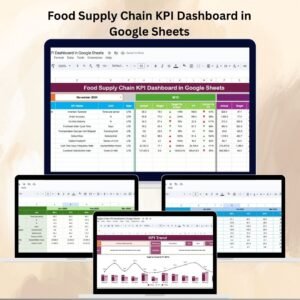
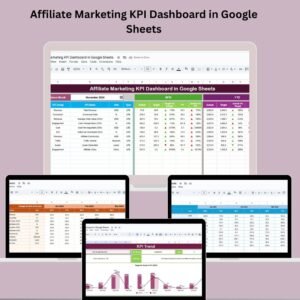
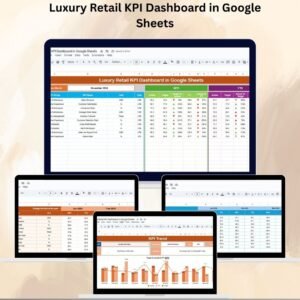
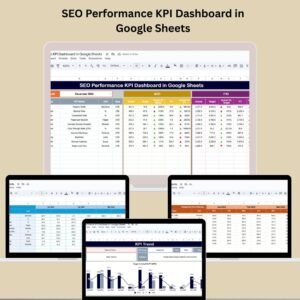
📋 Dashboard Sheet (Overview of KPIs)
-
Month selection dropdown (D3) to update metrics dynamically.
-
MTD & YTD Metrics with Actual vs Target vs Previous Year comparisons.
-
Conditional formatting with up/down arrows for instant insights.
-
All performance highlights in one glance.
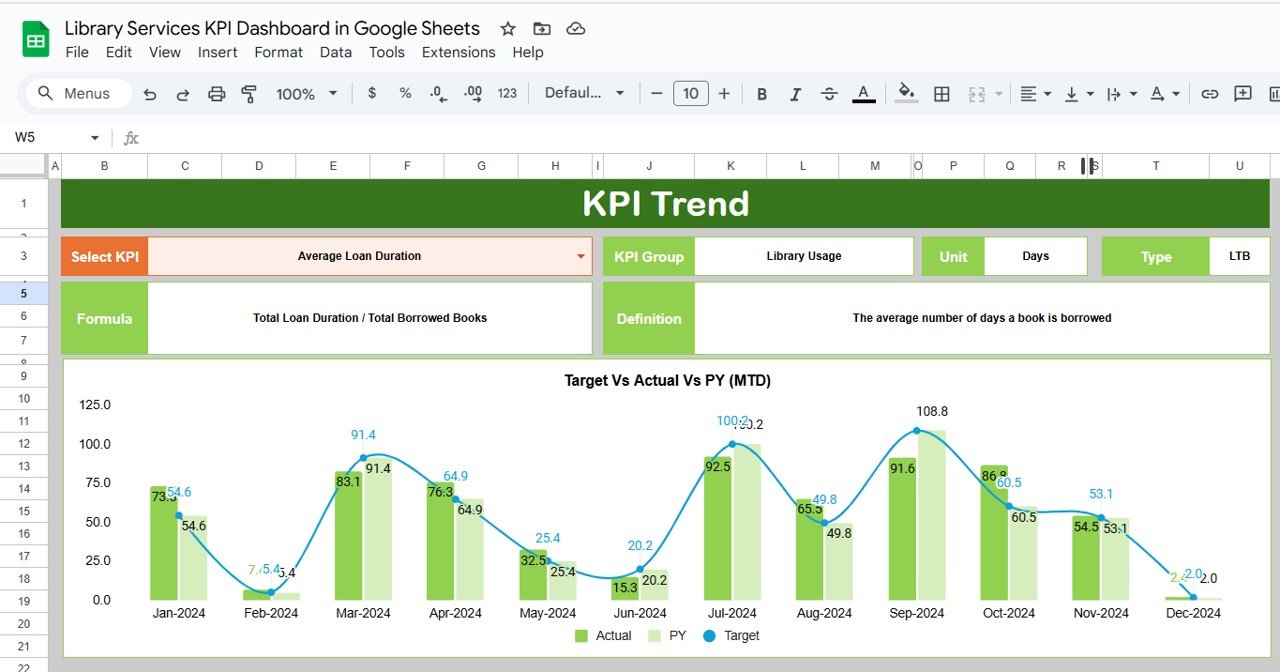
📈 KPI Trend Sheet
-
Dropdown selection (C3) to focus on a specific KPI.
-
Displays KPI Group, Unit, Type (UTB/LTB), Formula & Definition.
-
Trend charts show month-to-month changes and long-term progress.
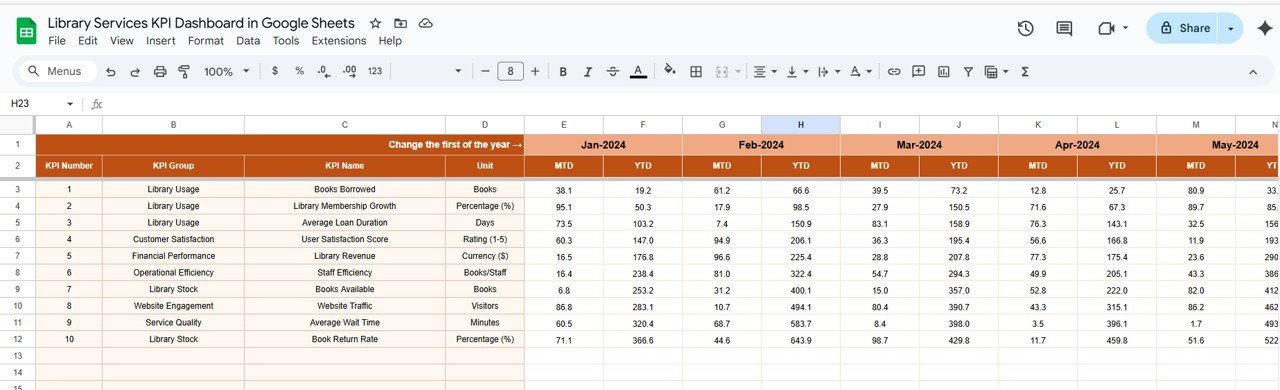
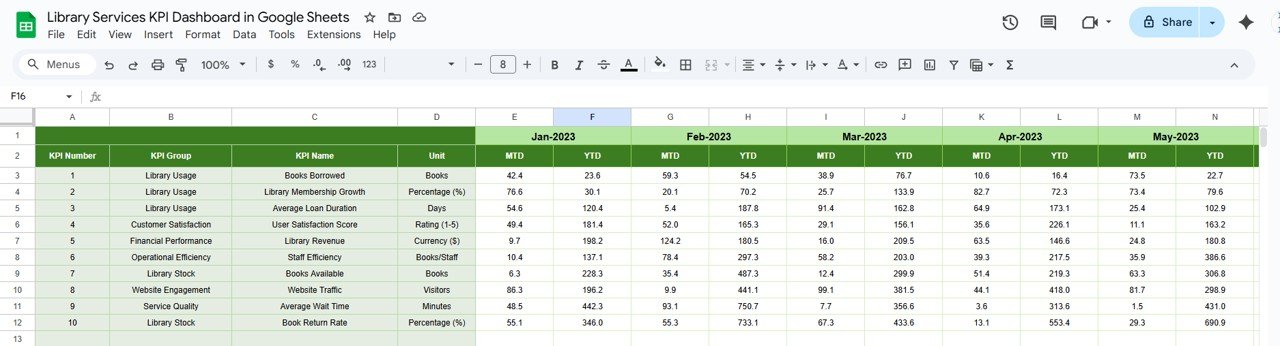
🧾 Actual Numbers Sheet
-
Enter monthly data for both MTD & YTD.
-
Adjustable start month (E1) to match your fiscal/calendar year.
-
Automatically reflects changes on dashboard and trend sheets.
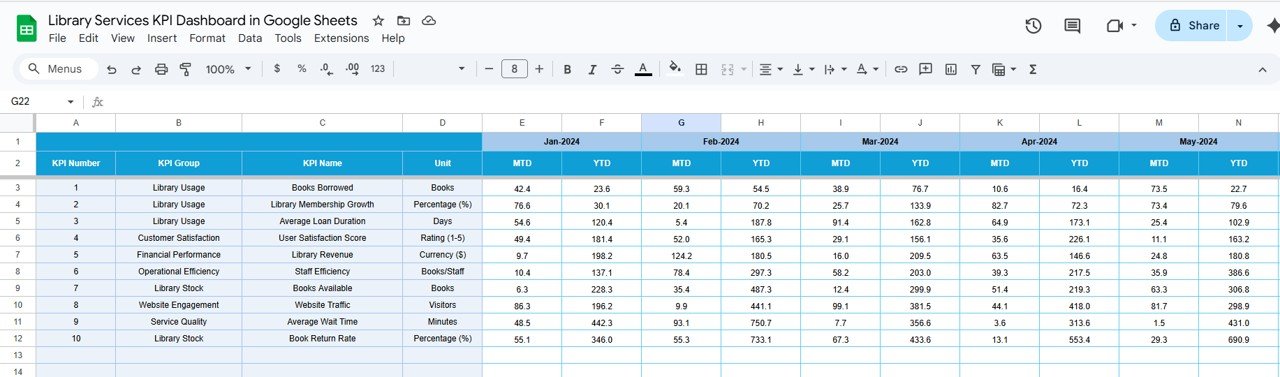
🎯 Target Sheet
-
Input monthly and yearly goals for each KPI.
-
Compare with actual values to track achievement gaps.
-
Ensures accountability and planning clarity.
📊 Previous Year Numbers Sheet
-
Store last year’s performance data.
-
Enables year-over-year comparisons.
-
Helps identify seasonal fluctuations and improvements.
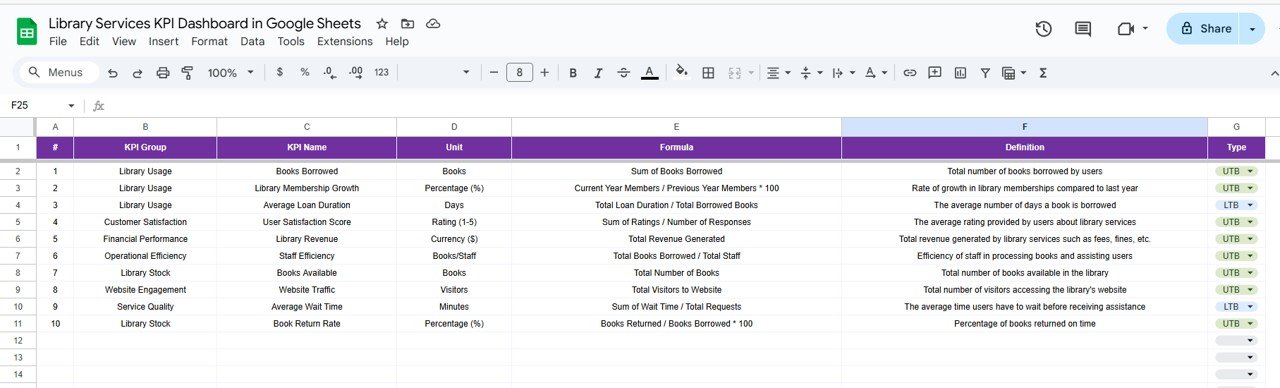
📘 KPI Definition Sheet
-
Full KPI documentation: Name, Group, Unit, Formula, Definition, Type.
-
Provides a consistent understanding of performance metrics.
-
Useful for onboarding new staff or aligning teams.
📦 What’s Inside the Dashboard?
✅ 6 Tabs – Dashboard, KPI Trend, Actual Numbers, Targets, Previous Year, KPI Definitions
✅ Dynamic Charts & Cards – Instant visual insights
✅ Conditional Formatting – Red/green arrows for quick review
✅ Preloaded Sample Data – Get started immediately
✅ Fully Customizable – Add or modify KPIs easily
🎯 Who Can Benefit from This Dashboard?
📚 Library Managers – Track overall performance and efficiency.
👨🏫 Academic Institutions – Monitor student engagement and resource usage.
🏛️ Public Libraries – Measure visitor satisfaction and attendance.
📊 Operations Teams – Analyze service delivery and resource allocation.
👥 Administrators & Boards – Evaluate long-term trends for strategic planning.
🧠 How to Use the Library Services KPI Dashboard
-
Enter actual KPI data in the Actual Numbers Tab.
-
Input targets in the Target Tab.
-
Add last year’s values in the Previous Year Tab.
-
Review the Dashboard Tab for overall performance.
-
Use the KPI Trend Tab to analyze specific KPIs.
-
Refer to the KPI Definition Tab for metric clarity.
No technical skills are needed — just update the numbers and watch the dashboard do the rest. ✅
🚀 Advantages of Using This Dashboard
-
Centralized Data – All KPIs in one place.
-
Real-Time Insights – Updates automatically with new inputs.
-
Target Tracking – Compare actual vs planned outcomes.
-
Year-over-Year Analysis – Measure growth and seasonal patterns.
-
Customizable – Adaptable for any type of library setup.
-
Decision Support – Identify problem areas early and allocate resources effectively.
🔗 Click here to read the Detailed blog post
Watch the step-by-step video Demo:


Reviews
There are no reviews yet.