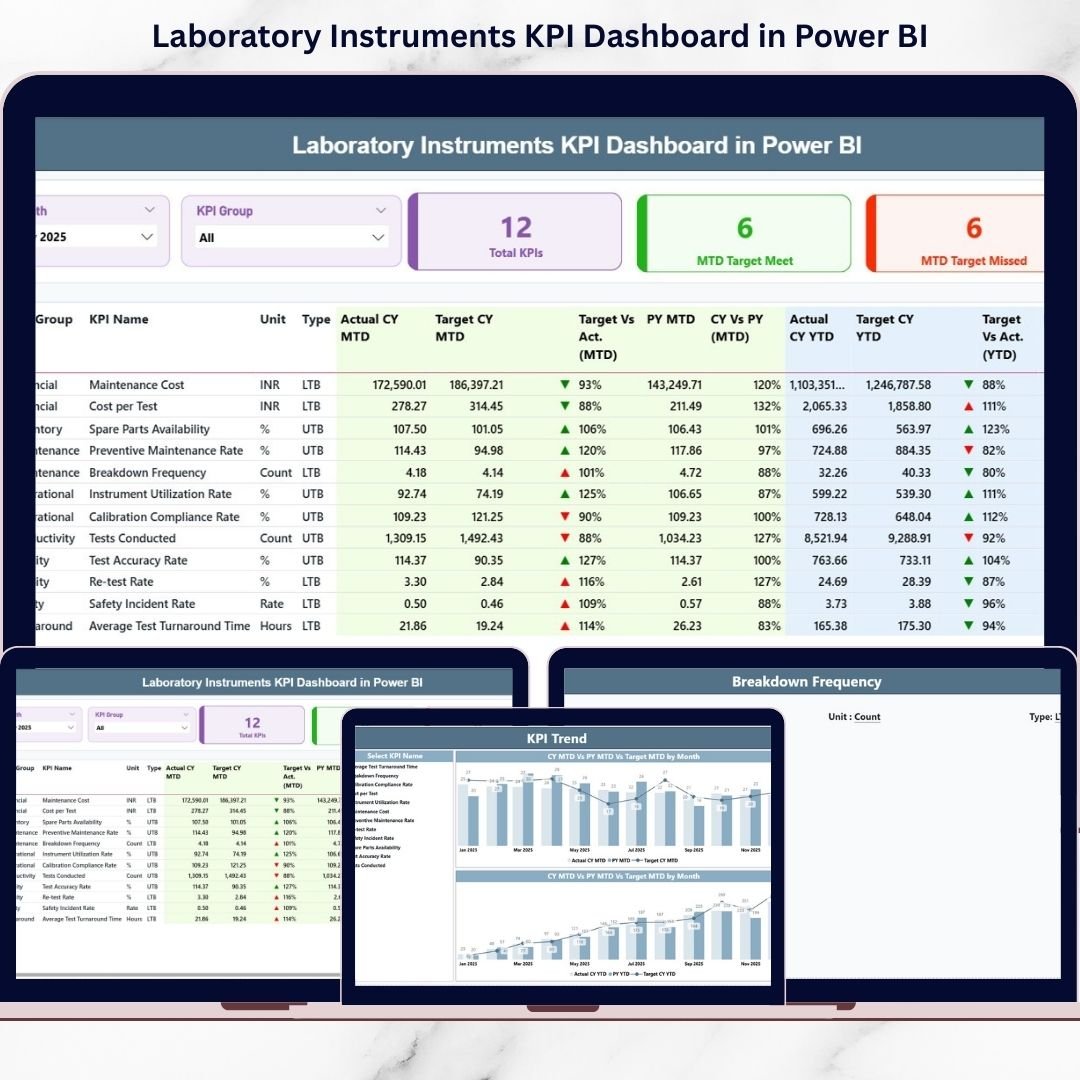

Laboratories thrive on precision, uptime, and compliance. But if your team still compiles instrument reports manually, you’re losing valuable hours every month. Laboratory Instruments KPI Dashboard in Power BI Delayed insights lead to missed calibration schedules, rising downtime, and unclear performance gaps.
What if you could monitor all laboratory instrument KPIs in one powerful, interactive dashboard?
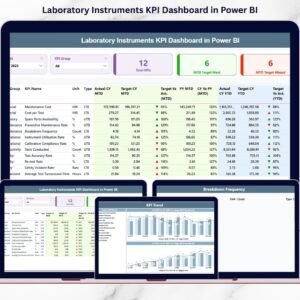
Laboratory Instruments KPI Dashboard in Power BI the Laboratory Instruments KPI Dashboard in Power BI is a ready-to-use, professionally designed solution that converts structured Excel data into real-time visual intelligence. Instead of reviewing static reports, you can instantly analyze MTD and YTD performance, compare targets, and track year-over-year growth with just a few clicks.
This dashboard empowers laboratory managers to stop reacting late and start making proactive, data-driven decisions. 🚀
🚀 Key Features of Laboratory Instruments KPI Dashboard in Power BI
📊 Real-Time KPI Monitoring
Refresh your Power BI file and instantly view updated MTD and YTD performance metrics.
🎯 Target vs Actual Comparison
Automatically calculate performance gaps and identify whether KPIs meet or miss targets.
📈 Year-over-Year Analysis
Compare Current Year vs Previous Year data for deeper performance insights.
🔎 Interactive Slicers
Use Month and KPI Group slicers to filter data dynamically and analyze specific segments.
🟢🔴 Visual Performance Indicators
Green ▲ and Red ▼ icons instantly show performance direction based on LTB and UTB logic.
📊 Detailed KPI Performance Table
View KPI Name, Group, Unit, Actual, Target, Previous Year, and percentage variance in one structured table.
📉 KPI Trend Combo Charts
Analyze MTD and YTD trends with visual combo charts (Actual, Target, PY).
🧾 Drill-Through KPI Definitions
Right-click any KPI to view its formula, definition, unit, and logic for audit transparency.
📦 What’s Inside the Laboratory Instruments KPI Dashboard in Power BI
This solution includes 3 fully interactive Power BI pages:
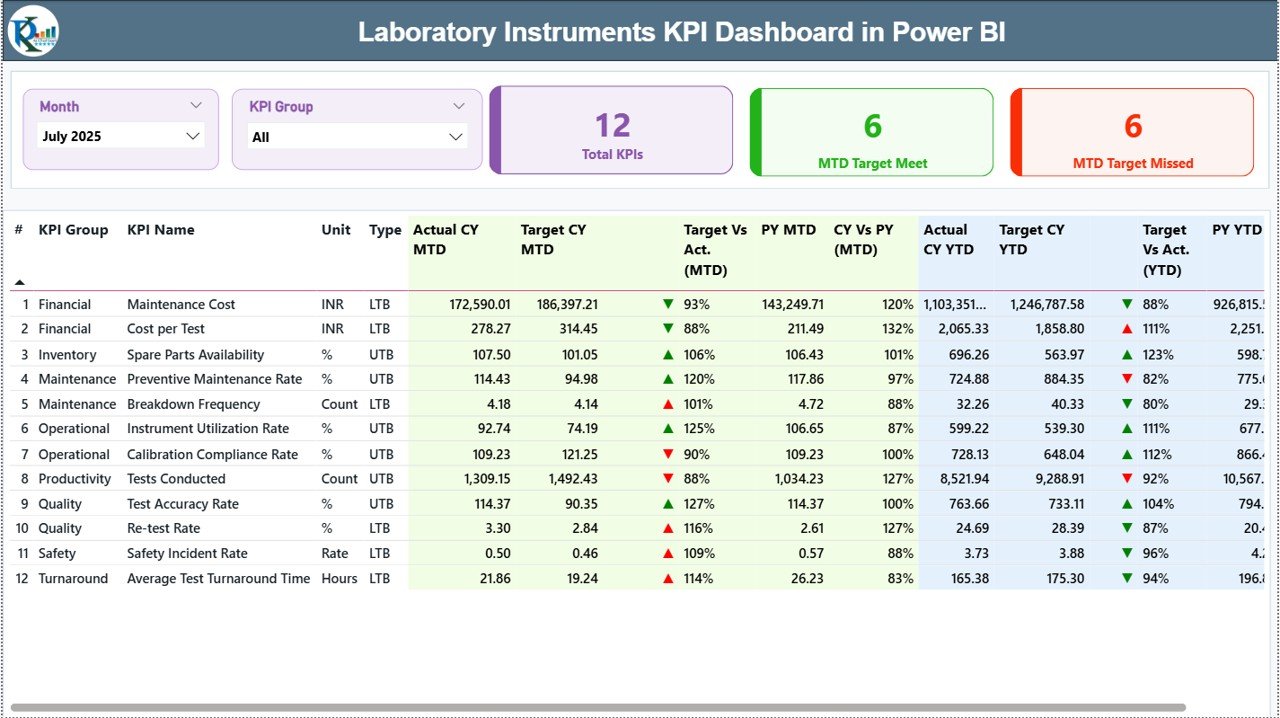
1️⃣ Summary Page
The main performance overview page featuring:
KPI Count Cards (Total KPIs, Target Met, Target Missed)
Interactive Month & KPI Group slicers
Detailed KPI comparison table
Icon-based performance indicators
This page gives you instant clarity on overall laboratory performance.
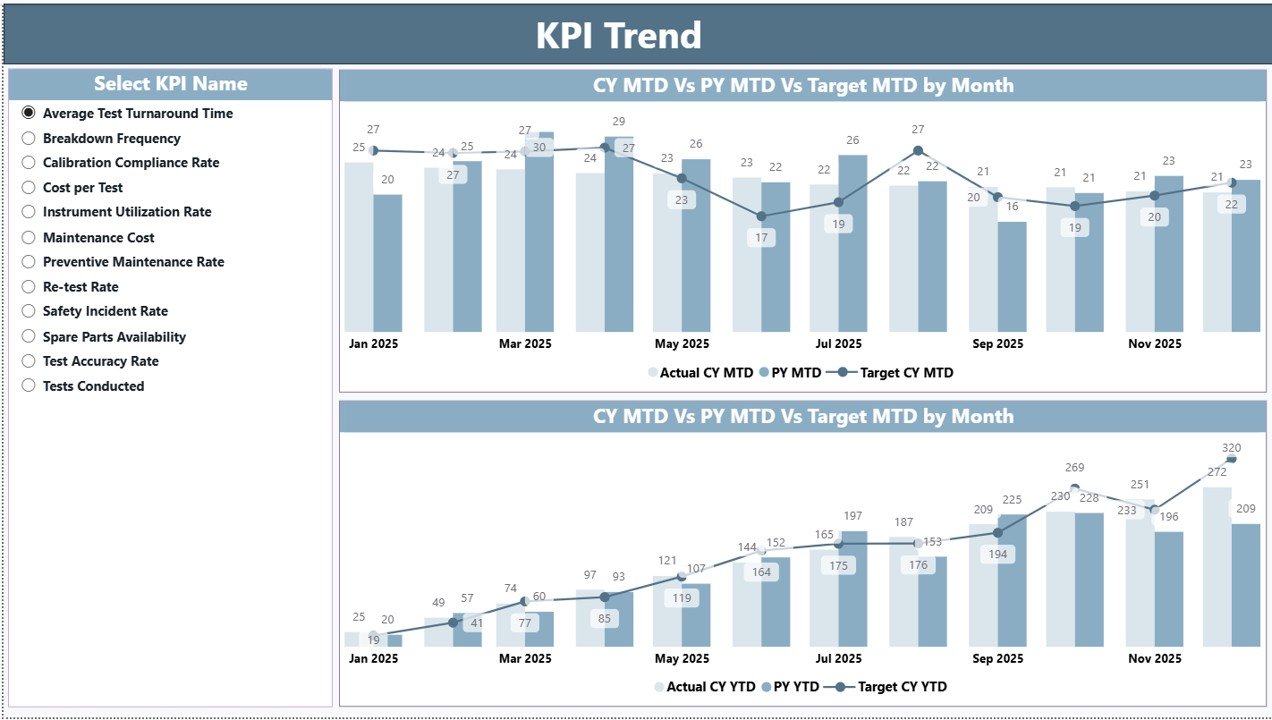
2️⃣ KPI Trend Page
A visual analysis page where you:
Select a KPI using a slicer
View MTD Combo Chart (Actual vs Target vs PY)
View YTD Combo Chart (Actual vs Target vs PY)
Trend analysis helps you detect declining performance early and plan corrective action.
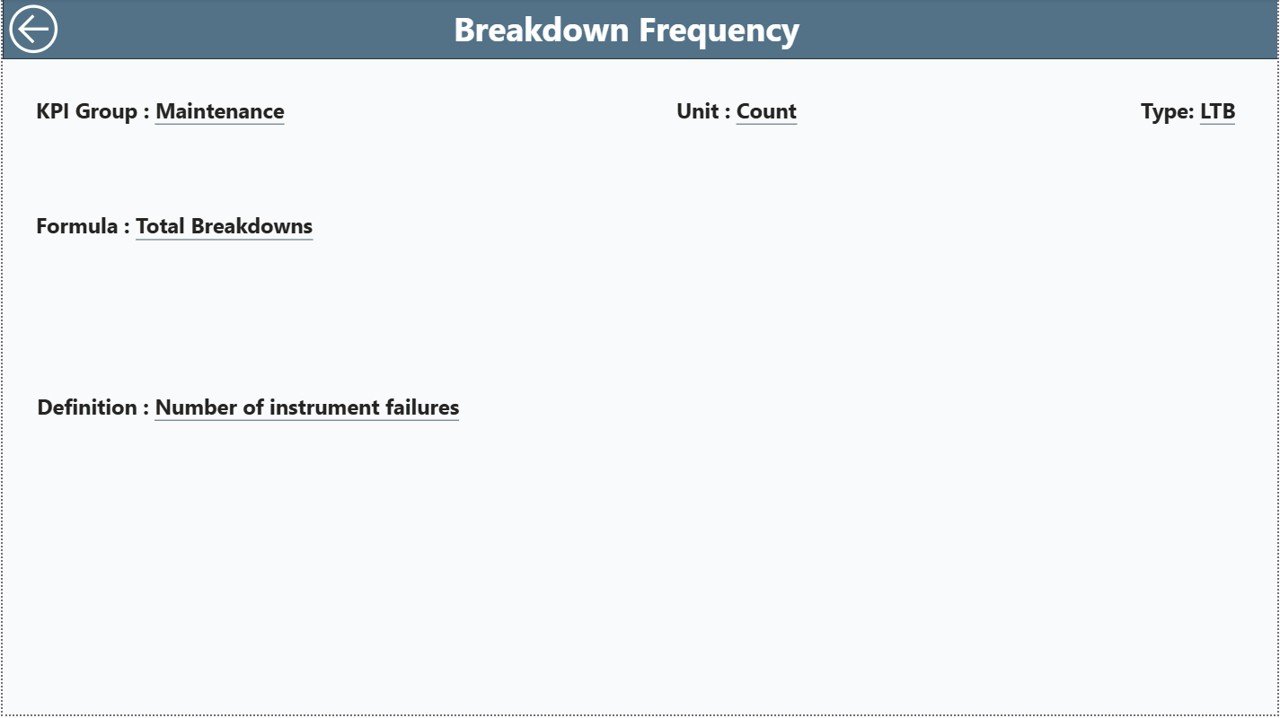
3️⃣ KPI Definition Page (Drill-Through)
Access KPI formulas, definitions, unit types, and performance logic (LTB/UTB) directly from the Summary page. This improves compliance, transparency, and audit readiness.
🛠 How to Use the Laboratory Instruments KPI Dashboard in Power BI
Using this dashboard is simple and structured:
1️⃣ Enter KPI data into the Excel data file:
Input_Actual Sheet (MTD & YTD actual values)
Input_Target Sheet (MTD & YTD target values)
KPI Definition Sheet (KPI name, formula, unit, type)
2️⃣ Use the first date of each month for consistency.
3️⃣ Refresh Power BI Desktop.
4️⃣ Use slicers to analyze specific months or KPI groups.
Within seconds, you can evaluate performance gaps, compliance rates, and operational efficiency.
No complex modeling required from your side — everything is pre-built and ready to use.
👥 Who Can Benefit from This Laboratory Instruments KPI Dashboard in Power BI
This dashboard is ideal for:
Laboratory Managers
Hospital Diagnostic Centers
Pharmaceutical Laboratories
Research Institutions
Equipment Maintenance Teams
Quality Assurance Departments
Whether you manage 10 instruments or 500, this dashboard scales easily to your operational needs.
If equipment availability drops below 95% or downtime increases unexpectedly, you detect it immediately — not after monthly reporting delays.
That’s the power of real-time visibility.
Why This Dashboard Stands Out 💡
Reduces manual reporting time
Improves compliance tracking
Centralizes KPI data in one structured model
Enhances decision-making speed
Supports preventive maintenance planning
Highlights performance risks instantly
Ensures audit transparency
When preventive maintenance completion drops or downtime rises, you see it visually — and act before issues escalate.
This is smarter laboratory management powered by data.
# Click hare to read the Detailed blog post
Visit our YouTube channel to learn step-by-step video tutorials:
👉 Youtube.com/@PKAnExcelExpert
Watch the step-by-step video tutorial:
Compatibility and Requirements
- Works in Power BI Desktop, which is free to download from Microsoft. Read Get Power BI Desktop for setup steps.
- Your data goes into an Excel data file, so you also need Microsoft Excel to enter the figures.
Frequently Asked Questions
How many pages does the dashboard have?
Three pages: Summary, KPI Trend and KPI Definition (a drill-through page).
Where do I enter my KPI data?
In the Excel data file. Use the Input_Actual sheet for MTD and YTD actual values, the Input_Target sheet for MTD and YTD targets, and the KPI Definition sheet for the KPI name, formula, unit and type. Use the first date of each month, then refresh Power BI Desktop.
Can I filter the dashboard by month or KPI group?
Yes. The Summary page has Month and KPI Group slicers, and the KPI Trend page has a KPI slicer.
How do I see how a KPI is calculated?
Right-click any KPI on the Summary page and drill through to the KPI Definition page. It shows the formula, definition, unit and whether lower or upper is better (LTB or UTB).
Can I compare results with the previous year?
Yes. The detailed KPI table shows Actual, Target and Previous Year with percentage variance, and the MTD and YTD combo charts plot Actual, Target and PY together.
Is there an Excel version?
Yes. See the Laboratory Instruments KPI Dashboard in Excel.
Related Laboratory and KPI Templates
- Laboratory Instruments KPI Dashboard in Excel: the same KPIs in Excel
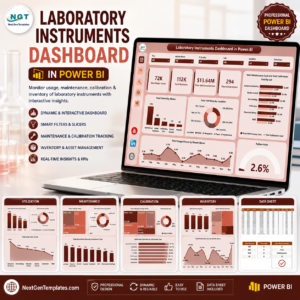
- Laboratory Instruments Dashboard in Power BI: another Power BI dashboard for lab instruments
- Laboratory Instruments Dashboard in Excel: an Excel dashboard for lab instruments
- Operations KPI Dashboard in Power BI: operations KPIs in Power BI
- Workplace Safety KPI Dashboard in Power BI: safety KPIs in Power BI
Browse all Power BI KPI dashboards.