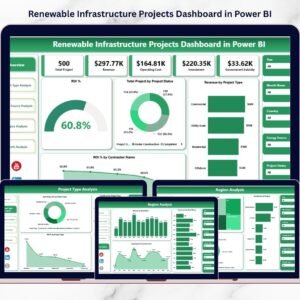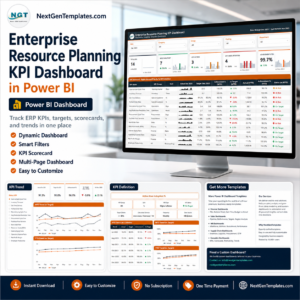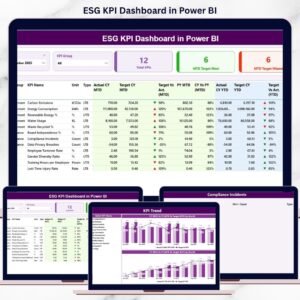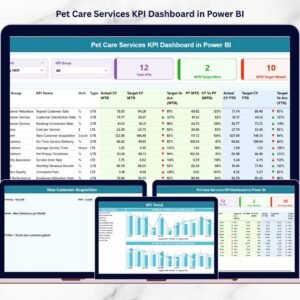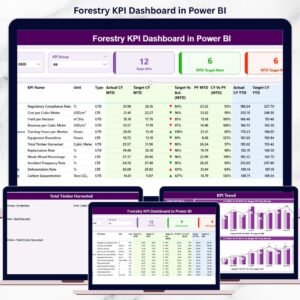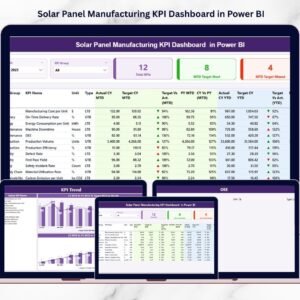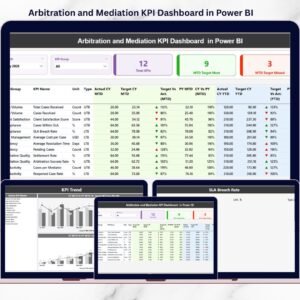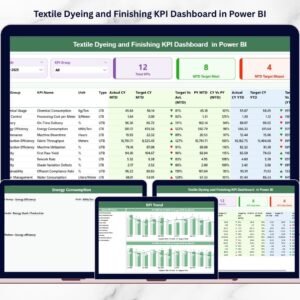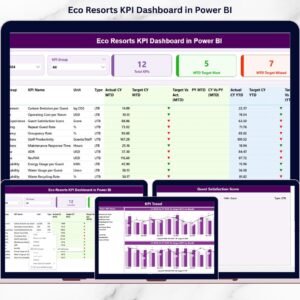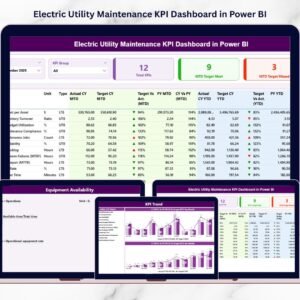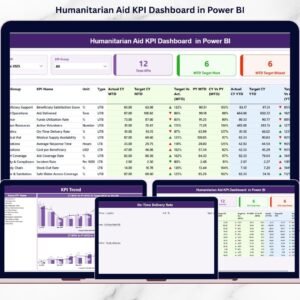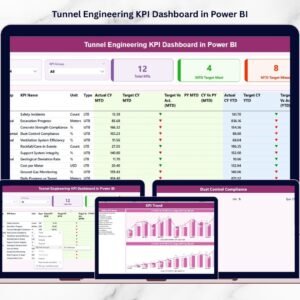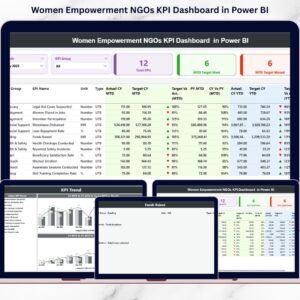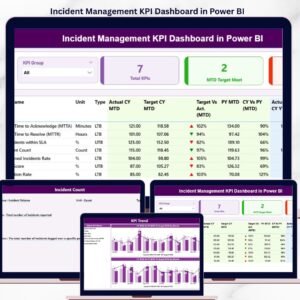

Renewable infrastructure projects move at high speed—and everyday matters. Solar farms, wind parks, hydro installations, and other renewable assets operate under strict timelines, budget pressure, and sustainability targets. Even a small delay in procurement, efficiency drop, or unexpected cost increase can affect the overall project. To stay on track, teams need instant clarity. The Renewable Infrastructure Projects KPI Dashboard in Power BI delivers that clarity in the simplest and smartest way.
This ready-to-use Power BI dashboard helps project managers, engineers, contractors, and renewable energy companies monitor their most important KPIs in real time. With clean visuals, dynamic slicers, clear KPI definitions, and structured Excel input sheets, this dashboard turns complex data into meaningful insights. You instantly see what’s working, where delays appear, and which KPIs require immediate attention.
Whether you manage solar installations, large-scale wind projects, or hybrid renewable sites, this dashboard becomes your central performance control system—helping you make faster, accurate, and data-driven decisions.
✨ Key Features of the Renewable Infrastructure Projects KPI Dashboard in Power BI
⚡ Instant Visibility of All Renewable KPIs
Track project progress, efficiency, cost, timelines, risks, and operational metrics—all in one view.
📅 MTD & YTD Performance Insights
Every KPI displays Month-to-Date and Year-to-Date numbers along with comparisons to targets and previous year values.
🔍 Dynamic Slicers for Smart Filtering
Filter data by month or KPI group to focus on energy efficiency, cost, timelines, safety, operations, or sustainability metrics.
📈 Trend Analysis for Deeper Understanding
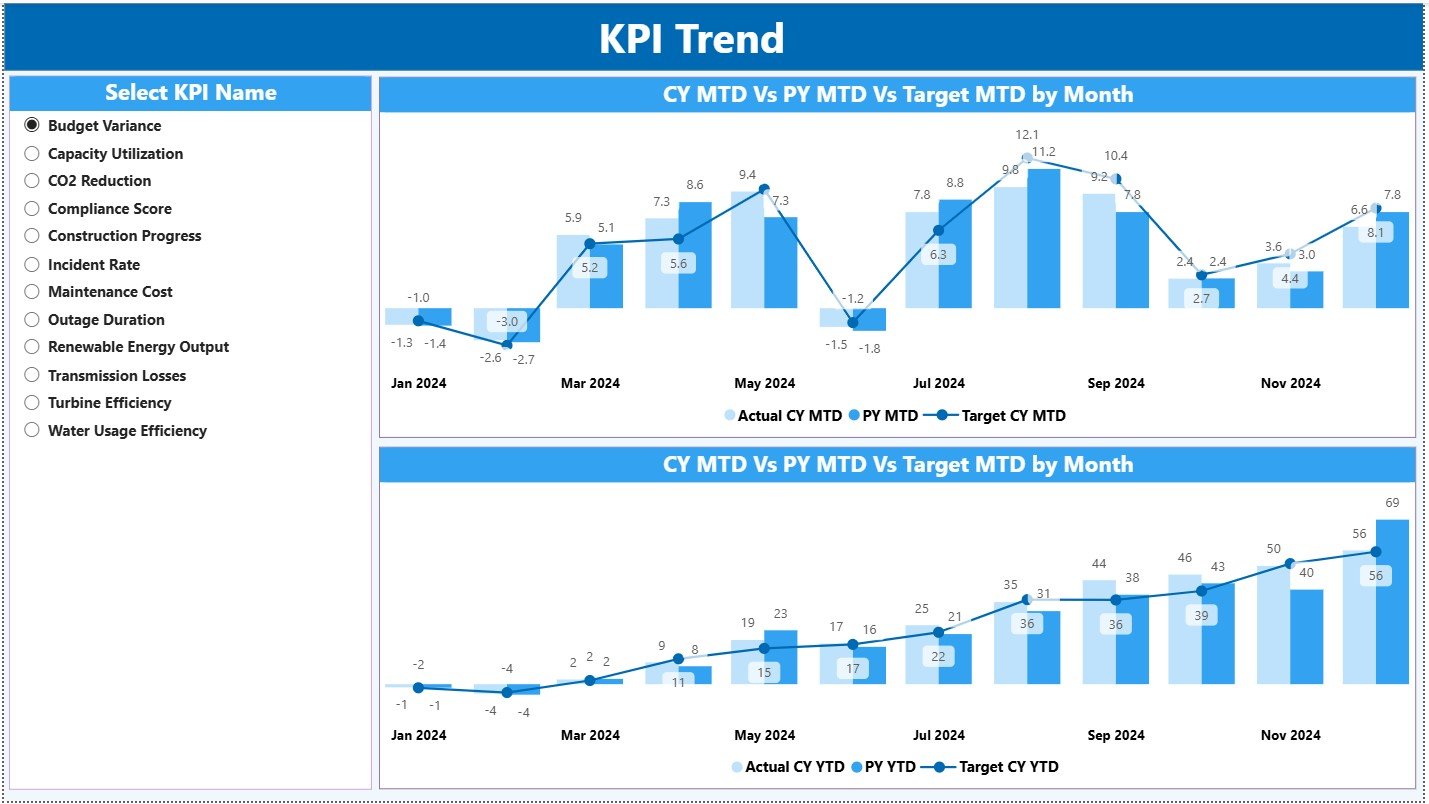
The KPI Trend Page shows month-wise performance movement for Actual, Target, and Previous Year, helping teams detect issues early.
📘 Structured KPI Definitions
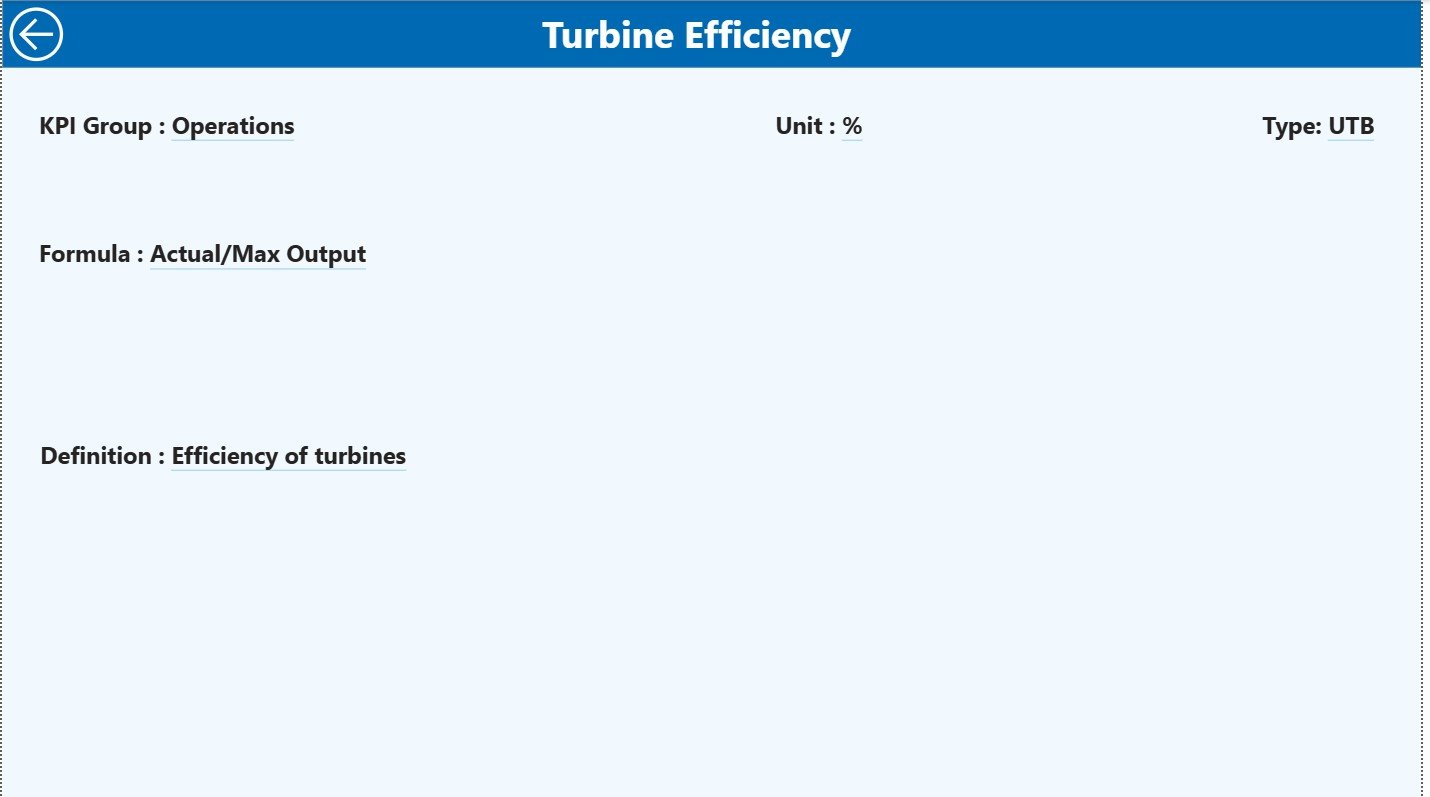
Drill-through pages ensure every KPI has a clear formula, definition, unit, and type (UTB/LTB)—perfect for aligning all departments.
🧮 Excel-Driven Data Entry
The dashboard connects to simple Excel sheets for Actual, Target, and Definitions—making updates seamless, even for non-technical users.
📦 What’s Inside the Renewable Infrastructure Projects KPI Dashboard in Power BI
This dashboard includes three powerful pages, each designed to support end-to-end renewable project monitoring.
📌 1. Summary Page – The Main Performance Overview
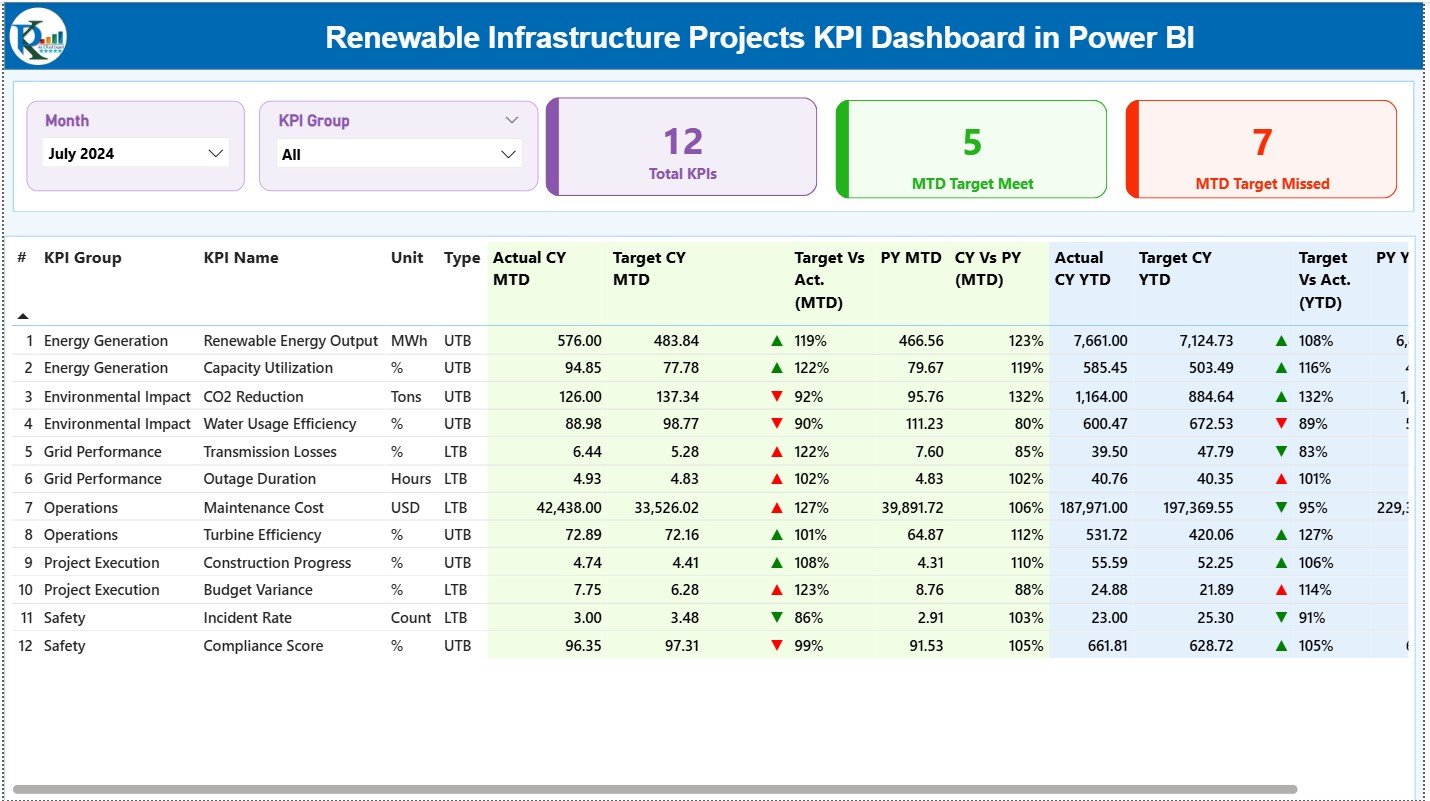
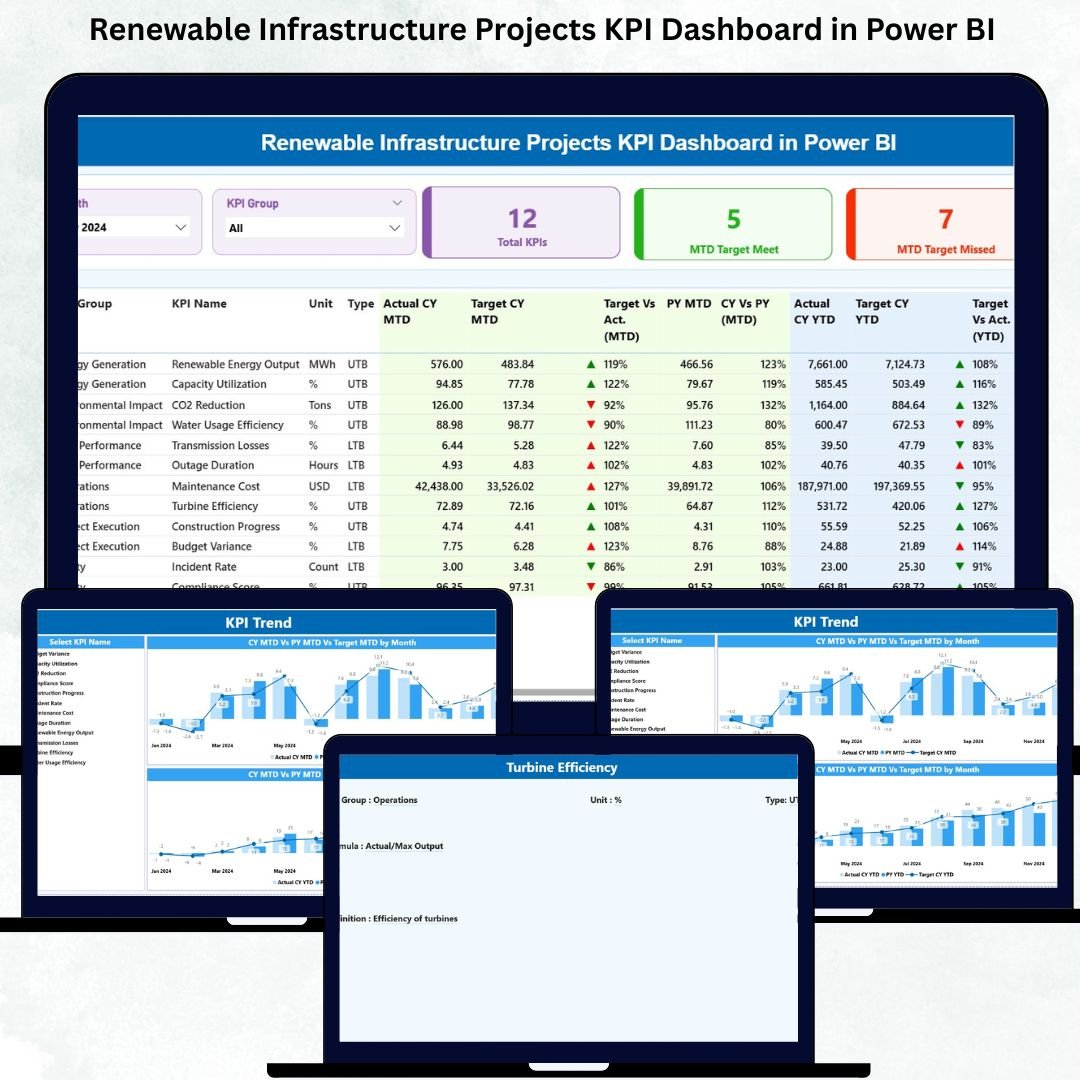
The Summary Page acts as the executive view of all KPIs.
⭐ Key Elements
Month Slicer
KPI Group Slicer
Total KPIs Count
MTD Target Meet Count
MTD Target Missed Count
Below the KPI cards, you see a complete KPI table showing:
KPI Number
KPI Group
KPI Name
Unit
KPI Type (UTB/LTB)
Actual MTD / Target MTD / Icon
Actual YTD / Target YTD / Icon
PY MTD & PY YTD comparisons
This page instantly shows which KPIs are on track and which need attention—saving hours of manual review work.
📌 2. KPI Trend Page – Visual Insights for Better Decisions
The Trend Page helps you understand the movement of each KPI across months.
📊 Charts Included
MTD Trend Chart (Actual vs Target vs Previous Year)
YTD Trend Chart (Actual vs Target vs Previous Year)
Managers use this page to identify:
Seasonal variations
Efficiency improvements
Cost spikes
Productivity declines
Year-over-year performance patterns
This makes the Trend Page ideal for review meetings, forecasting, and strategic planning.
📌 3. KPI Definition Page – Your Complete KPI Dictionary
This drill-through page provides full clarity on every KPI.
📘 Includes
KPI Number
KPI Group
KPI Name
Unit
Formula
KPI Definition
Type (LTB or UTB)
A back button lets users return to the Summary Page instantly.
Perfect for onboarding new team members or maintaining reporting consistency.
🛠 How to Use the Dashboard
1️⃣ Enter MTD & YTD actual numbers in the Input Actual Sheet
2️⃣ Enter monthly targets in the Input Target Sheet
3️⃣ Add KPI formulas & definitions in the KPI Definition Sheet
4️⃣ Refresh Power BI
5️⃣ Analyze performance using slicers, cards, and charts
This workflow is simple enough for beginners yet powerful enough for industry professionals.
👥 Who Can Benefit from This Dashboard
This template is ideal for:
⚡ Renewable energy project managers
🏗 EPC contractors
🌬 Wind & solar farm operators
📊 Sustainability teams
💼 Infrastructure consultants
🔧 Engineering & maintenance teams
🏢 Renewable energy investment firms
Anyone managing performance, timelines, or operational efficiency will benefit immediately.
### Click here to read the Detailed blog post
Visit our YouTube channel to learn step-by-step video tutorials
Watch the step-by-step video tutorial:
Compatibility and Requirements
- Works in Power BI Desktop, which is free to download. Microsoft explains how to get it in Get Power BI Desktop.
- The dashboard reads its data from Excel sheets: Input Actual, Input Target and KPI Definition.
Frequently Asked Questions
Which pages does the dashboard include?
Three pages: the Summary page, the KPI Trend page and the KPI Definition page.
Where do I enter my data?
Enter MTD and YTD actual numbers in the Input Actual sheet and monthly targets in the Input Target sheet. Add formulas and definitions in the KPI Definition sheet, then refresh Power BI.
Can I compare results with targets and last year?
Yes. The Summary page shows Actual, Target and previous year values for both MTD and YTD, with icons that show whether each target was met.
How do I see the trend of one KPI?
Open the KPI Trend page. It has an MTD chart and a YTD chart that compare Actual, Target and Previous Year by month.
Can I filter the dashboard?
Yes. The Summary page has a month slicer and a KPI group slicer.
Is there an Excel version?
Yes. See the Renewable Infrastructure Projects KPI Dashboard in Excel.
Related Renewable Infrastructure and Project Templates
- Renewable Infrastructure Projects KPI Dashboard in Excel: the same KPI dashboard in Excel
- Renewable Infrastructure Projects Dashboard in Power BI: another Power BI dashboard for renewable projects
- Renewable Infrastructure Projects Dashboard in Excel: an Excel dashboard for the same topic
- Project Management Dashboard in Excel: a general project view in Excel
- Power BI Dashboard Mega Collection: 15 Power BI templates in one download
Browse all Power BI KPI dashboards.