Stop guessing and start managing your IT support operations with precision! The IT Support Ticket Dashboard in Excel is a powerful, plug-and-play tool designed to help IT teams, support managers, and service departments track tickets, analyze performance, and boost customer satisfaction—all in real-time.
Whether you’re struggling with unresolved issues or juggling multiple support requests, this dashboard helps you stay organized, prioritize smartly, and ensure timely resolutions with visual clarity.
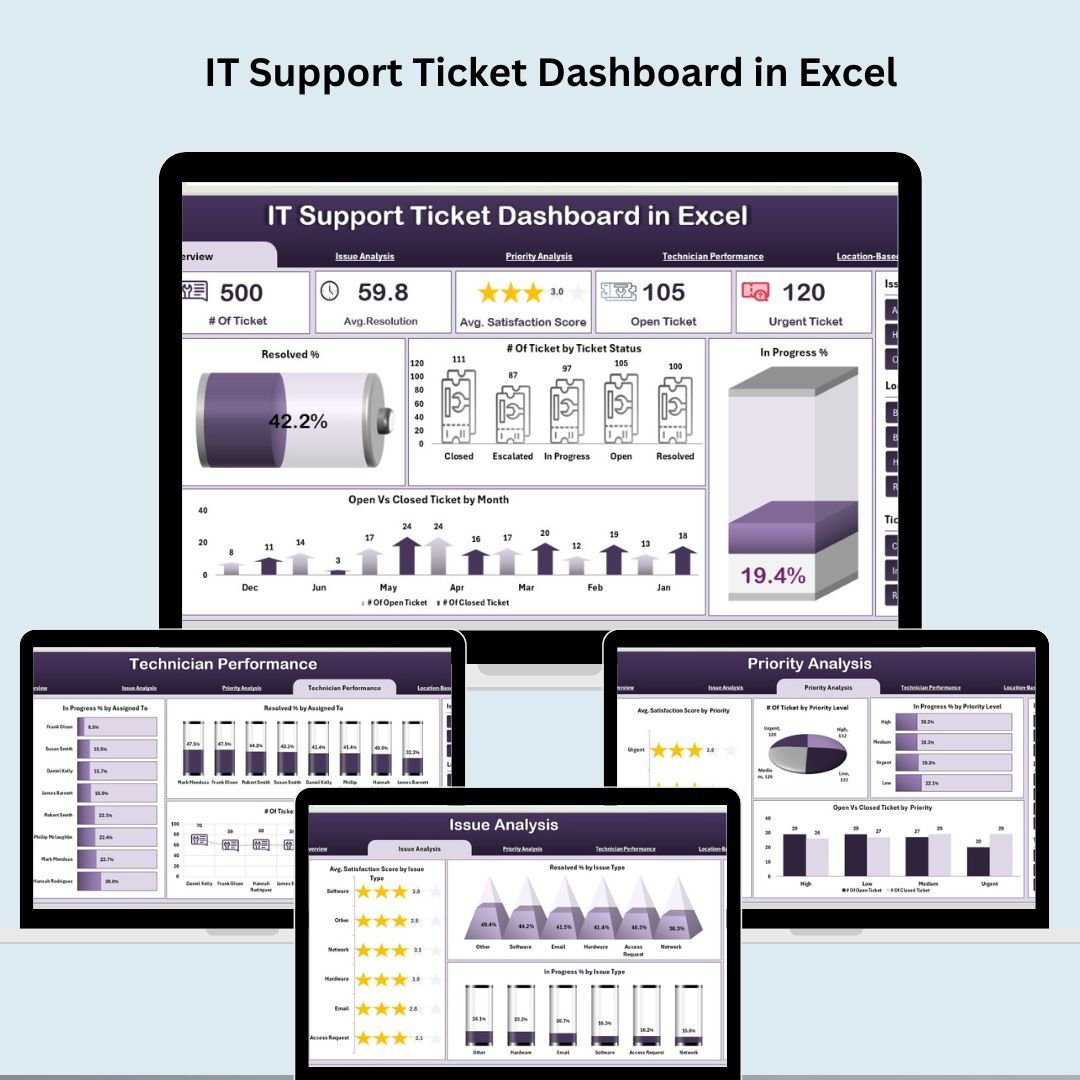
⚙️ Key Features of the IT Support Ticket Dashboard
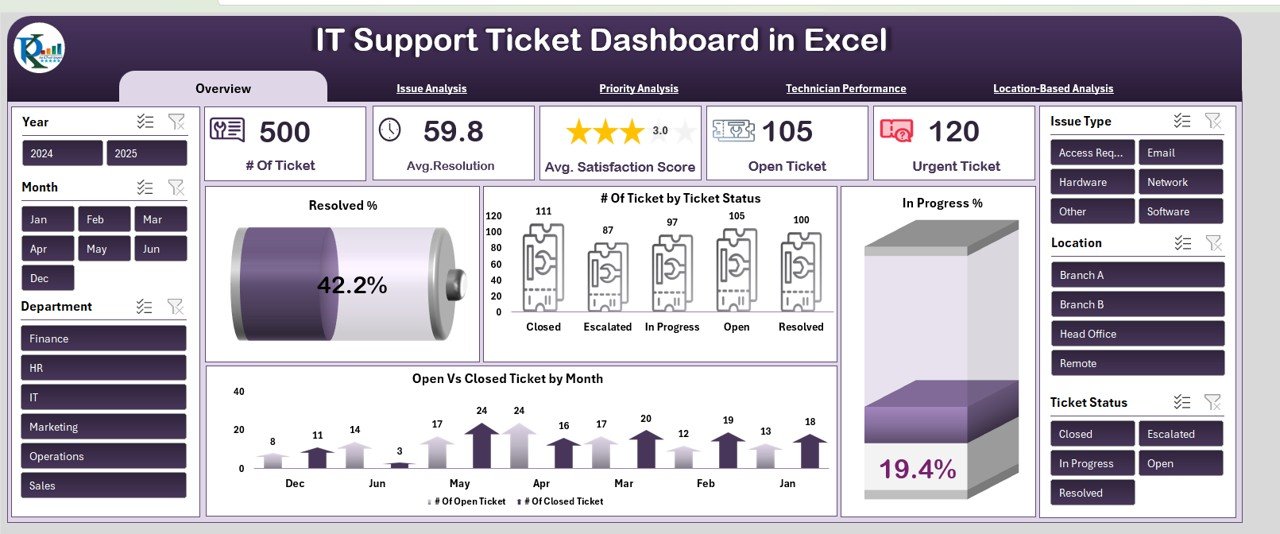
📊 Overview Dashboard
Get a real-time visual snapshot of:
-
Total Tickets
-
Avg. Resolution Time (Hrs)
-
Avg. Satisfaction Score
-
Open & Urgent Tickets
Includes interactive charts like:
-
✅ Resolved %
-
⏳ In Progress %
-
📅 Open vs Closed by Month
-
📌 Ticket Status Breakdown
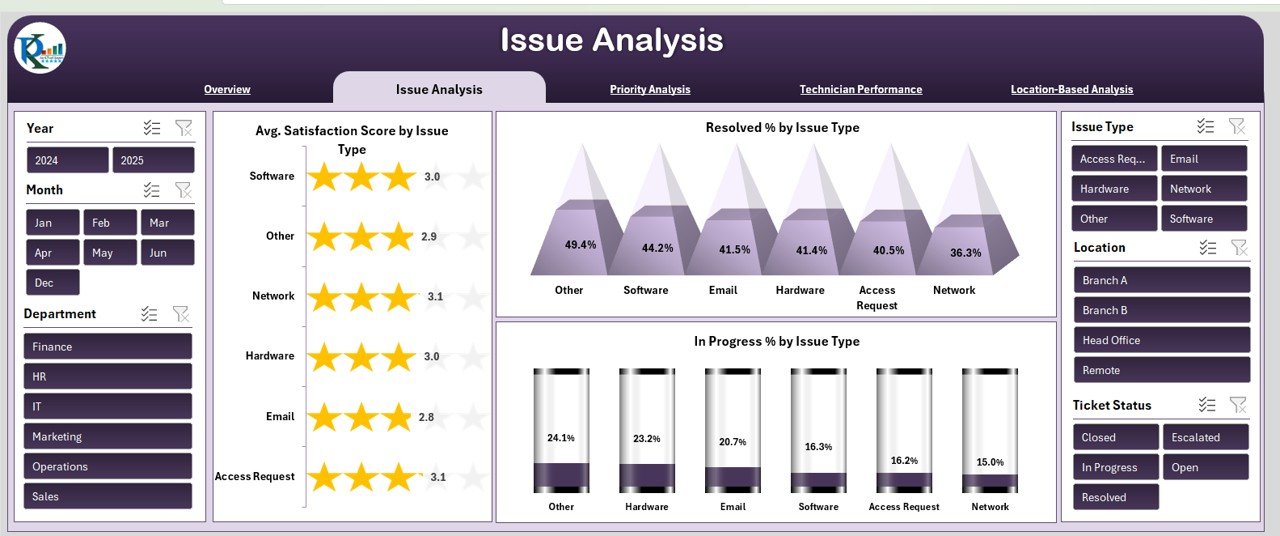
🔍 Issue Analysis Tab
Identify recurring problems and improve service quality.
Visuals include:
-
Avg. Satisfaction Score by Issue Type
-
Resolved % and In Progress % by Issue Type
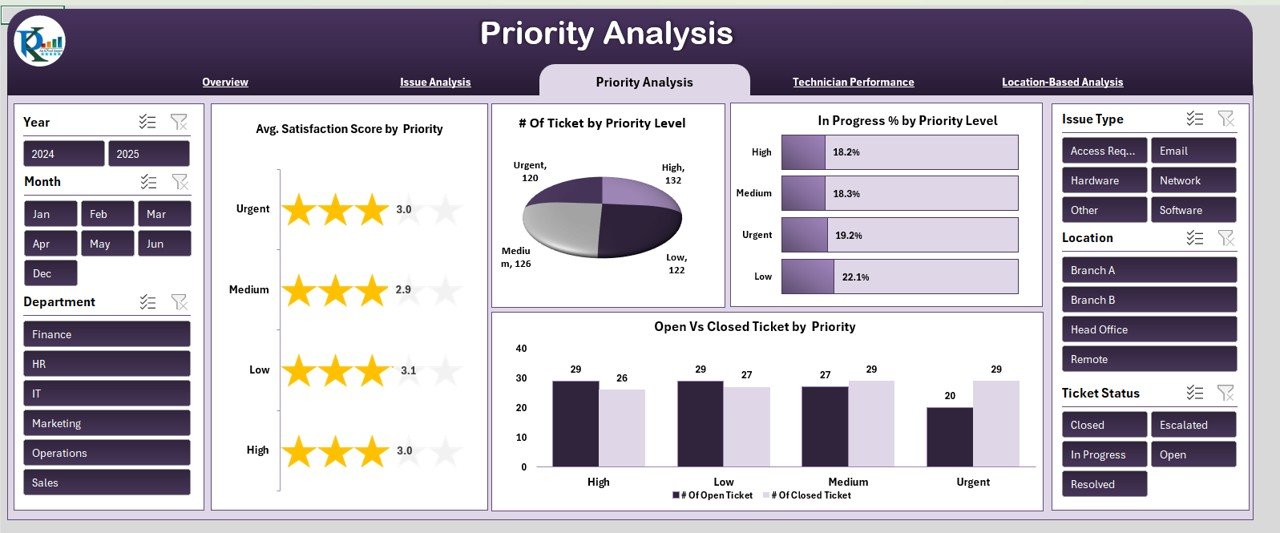
⚠️ Priority Analysis Tab
Optimize your workload by priority levels.
Charts show:
-
Satisfaction Score by Priority
-
Open vs Closed by Priority
-
In Progress % by Priority
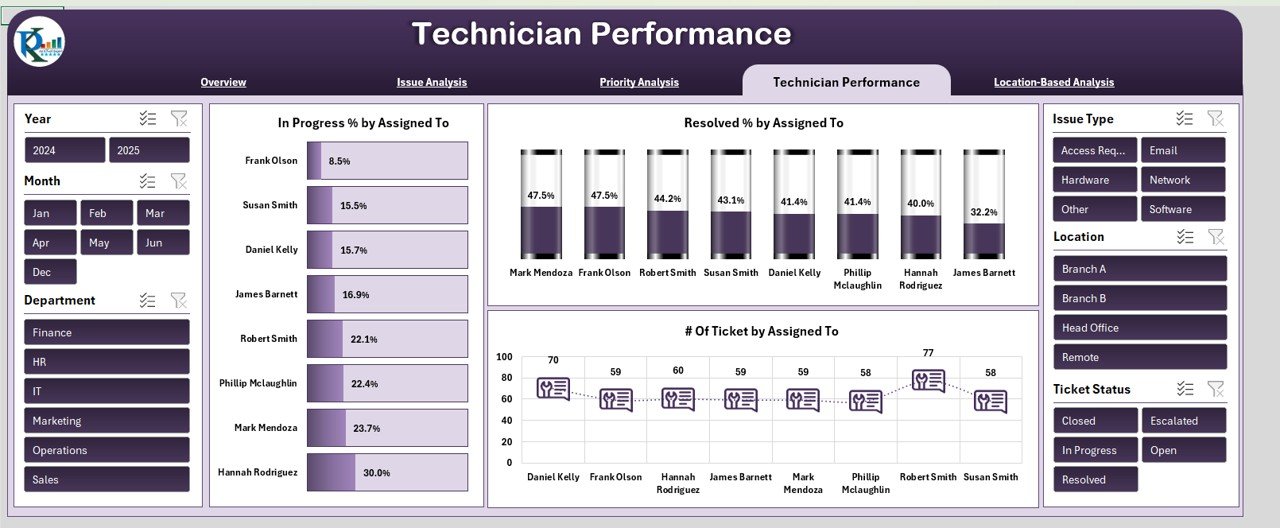
👨🔧 Technician Performance Tab
Track how well each technician performs.
View:
-
Resolved % and In Progress % by Technician
-
Ticket Load per Technician
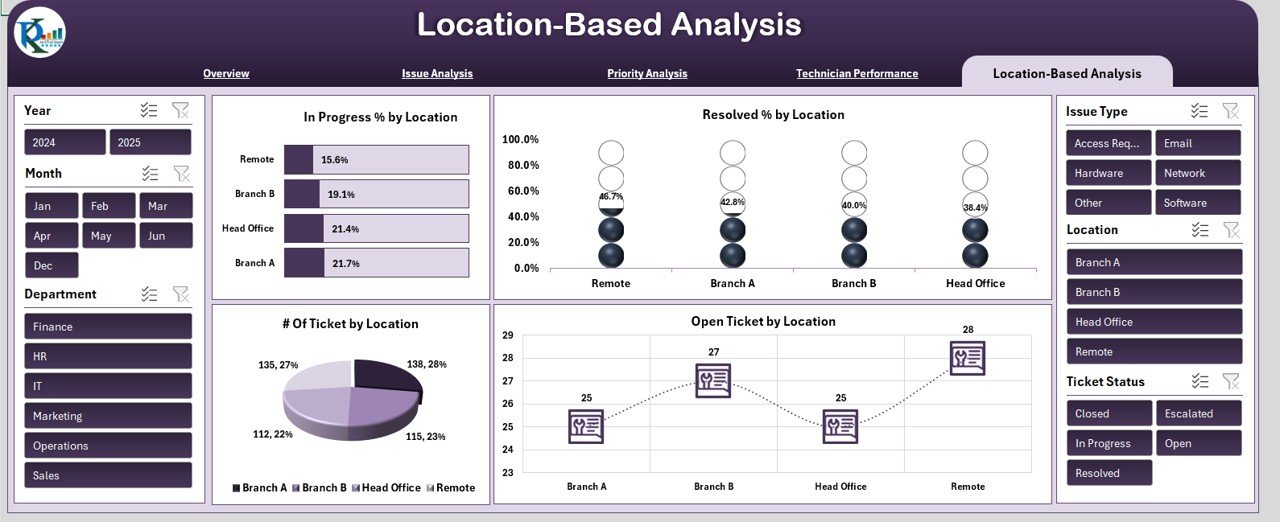
🌍 Location-Based Analysis Tab
Understand how IT support varies by region.
Includes:
-
Resolved & In Progress % by Location
-
Open Tickets and Total Tickets by Location
📁 Data Entry Sheet
Enter ticket data here and let the dashboard handle the rest.
Fields include:
-
Ticket ID, Date, Issue Type, Priority, Technician, Resolution Time, Satisfaction Score, and more.
📦 What’s Inside the IT Support Ticket Dashboard
You get access to 6 interactive, auto-updating worksheet tabs:
-
Overview – KPI Cards, Status Breakdown, Trend Charts
-
Issue Analysis – Performance insights by issue type
-
Priority Analysis – Compare ticket behavior by priority
-
Technician Performance – Analyze team member efficiency
-
Location-Based Analysis – Evaluate performance across locations
-
Data Sheet – Enter raw ticket data to drive the dashboard
All charts update in real-time based on the data you input!
🧑💼 How to Use the IT Support Ticket Dashboard
📝 Step 1: Input ticket data into the Data Sheet
🎯 Step 2: The dashboard updates automatically
📊 Step 3: Navigate tabs for detailed insights
📤 Step 4: Share PDF reports with your team
🔧 Step 5: Customize as per your IT environment
No coding. No formulas. Just clean, interactive visuals!
👥 Who Can Benefit from This Dashboard?
🧑💻 IT Support Teams – Track and resolve issues efficiently
🏢 IT Managers – Monitor staff performance and improve workflows
📞 Helpdesk Analysts – Identify bottlenecks and recurring issues
🛠️ MSPs & Outsourced IT Firms – Offer client-facing reporting
📊 Operations Leads – Align IT support with business outcomes
🏆 Why You’ll Love This Excel-Based Dashboard
✅ Fully customizable and Excel-powered
✅ Works offline or in Microsoft 365
✅ Zero learning curve—plug, update, analyze
✅ Clean visuals and slicers for quick filtering
✅ Real-time insight without any subscriptions
Whether you manage 20 tickets or 2,000—this dashboard will save time, improve performance, and help deliver top-tier IT support.
🔁 Click here to read the Detailed blog post
Click here to read the Detailed blog post


Reviews
There are no reviews yet.