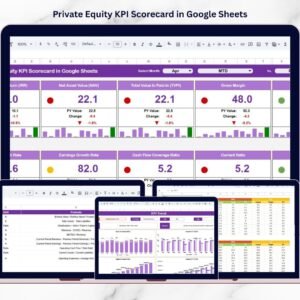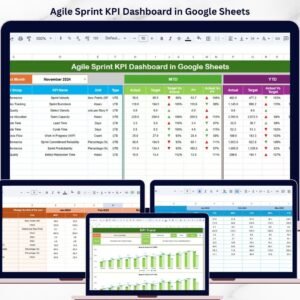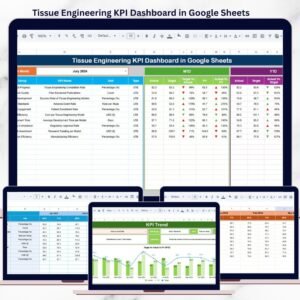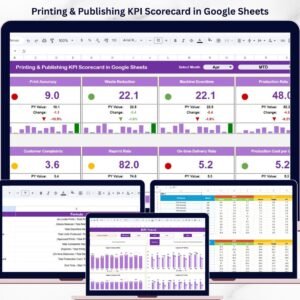

Managing investments successfully requires continuous monitoring, accurate performance measurement, and timely decision-making. Investment firms, portfolio managers, and financial analysts must evaluate multiple performance indicators regularly to ensure portfolios achieve expected returns while maintaining controlled risk exposure. However, many organizations still rely on manual spreadsheets and disconnected financial reports, making analysis slow, inconsistent, and difficult to interpret.
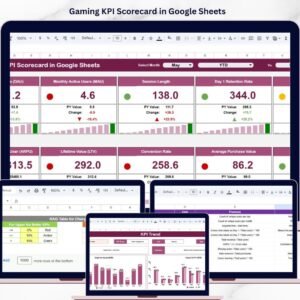
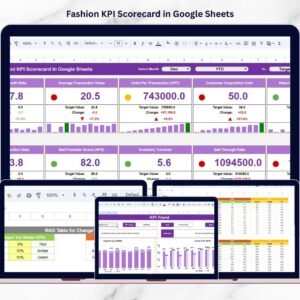
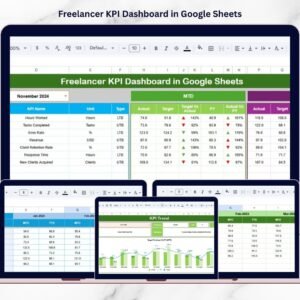
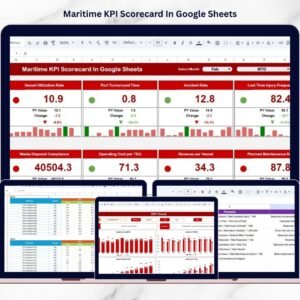
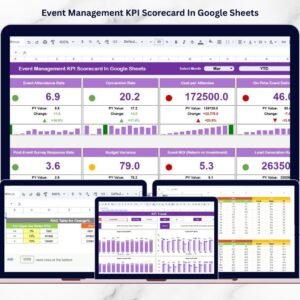
The Investment Management KPI Scorecard in Google Sheets provides a powerful, ready-to-use analytics solution designed to simplify investment performance tracking through structured Key Performance Indicators (KPIs). This interactive scorecard transforms complex financial data into clear visual insights, enabling professionals to evaluate portfolio performance efficiently and make data-driven investment decisions.
Instead of reviewing multiple financial reports, users analyze investment performance through a centralized dashboard that automatically updates based on selected months. Built entirely in Google Sheets, the scorecard supports cloud collaboration, automated calculations, and dynamic visualization without requiring expensive financial software.
Whether managing institutional portfolios, mutual funds, private investments, or corporate financial assets, this KPI scorecard delivers structured performance monitoring that improves transparency, accountability, and strategic planning.
🚀 Key Features of Investment Management KPI Scorecard in Google Sheets
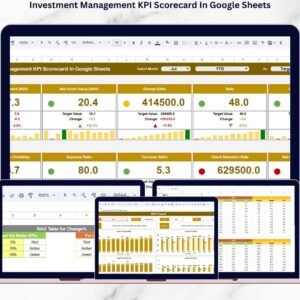
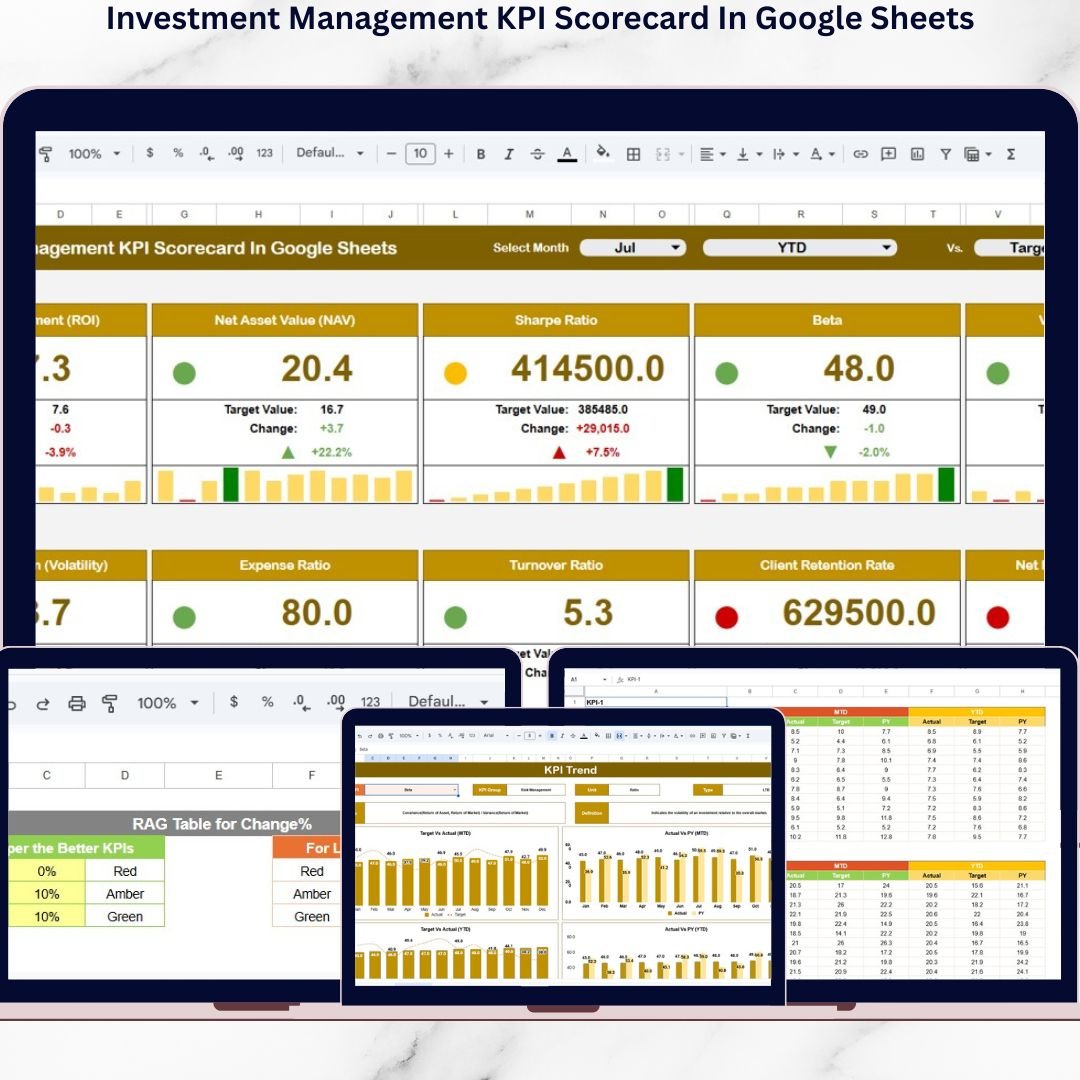
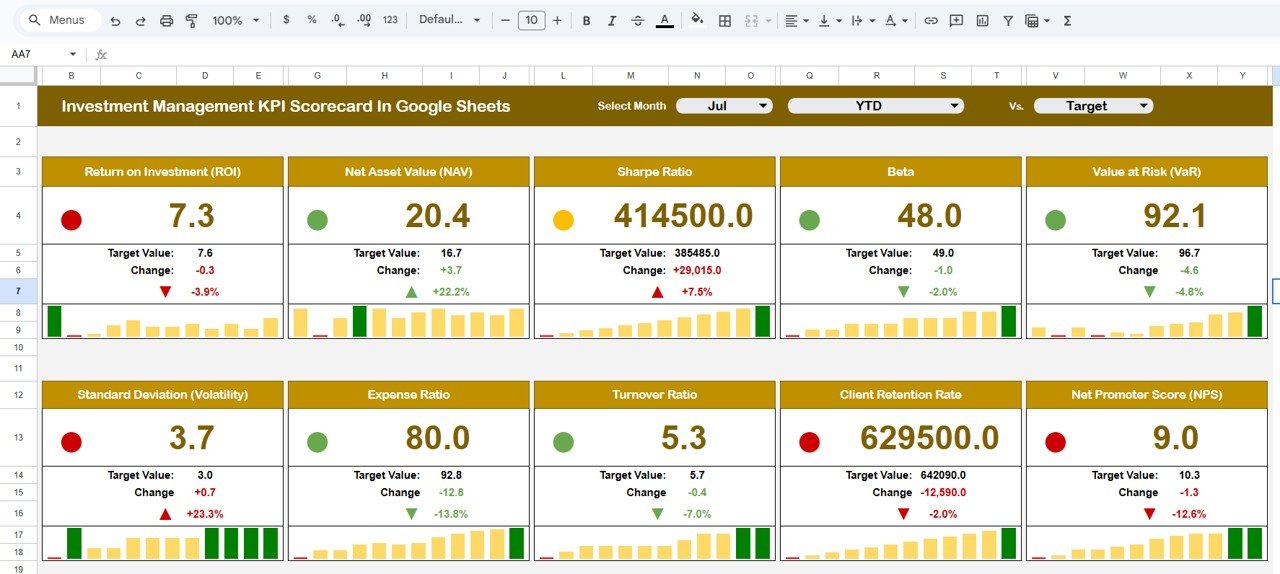
📊 Interactive KPI Scorecard Dashboard – Monitor investment performance from one centralized interface.
📅 Dynamic Month Selection – Instantly update reports using dropdown controls.
📈 MTD & YTD Performance Tracking – Analyze both monthly and cumulative results.
🚦 Traffic Light Performance Indicators – Quickly identify strong and weak KPIs.
📉 Performance Change Arrows – Visual indicators highlight improvement or decline.
📊 KPI Trend Monitoring – Analyze performance movement over time.
🧮 Automated Calculations – Reduce manual reporting effort.
🎨 Customizable Color Settings – Align dashboard visuals with organizational branding.
☁️ Cloud Collaboration – Teams work simultaneously in Google Sheets.
📦 Dashboard Structure – Worksheet Overview
The scorecard includes five structured worksheet tabs, each serving a specific analytical purpose.
📊 Scorecard Dashboard Sheet — Main Performance View
This is the primary analysis page where all investment KPIs appear together.
Key Functionalities
Month dropdown selection
KPI performance summary
MTD and YTD toggle views
Automatic KPI recalculation
Performance Indicators
🟢 Green → Strong performance
🟡 Amber → Moderate performance
🔴 Red → Needs improvement
Percentage arrows visually display performance movement, allowing managers to evaluate portfolio health instantly.
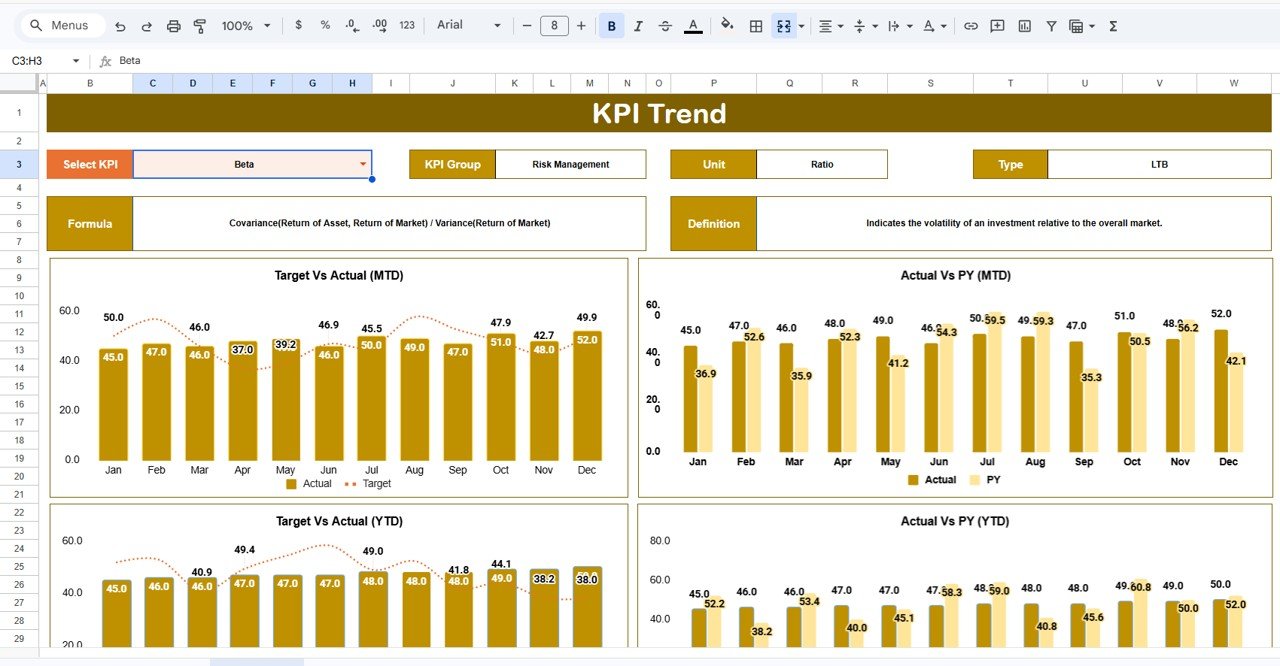
📈 Trend Sheet — KPI Performance Movement
Provides detailed KPI trend analysis.
Users select a KPI from dropdown (Cell C3) to view:
KPI Group
Measurement Unit
KPI Type (Lower/Upper Better)
KPI Formula
KPI Definition
Monthly trend visualization
This sheet helps analysts understand long-term investment behavior and performance direction.
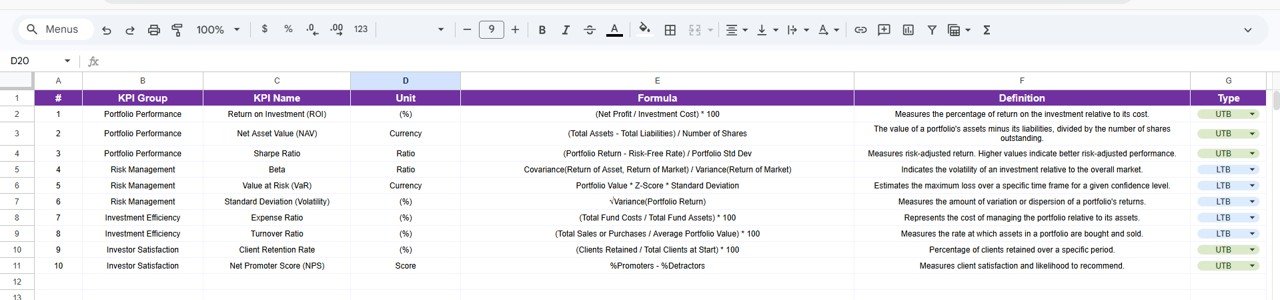
📘 KPI Definition Sheet — KPI Master Database
Acts as a centralized KPI reference library.
Maintains:
KPI Name
KPI Group
KPI Unit
KPI Formula
KPI Definition
Ensures standardized reporting across teams and portfolios.
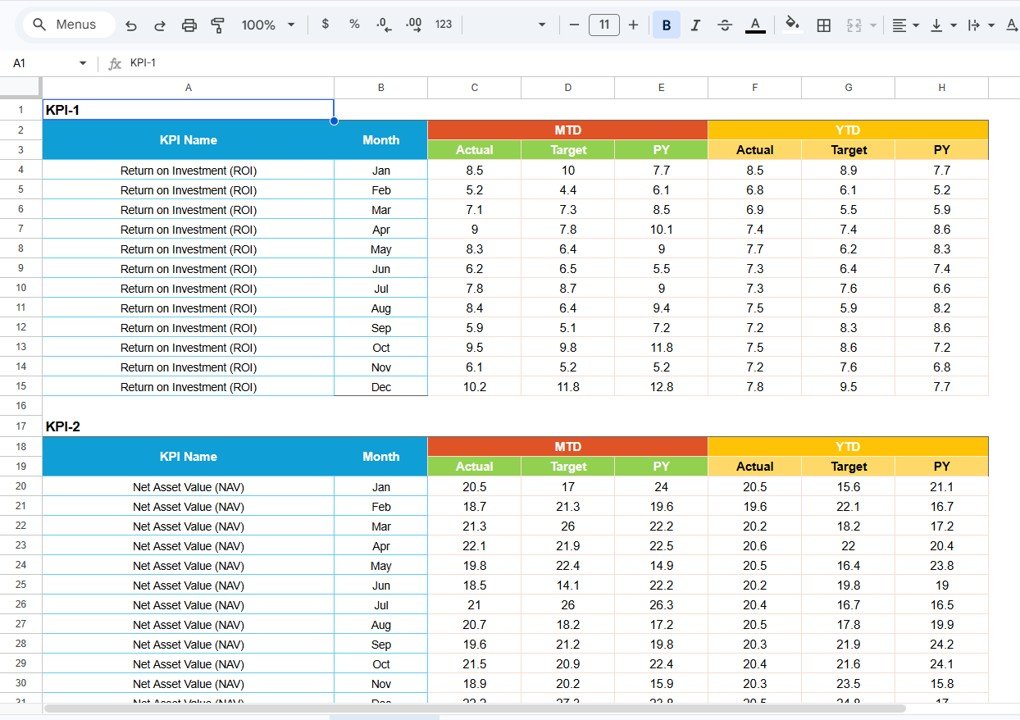
🧾 Data Input Sheet — Investment Data Entry
Used to enter investment performance values.
Simple Process
Input monthly KPI values
Update portfolio performance metrics
Dashboard updates automatically
Structured inputs ensure consistent and accurate analytics.
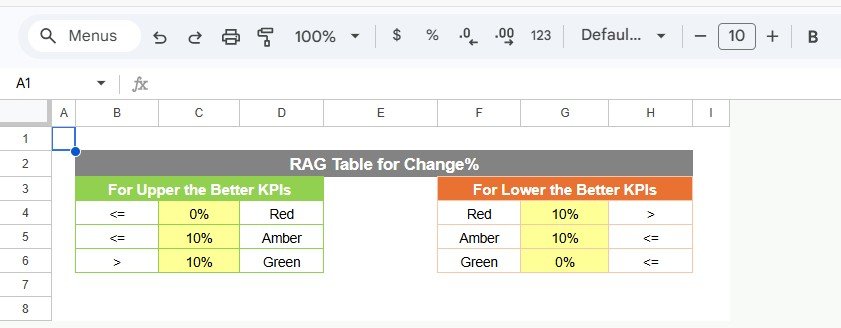
🎨 Colour Settings Sheet — Visual Customization
Controls dashboard appearance and performance thresholds.
Customization includes:
Traffic light colors
KPI performance thresholds
Arrow formatting rules
Organizations can adapt visuals according to reporting standards or branding.
📊 Investment KPIs You Can Track
This scorecard supports multiple investment performance metrics such as:
Portfolio Return (%)
Risk-Adjusted Return
Sharpe Ratio
Asset Allocation Efficiency
Portfolio Growth Rate
Benchmark Comparison
Investment Cost Ratio
Drawdown Percentage
Return Volatility
Revenue from Investments
⭐ Advantages of Investment Management KPI Scorecard
✅ Centralized Investment Monitoring
All portfolio KPIs available in one scorecard.
✅ Real-Time Performance Insights
Instant visibility into investment results.
✅ Improved Decision-Making
Visual indicators simplify complex analysis.
✅ Flexible Performance Tracking
Monthly and yearly monitoring supported.
✅ Easy Customization
Modify KPIs based on investment strategy.
✅ Cloud Collaboration
Finance teams work together seamlessly.
✅ Cost-Effective Analytics Solution
No expensive portfolio software required.
⚙️ How to Use the Investment KPI Scorecard
1️⃣ Define KPIs in KPI Definition Sheet.
2️⃣ Enter investment targets and performance data.
3️⃣ Update monthly KPI values.
4️⃣ Select reporting month from dashboard.
5️⃣ Review performance indicators and trends.
6️⃣ Use insights to optimize investment strategy.
Within minutes, users gain a fully operational investment analytics system.
👥 Who Can Use This Scorecard?
Perfect for:
💼 Portfolio Managers
📊 Investment Analysts
🏦 Asset Management Firms
📈 Financial Advisors
💰 Wealth Management Companies
📉 Corporate Finance Teams
🧮 Financial Consultants
Click here to Read detailed blog post
Watch the step-by-step video tutorial:
🎓 Learn More
Visit our YouTube channel for step-by-step tutorials:
👉 https://youtube.com/@NeotechNavigators
Compatibility and Requirements
- Works in Google Sheets. You need a free Google account and a web browser.
- You pick the reporting month and the KPI from dropdowns. Google explains dropdowns in Create an in-cell dropdown list.
Frequently Asked Questions
Which worksheets are included?
Five worksheets: Scorecard Dashboard, Trend, KPI Definition, Data Input and Colour Settings.
How do I update the scorecard?
Enter your monthly KPI values on the Data Input sheet and your KPI details on the KPI Definition sheet. Then select a month on the Scorecard Dashboard and it recalculates.
Can I view both monthly and year-to-date results?
Yes. The Scorecard Dashboard has MTD and YTD toggle views, so you can switch between the month and the cumulative result.
How do I see the trend for one KPI?
Open the Trend sheet and choose a KPI from the dropdown in cell C3. It shows the KPI group, unit, type (Lower or Upper Better), formula, definition and the monthly trend.
Can I change the colors and thresholds?
Yes. The Colour Settings sheet controls the traffic light colors, the KPI performance thresholds and the arrow formatting.
Is there an Excel version?
Yes. See the Investment Management KPI Scorecard in Excel.
Related Investment Templates
- Investment Management KPI Scorecard in Excel: the same scorecard for Excel
- Investment Management Dashboard in Google Sheets: a dashboard view of portfolio performance
- Investment Tracker in Google Sheets: a tracker for your holdings
- Rental Property Investment Dashboard in Google Sheets: for property investments
- Google Sheets Business Pack (Pro): 14 business templates in one download
Browse all Google Sheets KPI dashboards.