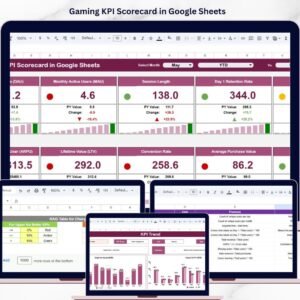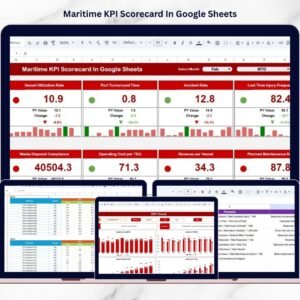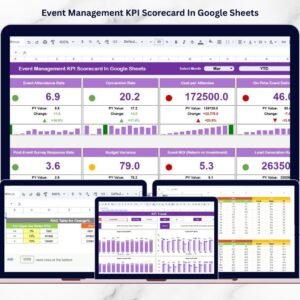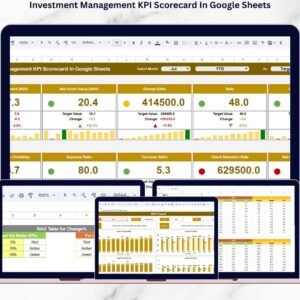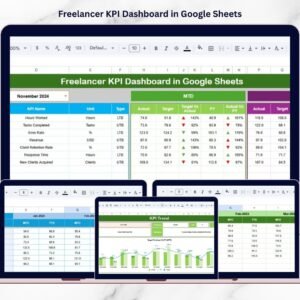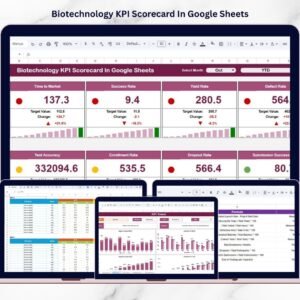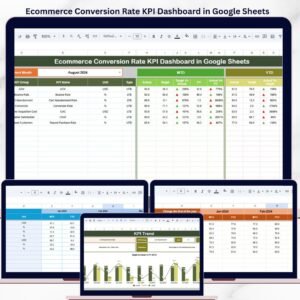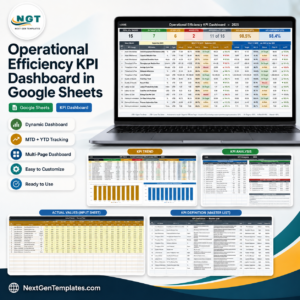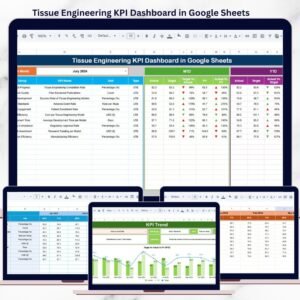
Tissue engineering is a highly specialized and data-intensive field where success depends on precise monitoring of research efficiency, quality outcomes, cost control, and long-term performance trends. From experimental productivity and process efficiency to outcome quality and timeline adherence, teams must track multiple KPIs simultaneously. However, managing these KPIs manually across multiple spreadsheets often leads to inconsistencies, errors, and delayed insights.
That is exactly why the Tissue Engineering KPI Dashboard in Google Sheets becomes an essential performance management tool.
This professionally designed, ready-to-use KPI dashboard helps tissue engineering research teams, biotech organizations, and life-science professionals track, analyze, and compare critical KPIs in one structured and automated Google Sheets file. Instead of spending hours consolidating reports, teams can instantly visualize performance, identify gaps, and make data-driven decisions.
Because the dashboard is built entirely in Google Sheets, it is cloud-based, collaborative, and easy to customize—without requiring any coding, BI tools, or advanced technical skills.
🚀 Key Features of the Tissue Engineering KPI Dashboard
📊 Centralized KPI Monitoring
Track all key tissue engineering KPIs in one dashboard, including:
Month-to-Date (MTD) performance
Year-to-Date (YTD) performance
Target vs Actual comparison
Previous Year vs Current Year comparison
This structure supports both short-term operational tracking and long-term strategic evaluation.
🎯 Structured KPI Governance
Each KPI is maintained with:
Unit of measurement
Formula
Definition
KPI Type:
UTB (Upper the Better)
LTB (Lower the Better)
This ensures consistency, transparency, and audit readiness.
📂 Dashboard Structure – 6 Structured Worksheets
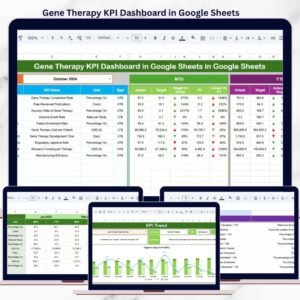
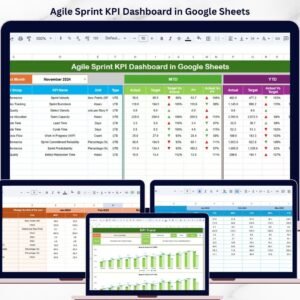
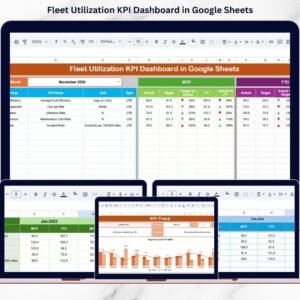
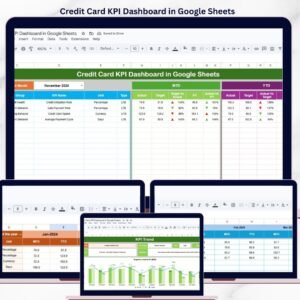
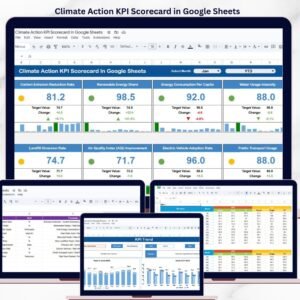
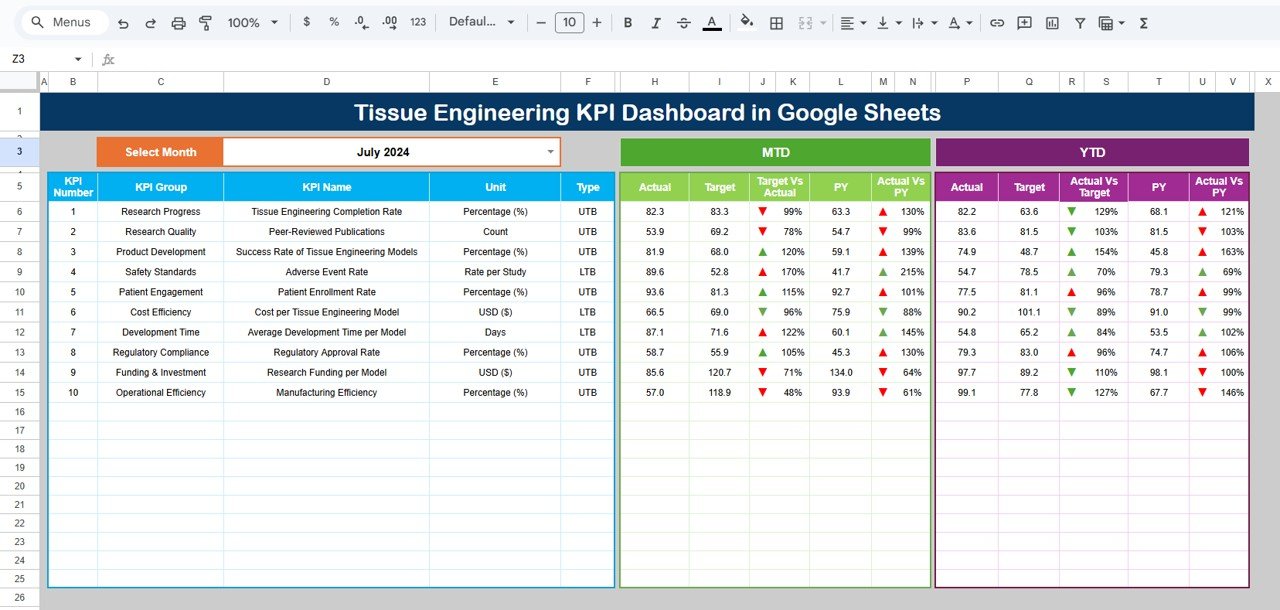
🏠 1. Dashboard Sheet – KPI Overview
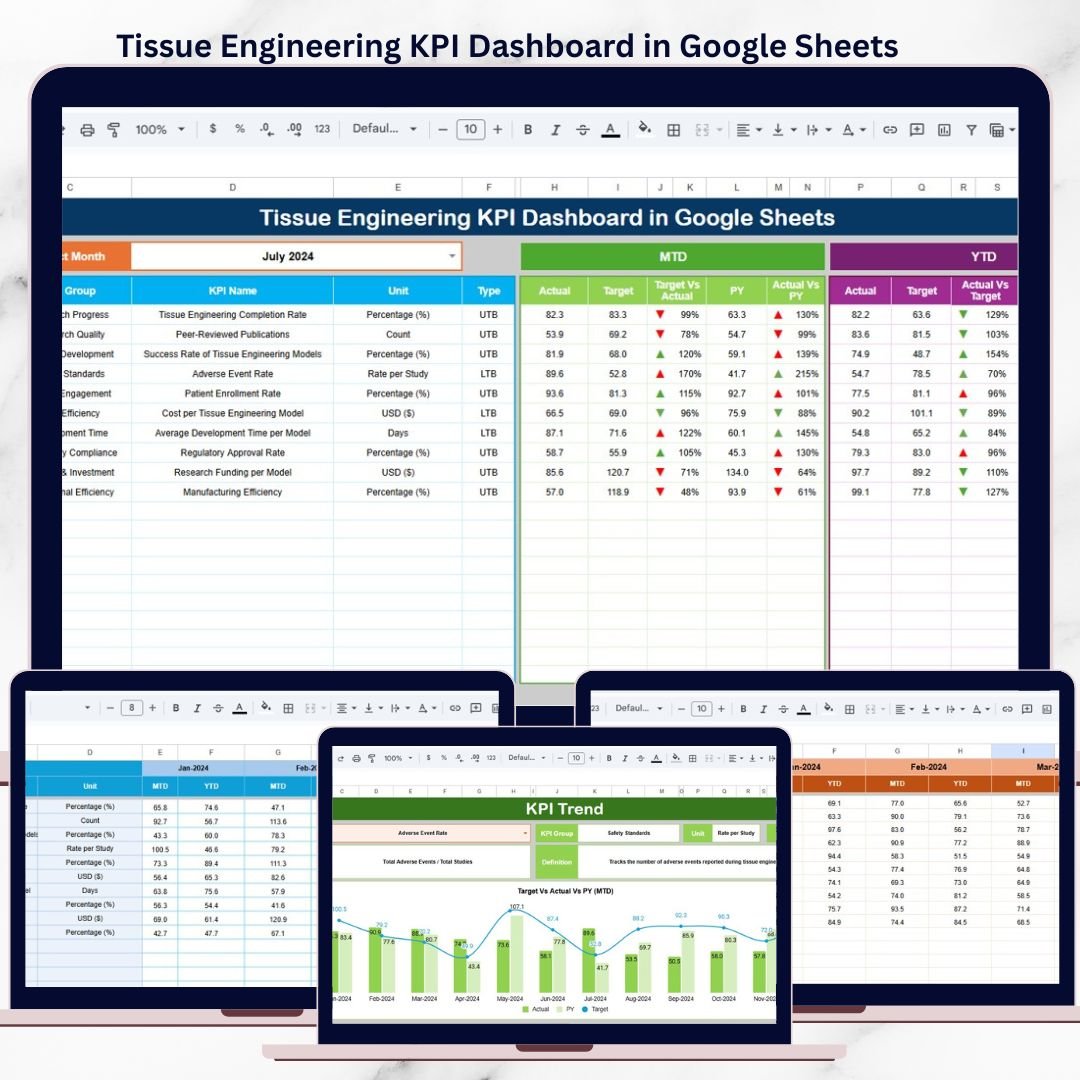
This is the main executive dashboard where all KPIs are displayed together.
Key Capabilities
Month selector available in Cell D3
Automatic refresh of all KPIs when the month changes
Displays:
MTD Actual, Target, Previous Year
YTD Actual, Target, Previous Year
Built-in variance analysis:
Target vs Actual
Previous Year vs Actual
Visual indicators:
🚦 Traffic-light colors
🔺 Up arrows for improvement
🔻 Down arrows for decline
This sheet is ideal for leadership reviews, research governance meetings, and performance discussions.
📈 2. KPI Trend Sheet – KPI-Wise Analysis
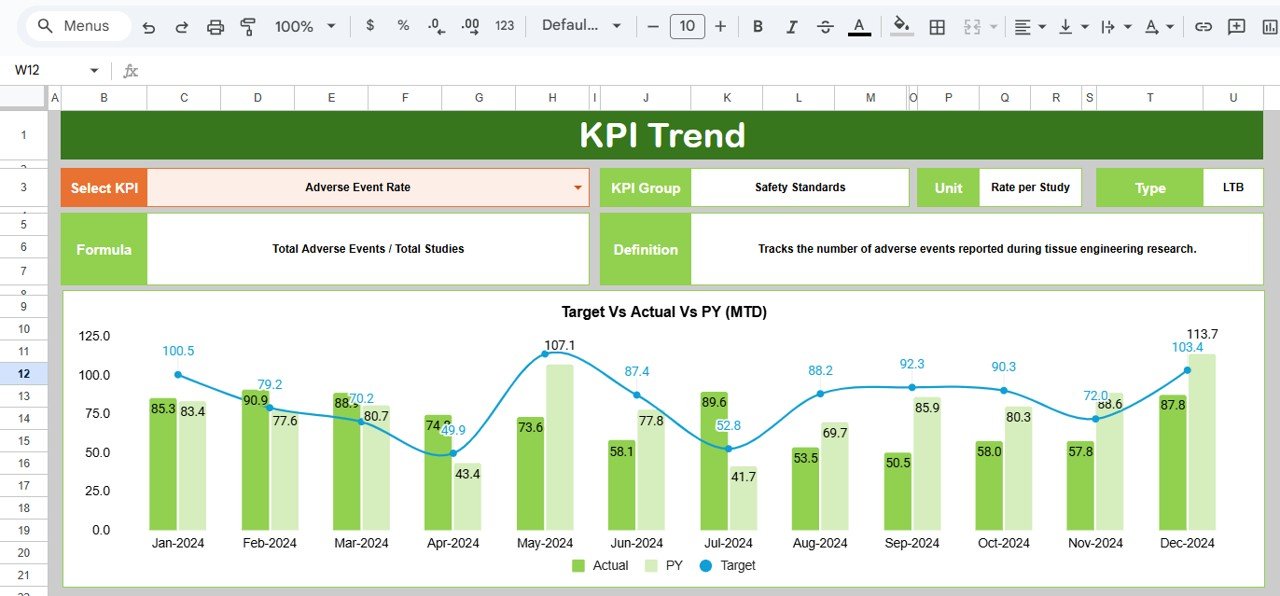
This sheet enables deep-dive analysis of individual KPIs.
How It Works
Select a KPI from the dropdown in Cell C3
Automatically displays:
KPI Group
KPI Unit
KPI Type (UTB / LTB)
KPI Formula
KPI Definition
This ensures all stakeholders interpret KPIs consistently and correctly.
🧾 3. Actual Number Sheet – Current Year Data Entry
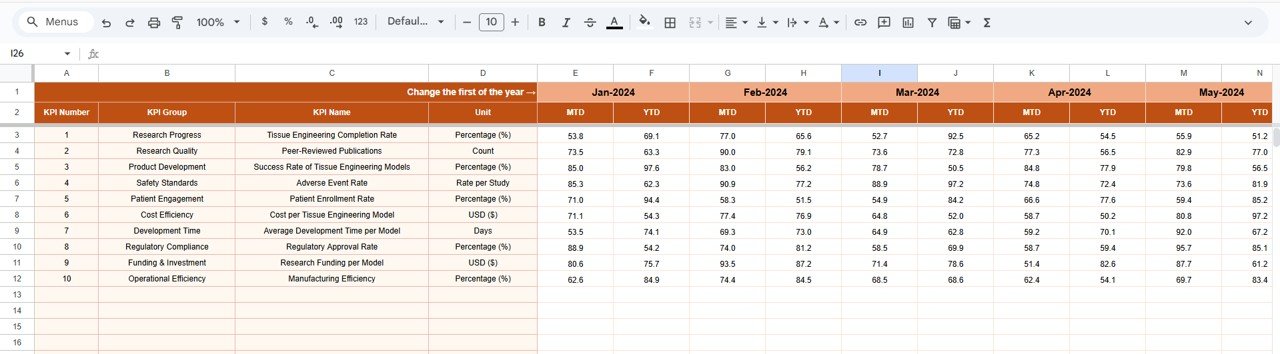
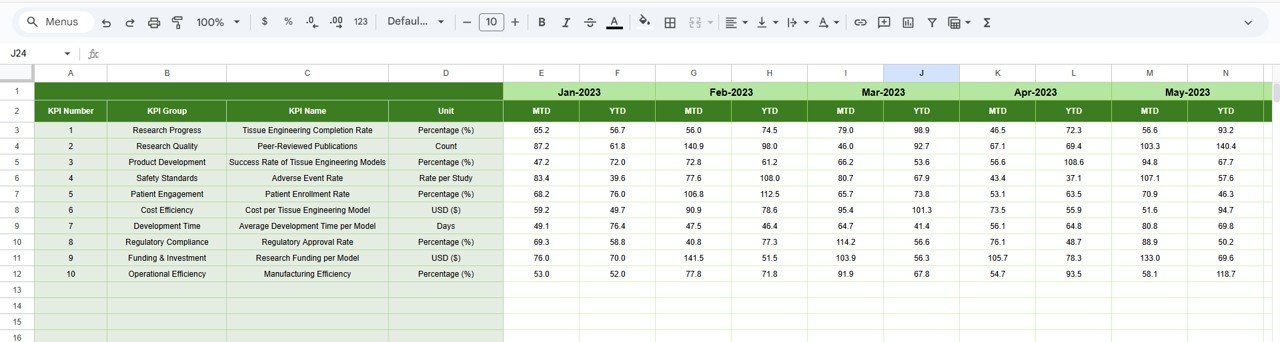
This sheet is used to enter actual KPI values.
Key Features
Enter MTD and YTD actual values
Month selection available in Cell E1
Only the first month of the year needs to be defined once
Remaining months adjust automatically
This design minimizes manual effort and reduces the risk of data errors.
🎯 4. Target Sheet – Performance Goals
The Target Sheet stores planned KPI targets.
What You Define
Monthly (MTD) targets
Cumulative (YTD) targets
Targets feed directly into:
Dashboard variance calculations
Performance indicators
Trend analysis
This ensures alignment between research goals and operational execution.
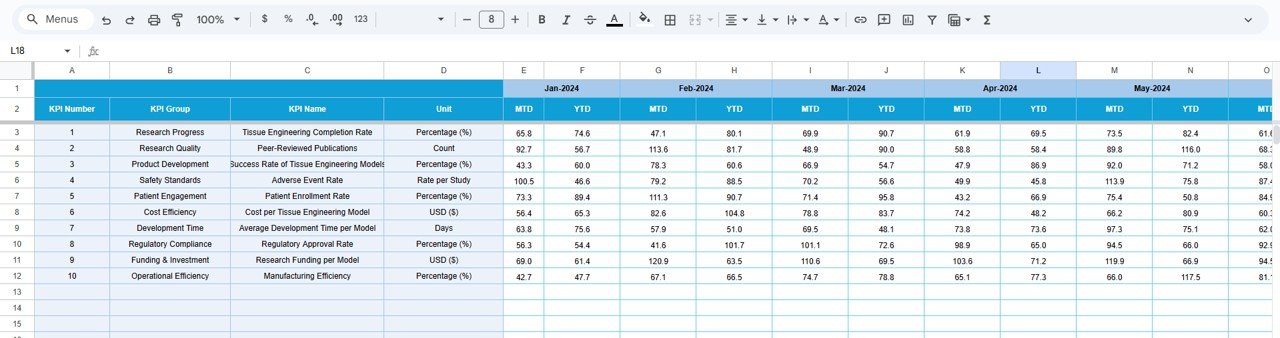
📊 5. Previous Year Number Sheet – Historical Comparison
This sheet captures last year’s KPI values.
Purpose
Enables year-over-year performance analysis
Highlights long-term improvements or declines
Supports benchmarking and strategic planning
📚 6. KPI Definition Sheet – KPI Master
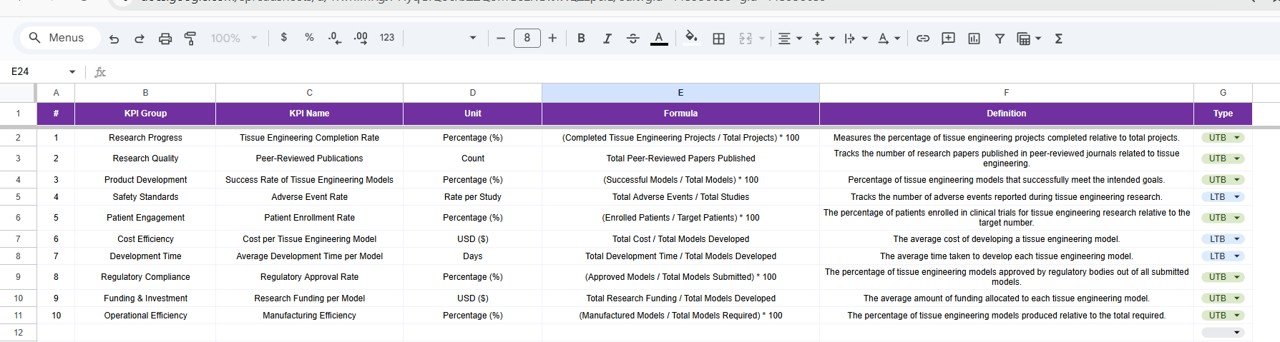
This is the backbone of the dashboard.
Columns Included
KPI Name
KPI Group
Unit
Formula
KPI Definition
KPI Type (UTB / LTB)
Centralizing KPI logic ensures clarity, governance, and scalability.
🎯 Advantages of the Tissue Engineering KPI Dashboard
Centralized KPI tracking for tissue engineering projects
Significant time savings compared to manual reporting
Clear visibility into performance gaps
Easy comparison of actuals vs targets and prior year
Fully cloud-based in Google Sheets
Reusable across projects, programs, and years
👥 Who Should Use This Dashboard?
Tissue Engineering Research Teams
Biotechnology & Life-Science Companies
R&D and Innovation Teams
Quality and Process Improvement Teams
Research Program Managers
Data and Performance Analysts
Click here to Read detailed blog post
Watch the step-by-step video tutorial:
Visit our YouTube channel to learn step-by-step video tutorials
👉 Youtube.com/@NeotechNavigators