

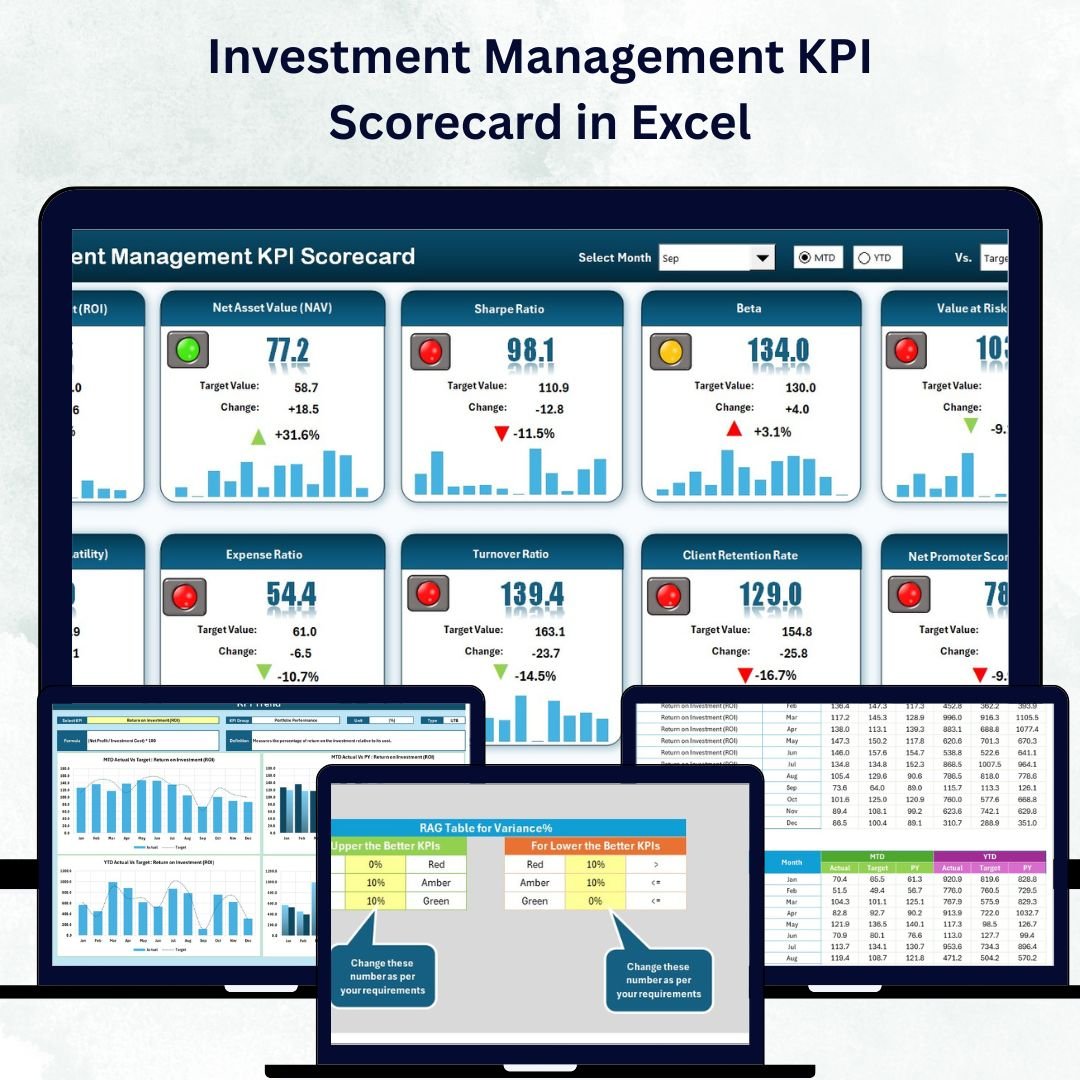


In the fast-paced financial world, smart investors rely on data 📊. To stay competitive, portfolio managers, mutual-fund analysts, and institutional-asset professionals must monitor performance precisely and act quickly on insights. The Investment Management KPI Scorecard in Excel is the perfect solution — a ready-to-use, interactive tool that tracks, visualizes, and compares your investment KPIs with absolute clarity.
This Excel-based scorecard turns raw numbers into meaningful intelligence. Whether you’re measuring ROI, AUM growth, expense ratio, or client retention, it provides Month-to-Date (MTD) and Year-to-Date (YTD) comparisons that instantly reveal what’s working — and what needs attention.
Built entirely in Microsoft Excel, it’s simple, powerful, and cost-effective — ideal for finance professionals who want flexibility without the complexity of heavy analytics software 💼.
⚙️ Key Features of the Investment Management KPI Scorecard in Excel
📊 Four Functional Sheets – Scorecard, KPI Trend, Input Data, and KPI Definition.
🎯 MTD & YTD Performance Tracking – Monitor short-term and long-term progress.
💡 Actual vs Target vs Previous Year (PY) – Benchmark performance instantly.
🟢 Conditional Formatting Indicators – Color-coded arrows and icons for quick visual feedback.
📈 Dynamic Charts & Dropdown Filters – Analyze each KPI with ease.
📘 Fully Editable Data Tables – Add, remove, or update KPIs anytime.
💼 Professional Design – Built for portfolio managers and financial analysts.
💰 No Extra Software Needed – Everything runs smoothly in Excel.
📦 What’s Inside the Scorecard
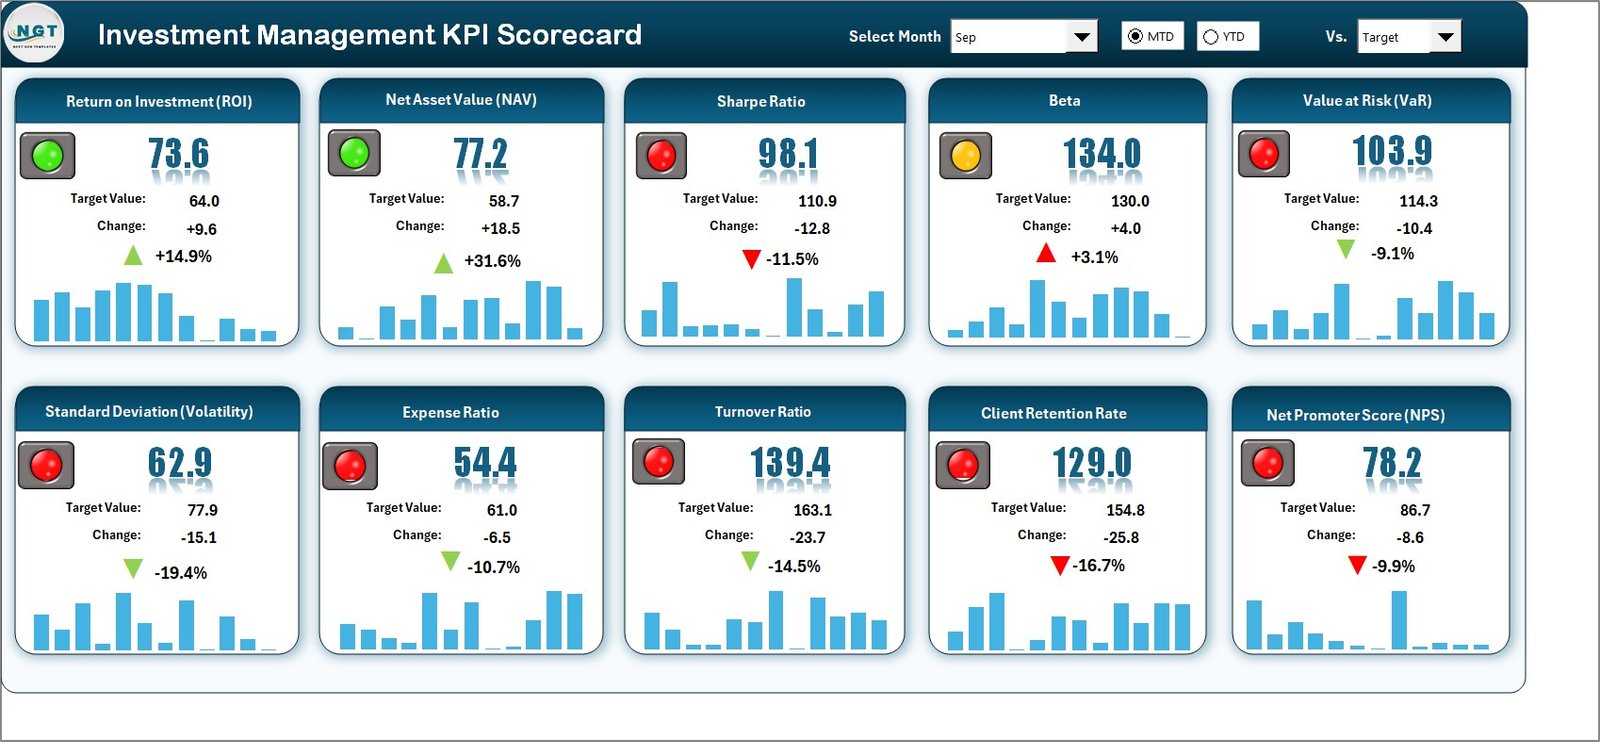
1️⃣ Scorecard Sheet – Your Main Dashboard View
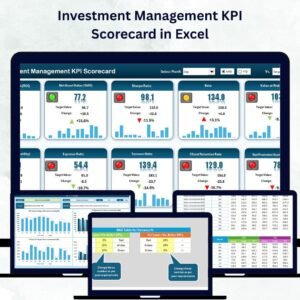
The Scorecard Sheet is the heart of this template.
Select Month and MTD/YTD options via dropdowns 📅.
Compare Actual vs Target values side by side.
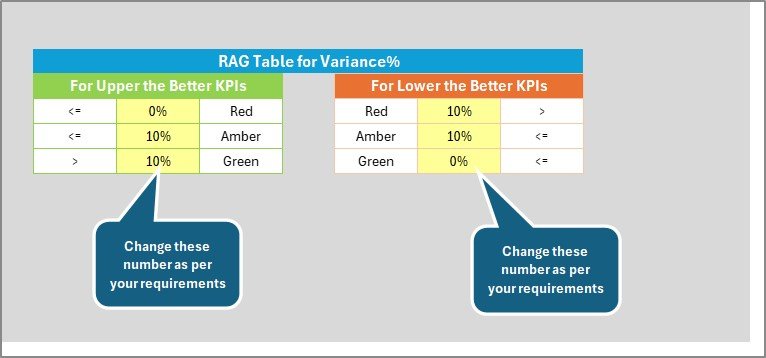
View color indicators (green for above target, yellow for near, red for below).
Instantly see your investment performance snapshot in one place.
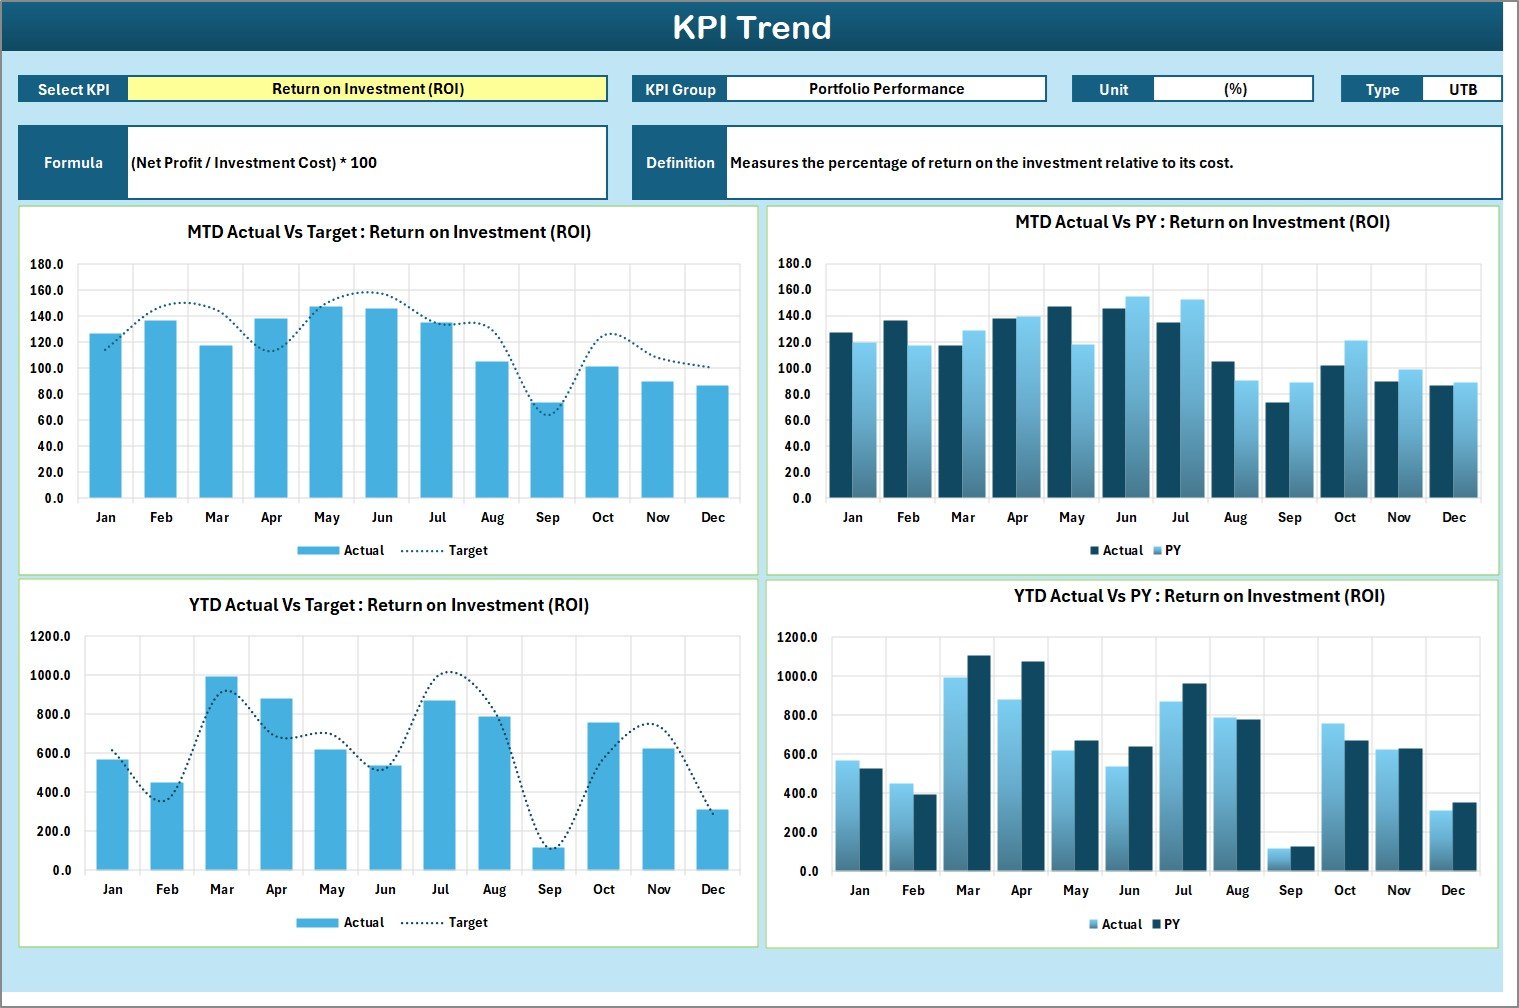
2️⃣ KPI Trend Sheet – Visualize Growth Patterns
Choose a specific KPI (C3 dropdown).
Automatically see its Group, Unit, Type (LTB or UTB), Formula, and Definition.
MTD and YTD trend charts show Actual, Target, and PY values.
📈 Spot performance shifts quickly and respond with strategic action.
3️⃣ Input Data Sheet – The Data Engine
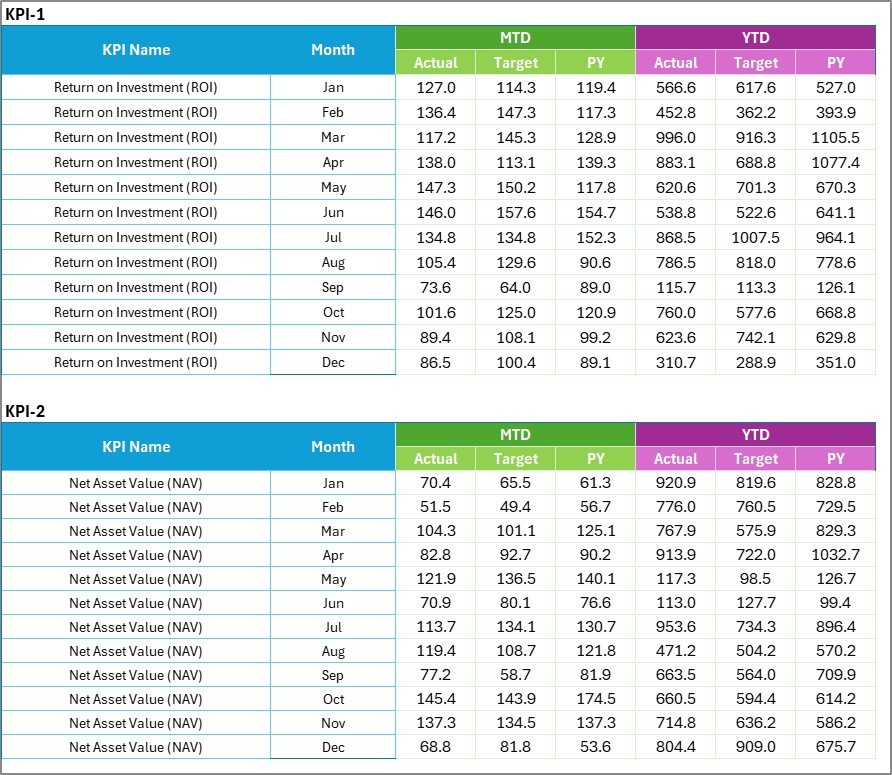
Record Actuals, Targets, and Historical data for each month.
Dynamic formulas update the entire dashboard automatically.
Organized columns make it simple even for non-technical users 💾.
4️⃣ KPI Definition Sheet – Transparency & Standardization
Define each metric (Name, Group, Unit, Formula, Definition).
Separate Financial KPIs (ROI, AUM Growth) and Non-Financial KPIs (Client Retention, Compliance).
Ensure consistency and clarity across your organization.
💹 Example KPIs You Can Track
💰 Financial KPIs – Return on Investment (ROI), AUM Growth Rate, Portfolio Turnover, Expense Ratio, Alpha & Beta.
📑 Operational KPIs – Trade Execution Accuracy, Compliance Rate, Research Efficiency, Reporting Timeliness.
👥 Client KPIs – Retention Rate, New Client Acquisition, Customer Satisfaction Index.
These KPIs deliver a 360° view of profitability, efficiency, and client experience.
🌟 Advantages of the Investment Management KPI Scorecard in Excel
✅ Centralized Performance View – All KPIs in one visual dashboard.
✅ Transparency & Accuracy – Formula-driven and clearly defined metrics.
✅ Smarter Decisions – Instant insight into Actual vs Target vs PY values.
✅ Accountability – Assign ownership of KPIs to departments or analysts.
✅ Simple Customization – Add new KPIs or change calculations easily.
✅ No Subscription Costs – Excel-based solution for any budget.
✅ Professional Presentation – Perfect for executive reviews and client reporting.
💡 Best Practices for Effective Use
🎯 Set SMART KPIs (Specific, Measurable, Achievable, Relevant, Time-bound).
📅 Update data regularly for accurate tracking.
📈 Use charts and conditional formatting for clear visuals.
🧾 Separate input and output sheets to protect formulas.
🤝 Assign responsibility for each KPI to encourage ownership.
🔁 Refine your KPIs periodically to match evolving business goals.
Follow these steps to turn your Excel scorecard into a strategic decision-making system.
🔗 Click here to read the Detailed Blog Post
🎥 Visit our YouTube Channel to learn step-by-step tutorials
Watch the step-by-step video tutorial:
Compatibility and Requirements
- Works in Microsoft Excel desktop (Excel 2016 or later, or Microsoft 365).
- You pick the month and MTD or YTD from dropdowns on the Scorecard sheet, and the KPI on the KPI Trend sheet. Color-coded indicators show whether each KPI is above, near or below target. Microsoft explains the feature in Use conditional formatting to highlight information in Excel.
Frequently Asked Questions
Which sheets are included?
Four sheets: Scorecard, KPI Trend, Input Data and KPI Definition.
How do I update the scorecard?
Enter your Actual, Target and previous year figures for each month on the Input Data sheet. Then choose a month and MTD or YTD on the Scorecard sheet and it updates.
What do the colors mean?
Green means a KPI is above target, yellow means it is near target and red means it is below target.
Can I add or change KPIs?
Yes. The data tables are fully editable, so you can add, remove or update KPIs and change calculations. The KPI Definition sheet holds the name, group, unit, formula and definition of each one.
Is there a dashboard version of this template?
Yes. See the Investment Management KPI Dashboard in Excel and the Investment Management Dashboard in Google Sheets.
Related Investment Templates
- Investment Management KPI Dashboard in Excel: the same topic as a dashboard
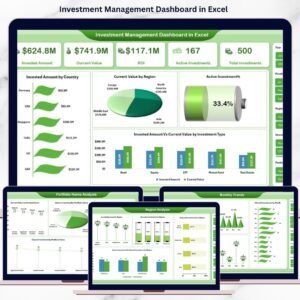
- Investment Management Dashboard in Excel: a portfolio dashboard in Excel
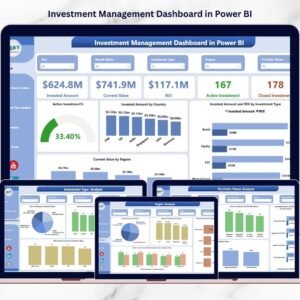
- Investment Management Dashboard in Power BI: the Power BI edition
- Investment Management Dashboard in Google Sheets: the Google Sheets edition
- Investment Tracker in Google Sheets: a simple tracker for investments
Browse all Excel KPI dashboards.






















Reviews
There are no reviews yet.