



Hydropower is one of the cleanest and most efficient renewable energy sources—but managing its performance requires precision. The Hydropower KPI Scorecard in Excel is a ready-to-use analytical template built to help energy companies, plant operators, and consultants track, analyze, and improve hydropower performance — all within Microsoft Excel.
This powerful tool consolidates key performance indicators (KPIs) such as generation efficiency, downtime, maintenance cost, and compliance score into a single, interactive dashboard. No coding or additional software required — just Excel-based automation, visual clarity, and real-time insights.
Whether you manage one facility or a network of hydropower plants, this scorecard enables you to visualize results, identify bottlenecks, and optimize operations for maximum output. 🌊⚙️
⚙️ Key Features of the Hydropower KPI Scorecard in Excel
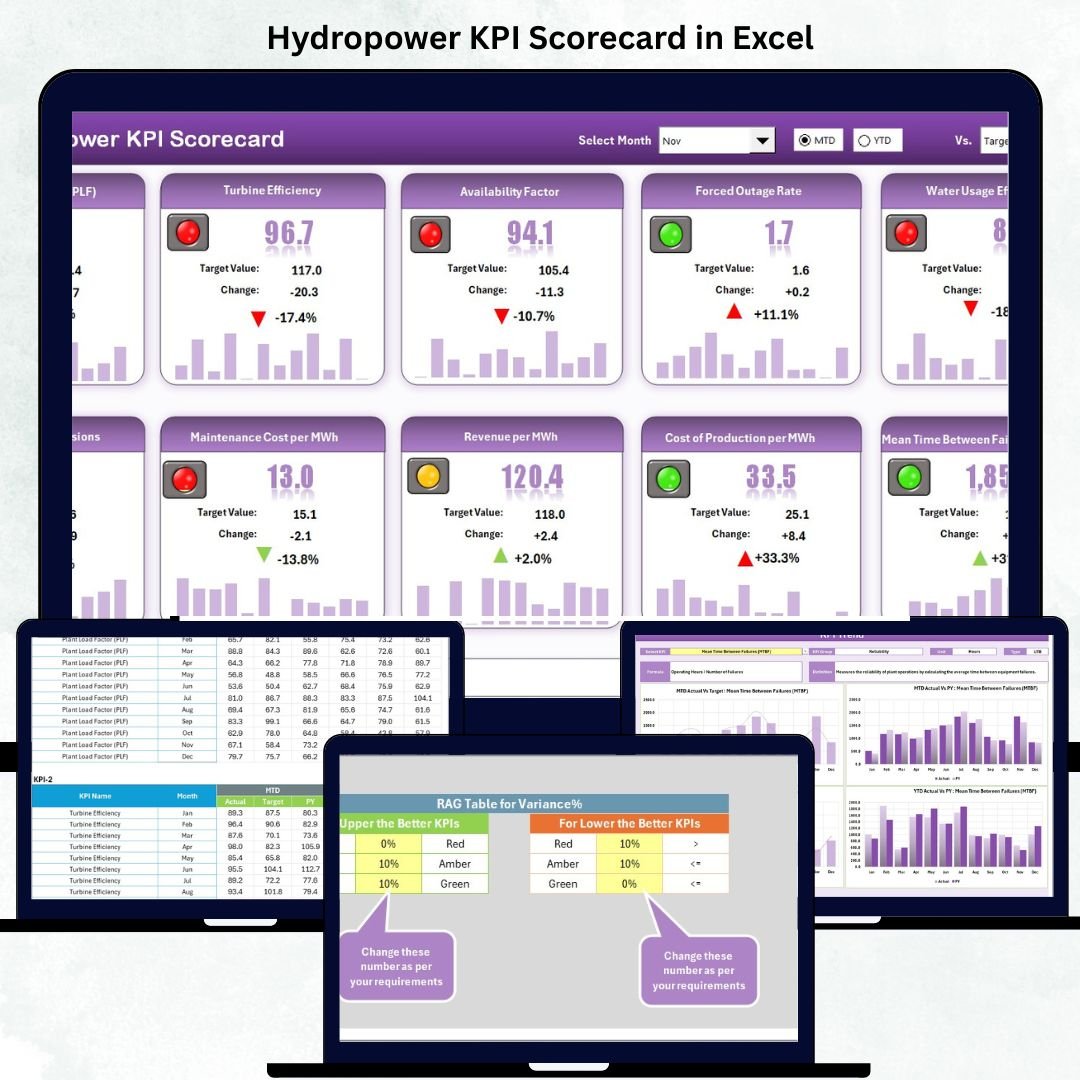
📊 Four Dynamic Sheets: Scorecard (Main Dashboard), KPI Trend, Input Data, and KPI Definition.
📅 Month Selector & MTD/YTD Toggle: Switch between Month-to-Date and Year-to-Date performance.
🎯 Actual vs Target vs Previous Year Comparisons.
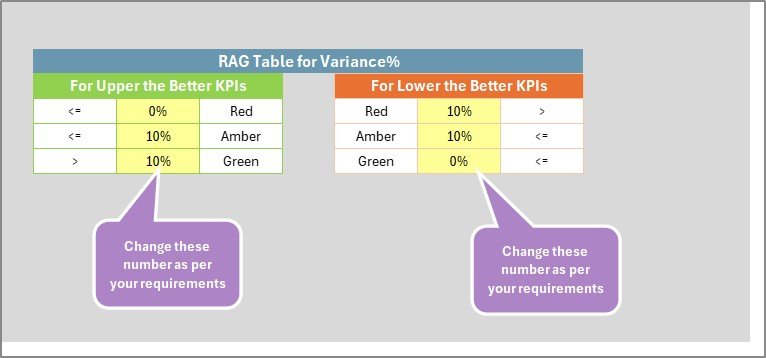
🟢🟡🔴 Color-Coded Indicators: Green = Achieved, Yellow = Near Target, Red = Needs Action.
📈 Interactive Trend Charts: View performance patterns for any KPI instantly.
🔍 Comprehensive KPI Dictionary: Formulas, Units, and Definitions for every metric.
⚡ Fully Automated: Excel formulas update visuals in real time after data entry.
💻 Compatible with Excel 2013 to Microsoft 365 (on Windows & Mac).
📊 What’s Inside the Hydropower KPI Scorecard
⚡ 1️⃣ Scorecard Sheet – Central Dashboard
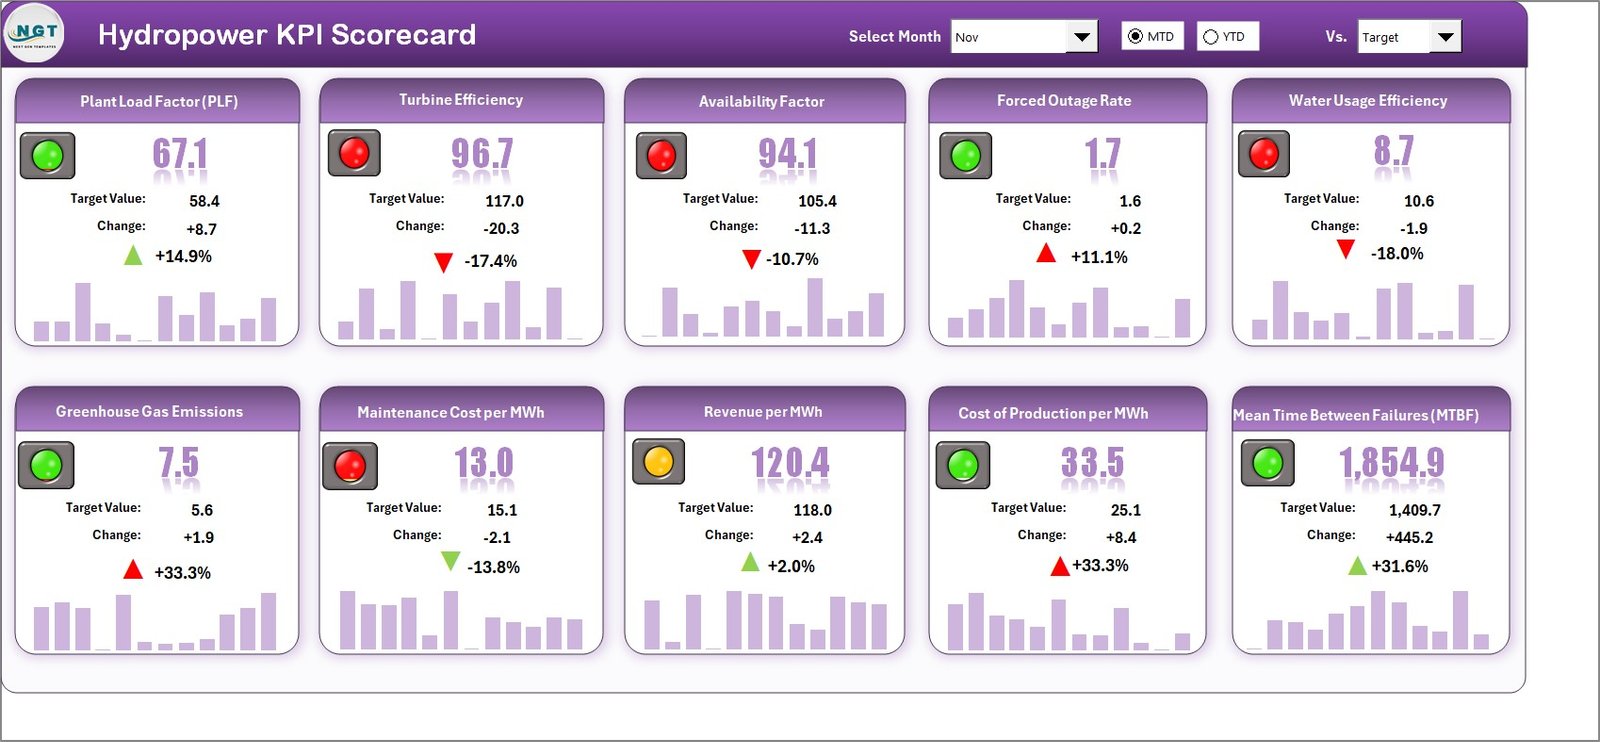
Your main control center for hydropower analytics.
Dropdown menus to select Month and MTD/YTD view.
Actual vs Target comparison for every KPI.
Color alerts to highlight underperforming areas.
KPI overview including Efficiency (%), Availability (%), Downtime (hrs), and Cost per MWh.
💡 Purpose: Provide real-time visibility into operational and financial performance.
📈 2️⃣ KPI Trend Sheet – Performance Over Time
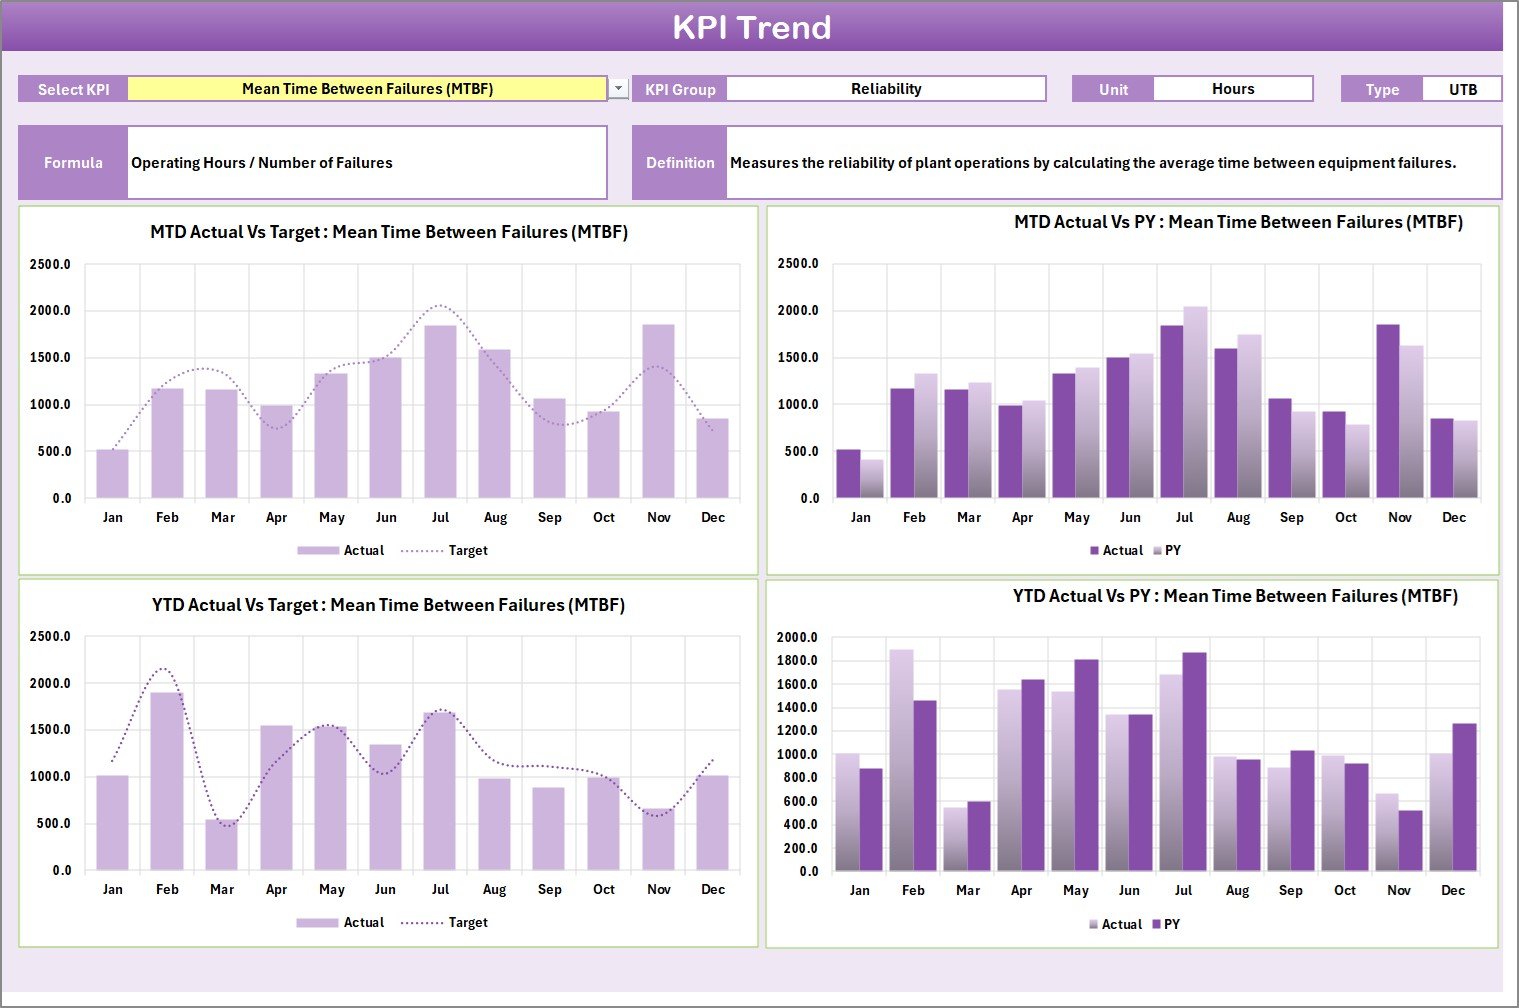
Monitor each metric month by month using dynamic charts.
Select any KPI from the dropdown (cell C3).
View Actual, Target, and Previous Year lines together.
Instantly spot drops in efficiency or rises in costs.
💡 Purpose: Enable trend tracking and data-driven maintenance planning.
📘 3️⃣ Input Data Sheet – The Data Engine
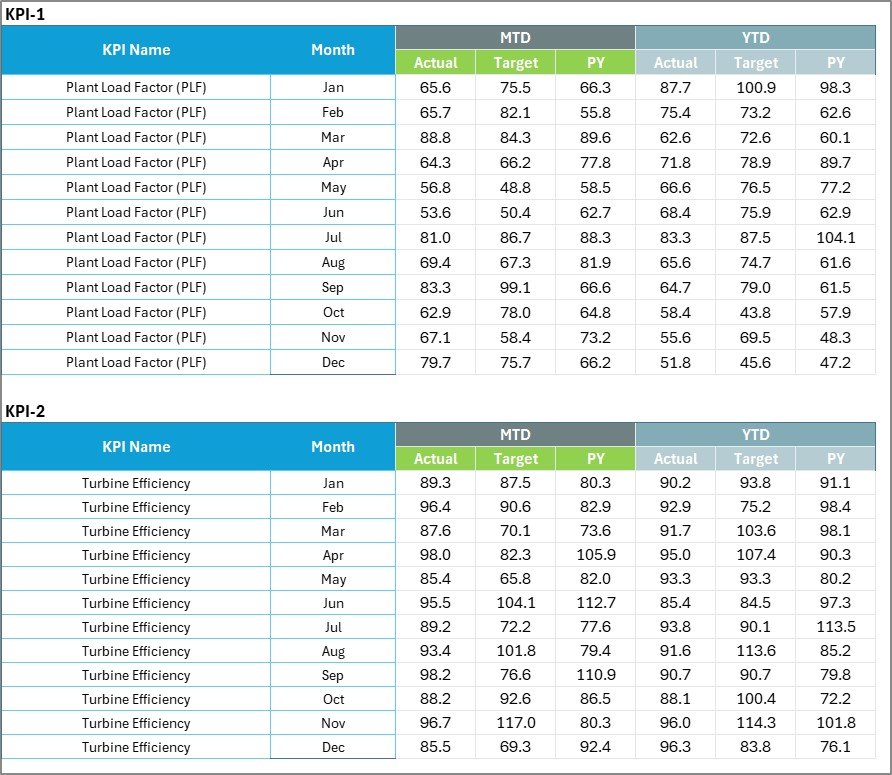
Record all monthly operational data — Actuals, Targets, and Previous Year values.
Designed for error-free entry with data validation.
Automatically feeds the Scorecard and Trend visuals.
💡 Purpose: Keep the entire dashboard live and accurate.
📗 4️⃣ KPI Definition Sheet – Performance Dictionary
Defines every metric used in the scorecard.
Fields: KPI Name, Group, Unit, Formula, Definition, and Type (UTB / LTB).
💡 Purpose: Ensure clarity and standardization across departments.
🌟 Advantages of Using the Hydropower KPI Scorecard in Excel
✅ Centralized Monitoring: All KPIs consolidated into one interactive view.
✅ Real-Time Insights: See immediate updates when data changes.
✅ Better Decision-Making: Detect inefficiencies early and plan maintenance strategically.
✅ Cost Optimization: Track budget vs actual and reduce O&M costs.
✅ Environmental Compliance: Monitor carbon reduction and water usage metrics.
✅ Standardized Reporting: KPI definitions ensure consistent performance evaluation.
✅ Scalable Design: Works for small plants or large hydropower networks.
💡 How to Use the Hydropower KPI Scorecard
1️⃣ Enter your monthly data in the Input Data Sheet.
2️⃣ Review automatically calculated KPIs in the Scorecard Sheet.
3️⃣ Switch between MTD and YTD views to see progress.
4️⃣ Analyze trends in the KPI Trend Sheet for pattern recognition.
5️⃣ Refer to the KPI Definition tab to understand formulas and logic.
💡 Tip: Refresh your data monthly for accurate performance insights.
👥 Who Can Benefit from This Scorecard
🏭 Hydropower Plant Managers
⚙️ Operations and Maintenance Teams
📊 Energy Analysts and Consultants
💼 Government and Regulatory Agencies
🌍 Sustainability and Compliance Departments
🌿 Best Practices for Using the Scorecard
📌 Update data monthly to stay accurate.
📌 Assign KPI ownership to responsible departments.
📌 Use color alerts to focus on critical issues first.
📌 Protect sensitive formula cells.
📌 Maintain a backup for each reporting cycle.
📌 Add forecast columns to anticipate seasonal variations.
🧩 Conclusion
The Hydropower KPI Scorecard in Excel provides a complete solution for tracking, evaluating, and improving hydropower performance. It combines Excel’s analytical strength with intuitive design to deliver real-time insights into generation, cost, maintenance, and compliance metrics.
By using this scorecard, hydropower organizations can enhance efficiency, reduce downtime, and ensure sustainable energy production — without relying on complex software.
⚡ Measure → Analyze → Optimize — with Nextgen Templates’ Hydropower KPI Scorecard in Excel.
🔗 Click Here to Read the Detailed Blog Post
📺 Visit our YouTube Channel for step-by-step tutorials.
Watch the step-by-step video tutorial:
Compatibility and Requirements
- Works in Microsoft Excel desktop. The page lists Excel 2013 to Microsoft 365 on Windows and Mac.
- You pick the month and the MTD or YTD view from dropdowns, and the KPI Trend sheet has a KPI dropdown. Microsoft explains how in Create a drop-down list.
Frequently Asked Questions
Which sheets are included?
Four sheets: Scorecard, KPI Trend, Input Data and KPI Definition.
How do I update the scorecard?
Enter your monthly Actuals, Targets and Previous Year values in the Input Data sheet. Then choose a month on the Scorecard sheet and it updates.
Can I see year-to-date results?
Yes. A dropdown on the Scorecard switches between Month-to-Date and Year-to-Date.
What do the colors mean?
Green means the target is achieved, yellow means near target and red means the KPI needs action.
Is there a Power BI or Google Sheets version?
Yes. See the Hydropower KPI Dashboard in Power BI and the Hydropower KPI Dashboard in Google Sheets.
Related Energy Templates
- Hydropower KPI Dashboard in Power BI: the same topic in Power BI
- Hydropower KPI Dashboard in Google Sheets: the Google Sheets edition
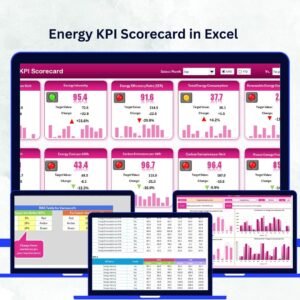
- Energy KPI Scorecard in Excel: a broader energy scorecard
- Solar Energy KPI Scorecard in Excel: a scorecard for solar plants
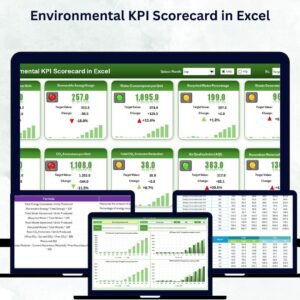
- Environmental KPI Scorecard in Excel: environmental metrics in one view
Browse all Excel KPI dashboards.


















Reviews
There are no reviews yet.