The Hydropower KPI Dashboard in Google Sheets is a powerful tool designed to help hydropower plant managers and stakeholders track and analyze critical performance metrics related to energy generation, efficiency, costs, and environmental impact. This customizable, real-time dashboard offers a comprehensive view of plant performance and supports data-driven decision-making for optimizing operations.
With this ready-to-use Google Sheets template, users can easily monitor key indicators like energy production, operational efficiency, and sustainability metrics, making it a must-have tool for managing hydropower plants.
📊 What’s Inside the Hydropower KPI Dashboard 📊
The Hydropower KPI Dashboard includes several distinct sheets that track various KPIs to ensure efficient plant operations:
-
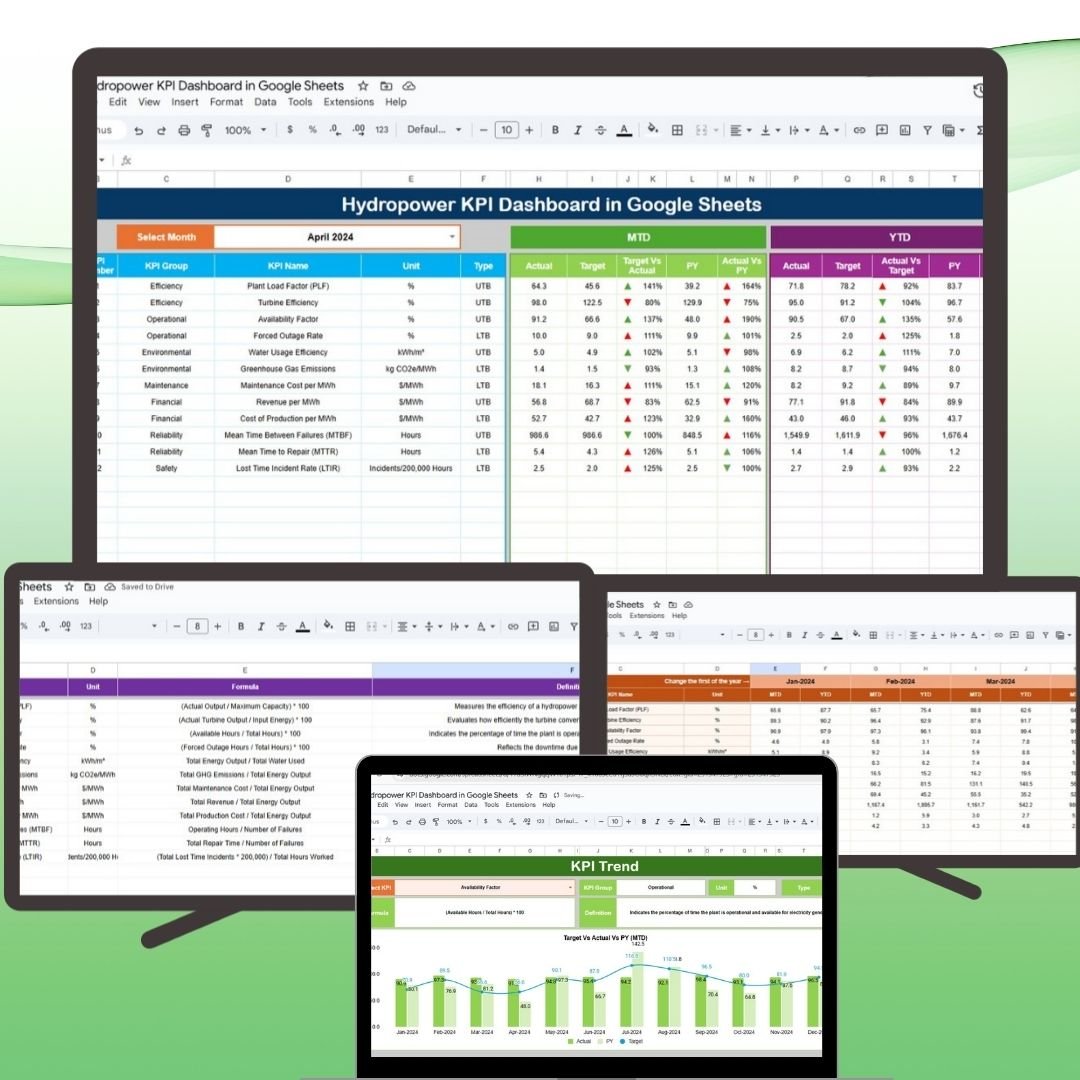
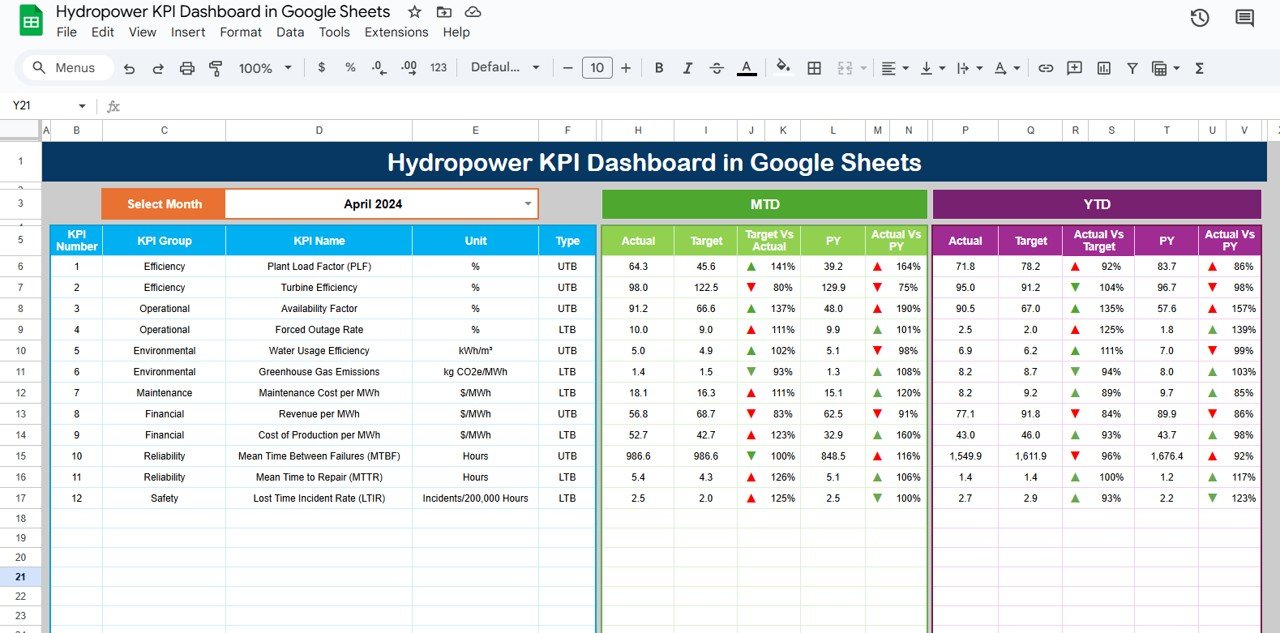
Dashboard Sheet Tab
-
Key Metrics Overview: View essential KPIs in a centralized location, such as:
-
Total Energy Generated (MWh): The total energy produced by the hydropower plant.
-
Energy Efficiency (%): Measures the plant’s operational efficiency.
-
Cost per MWh ($): The operational cost for each megawatt-hour generated.
-
Operational Cost per MWh ($): Tracks the overall cost of plant operations.
-
Environmental Impact (Carbon Offset): Tracks the environmental benefits of the hydropower plant, such as carbon offsets.
-
-
Month Dropdown: Easily switch between months for updated performance data.
-
-
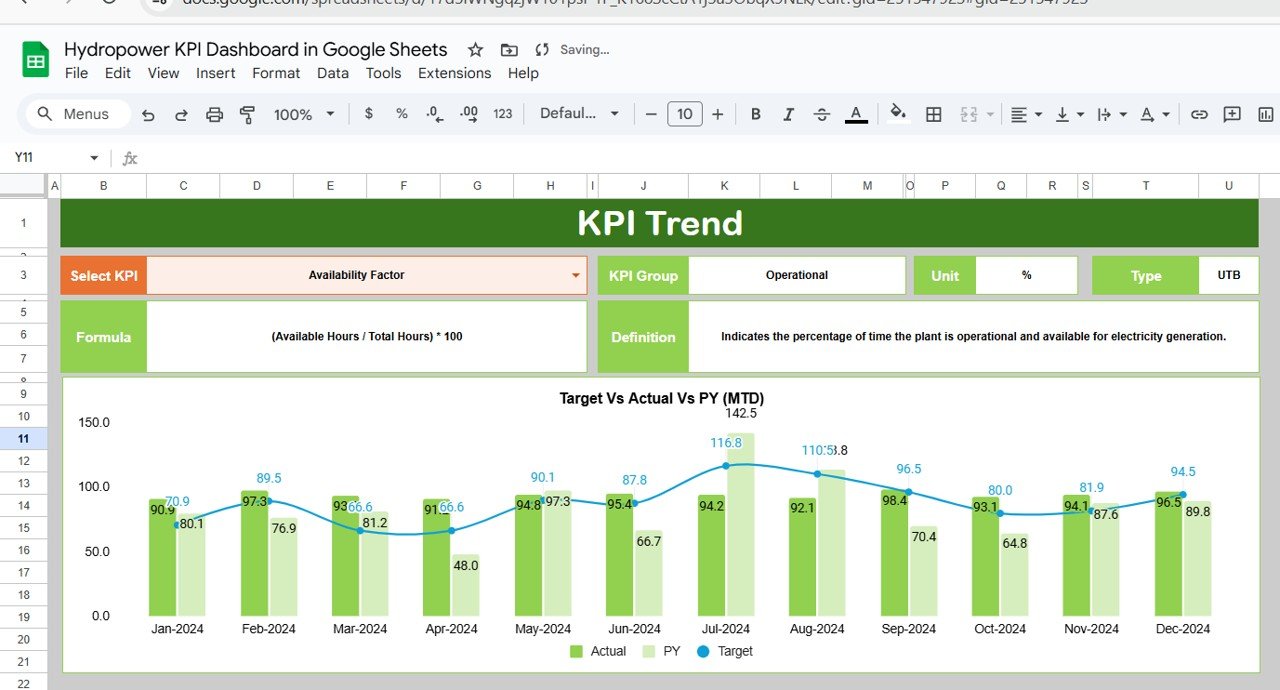
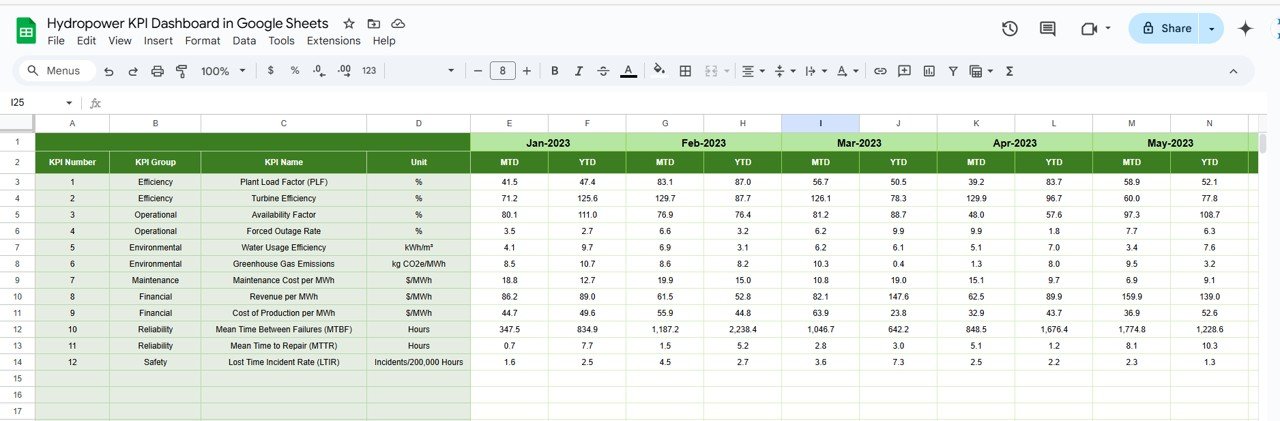
KPI Trend Sheet Tab
-
Trend Tracking: Monitor performance trends over time for each selected KPI, allowing for better long-term planning.
-
KPI Group, Unit, Type: Displays the KPI’s group (e.g., energy generation, maintenance), unit of measurement (e.g., MWh, $), and whether the KPI is “Lower the Better” (LTB) or “Upper the Better” (UTB).
-
Formula & Definition: Learn how each KPI is calculated and what it measures.
-
-
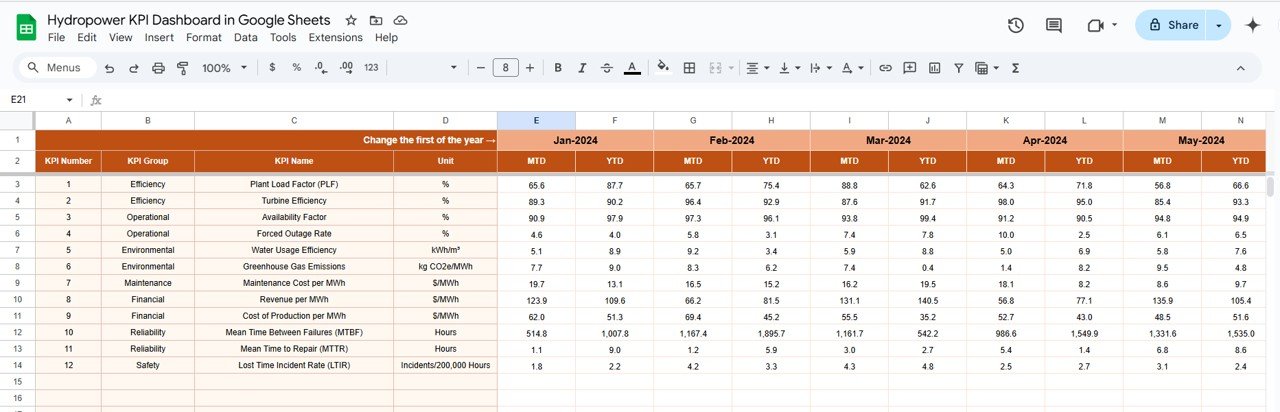
Actual Numbers Sheet Tab
-
Data Entry: Input monthly actual performance data to keep the dashboard updated with real-time data.
-
Month Selection: Choose the first month of the year to auto-update the data across the dashboard.
-
-
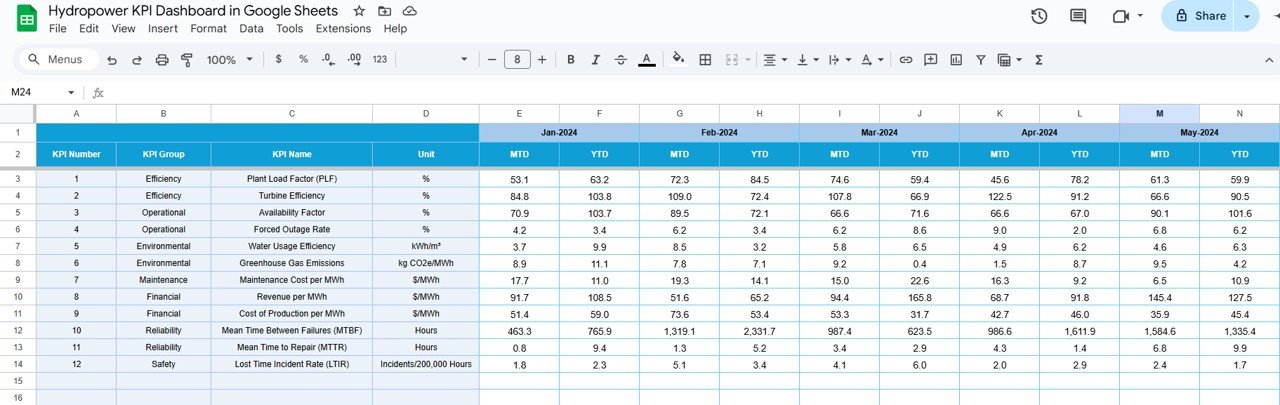
Target Sheet Tab
-
Set Targets: Enter target values for each KPI to compare actual performance with the goals you’ve set for the plant.
-
-
Previous Year Number Sheet Tab
-
Historical Data: Compare current performance with data from the previous year, allowing you to track trends and assess improvements.
-
-
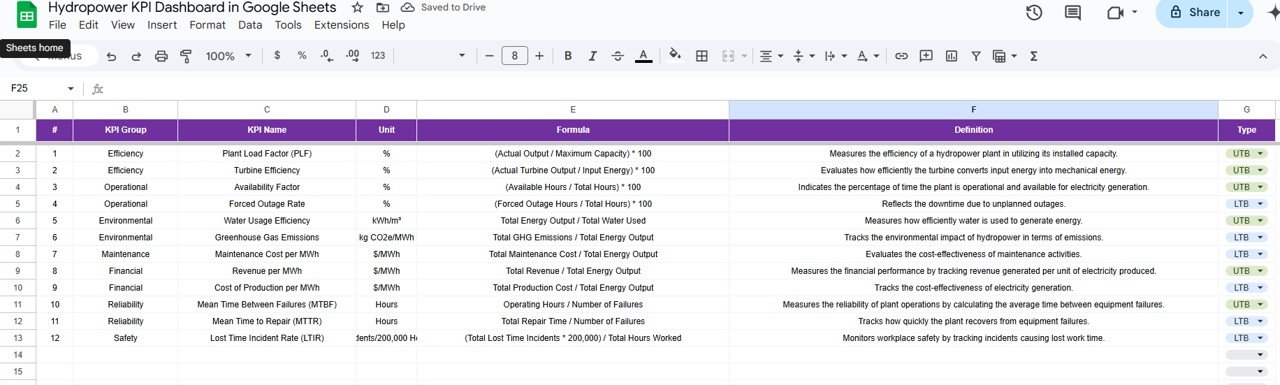
KPI Definition Sheet Tab
-
Detailed Explanations: View clear definitions and formulas for each KPI, helping users better understand the data and its impact on performance.
-
⚙️ How to Use the Hydropower KPI Dashboard ⚙️
-
Input Actual Data: Enter actual performance data for each KPI into the Actual Numbers Sheet to update the dashboard automatically.
-
Set Targets: Define target values for each KPI in the Target Sheet to track progress and compare against actual results.
-
Track and Visualize: Use the Dashboard Sheet to view key performance metrics, trends, and comparisons to assess the efficiency and performance of your hydropower plant.
-
Analyze Trends: Use the KPI Trend Sheet to analyze data over time and identify areas for operational improvements.
🌍 Who Can Benefit from This Hydropower KPI Dashboard 🌍
-
Hydropower Plant Managers: Track operational performance, energy production, and efficiency to ensure that plant operations are running smoothly.
-
Energy Analysts: Analyze trends in energy generation and system efficiency, helping to forecast future energy production and optimize resource use.
-
Project Managers: Ensure that all projects meet energy production goals and are operating efficiently by tracking key metrics.
-
Sustainability Officers: Monitor environmental impacts, such as carbon offsets, to ensure that your hydropower plant is contributing to sustainability goals.
-
Investors and Stakeholders: Gain a comprehensive view of plant performance and profitability to make informed decisions about investments and resource allocation.
🌟 Benefits of Using the Hydropower KPI Dashboard 🌟
-
Real-Time Monitoring: Track KPIs in real-time to make immediate adjustments to improve performance and operational efficiency.
-
Comparative Analysis: Easily compare actual performance against targets and historical data, allowing for better decision-making.
-
Financial Insights: Monitor financial performance with metrics like cost per MWh and operational cost per MWh to ensure your plant is operating cost-effectively.
-
Sustainability Tracking: Measure the environmental impact of your hydropower plant, including carbon offsets, ensuring your operations align with sustainability goals.
-
Customizable: Tailor the dashboard to meet your specific needs, including adding or removing KPIs and modifying the layout for a better user experience.
Click here to read the detailed blog post
Watch the step-by-step video Demo:


Reviews
There are no reviews yet.