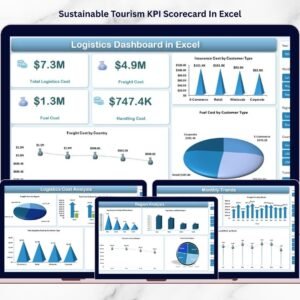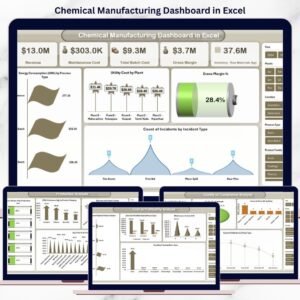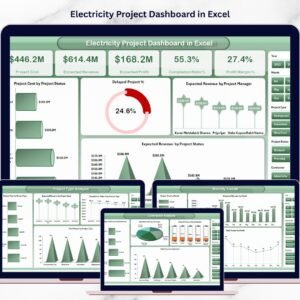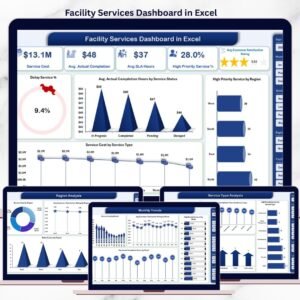
Warehousing operations sit at the heart of every supply chain. Every inbound unit, outbound shipment, storage decision, and transaction directly impacts cost, speed, and customer satisfaction. However, when warehouse teams rely on scattered spreadsheets, manual registers, or static reports, visibility drops sharply. As a result, shipment delays increase, storage utilization suffers, and decision-making becomes reactive.
That is exactly where a Warehousing Dashboard in Excel becomes an essential operational and performance management tool.
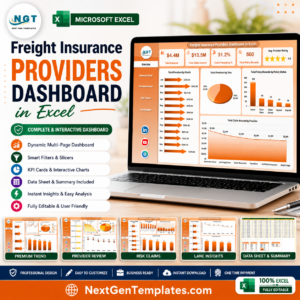
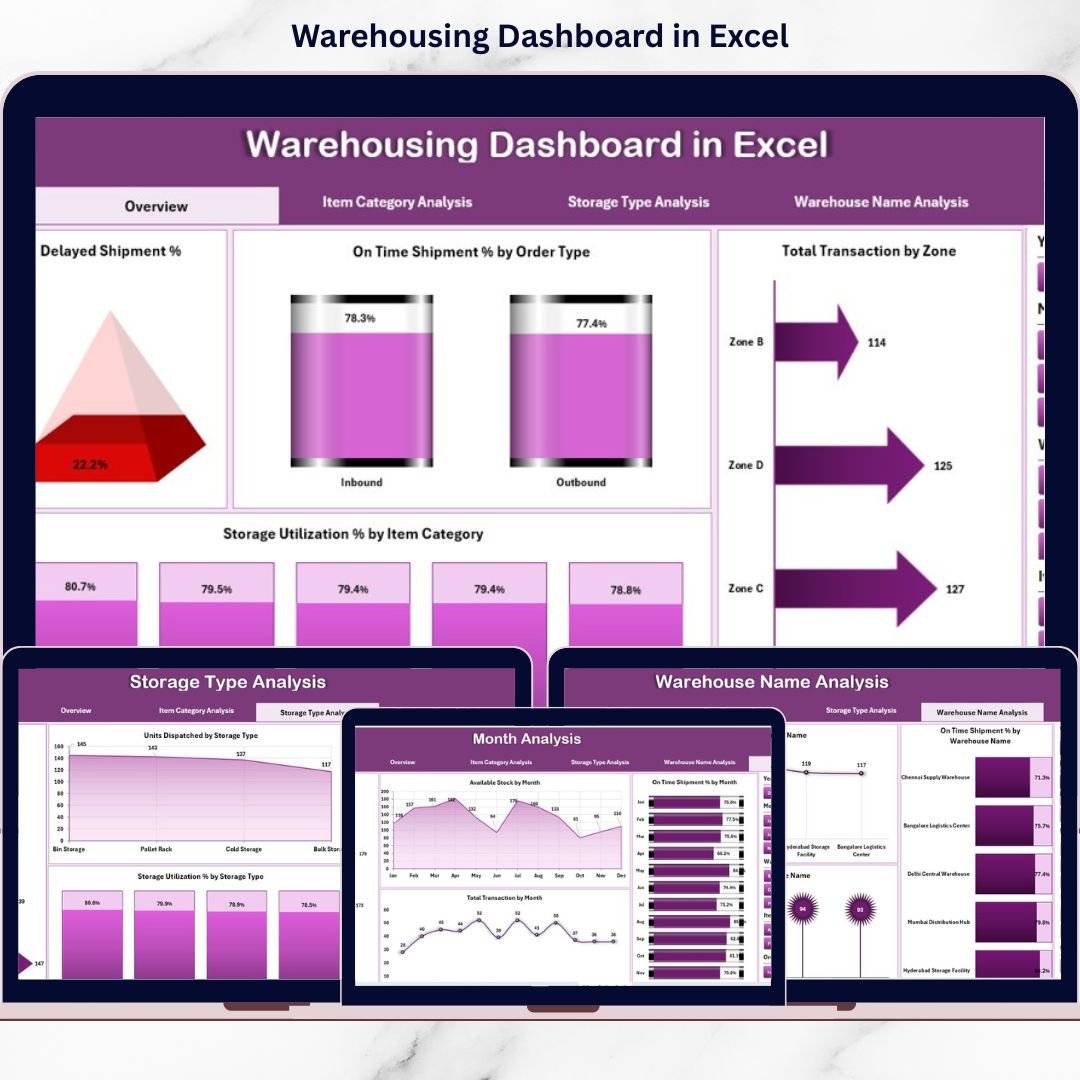
This ready-to-use Warehousing Dashboard in Excel transforms raw warehouse data into clear visuals, KPI cards, and interactive analytics. Instead of reviewing multiple Excel files, warehouse managers and supply chain teams can monitor inventory movement, shipment performance, storage utilization, and warehouse efficiency from a single professional Excel dashboard.
Because the dashboard is built entirely in Microsoft Excel, it remains cost-effective, flexible, and easy to maintain. Users simply update the data sheet, refresh pivot tables, and instantly see updated insights—without complex formulas or advanced BI tools.
📦 Key Features of Warehousing Dashboard in Excel
This dashboard is designed to support daily warehouse operations as well as strategic reviews.
📊 Interactive Excel-based dashboard with pivot charts
📌 Centralized view of warehouse KPIs
🧭 Page Navigator for smooth navigation
🎯 KPI cards for instant performance visibility
🎛️ Right-side slicers for dynamic filtering
📈 Pivot-based charts for easy refresh and scalability
🏢 Multi-warehouse performance comparison
📦 Item category, storage type, and time-based analysis
🗂️ What’s Inside the Warehousing Dashboard in Excel
This ready-to-use Excel dashboard includes 5 analytical pages, along with a structured data backend.
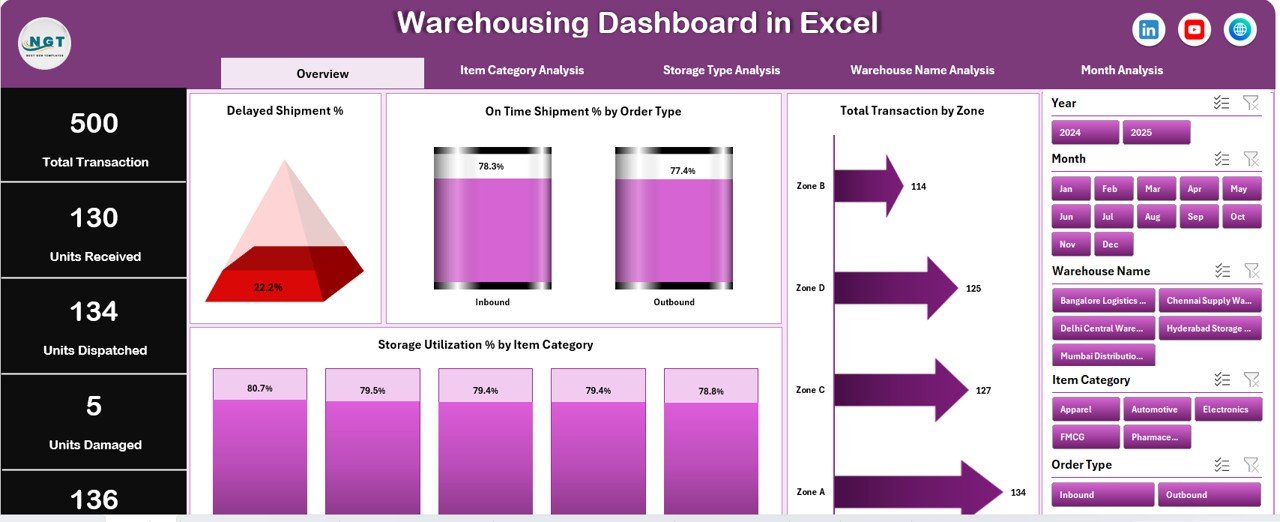
📍 1. Overview Page – Warehouse Performance at a Glance
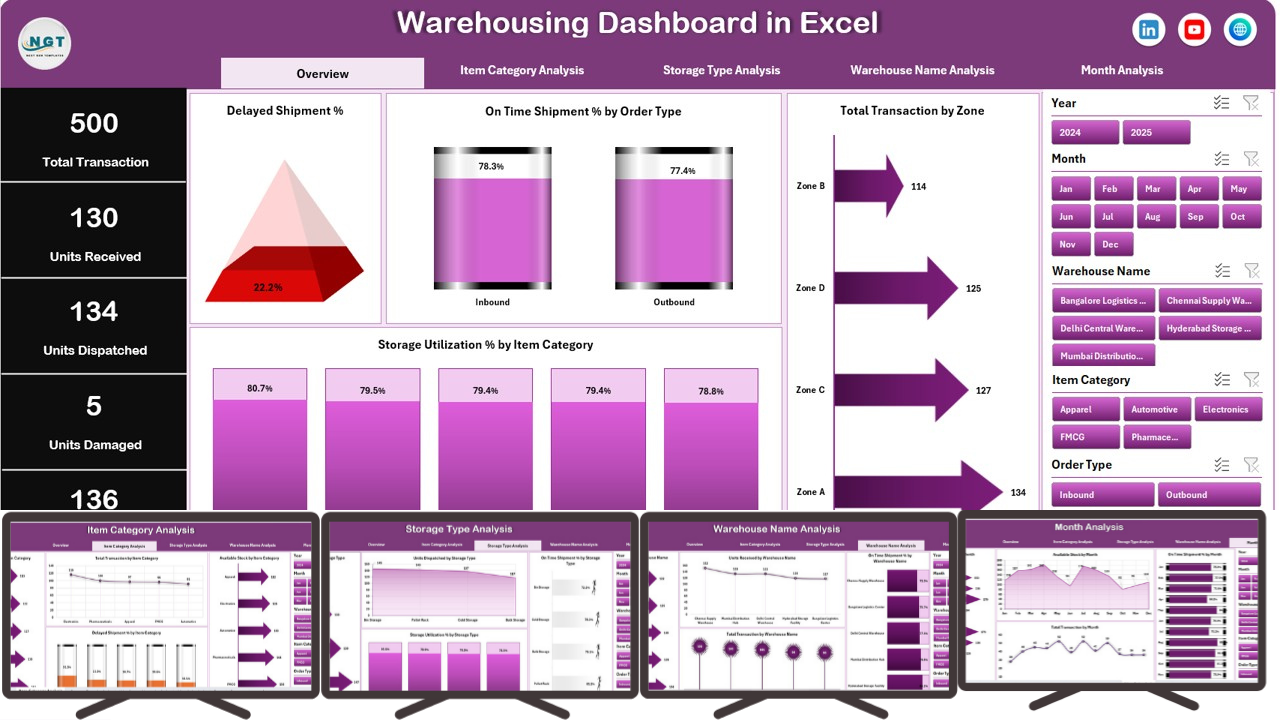
This is the main control center of the dashboard.
KPI Cards Displayed
Delayed Shipment %
On-Time Shipment %
Total Transactions
Storage Utilization %
Charts Included
Delayed Shipment % by Order Type
On-Time Shipment % by Order Type
Total Transactions by Zone
Storage Utilization % by Item Category
This page helps managers immediately identify delays, efficiency gaps, and storage pressure points.
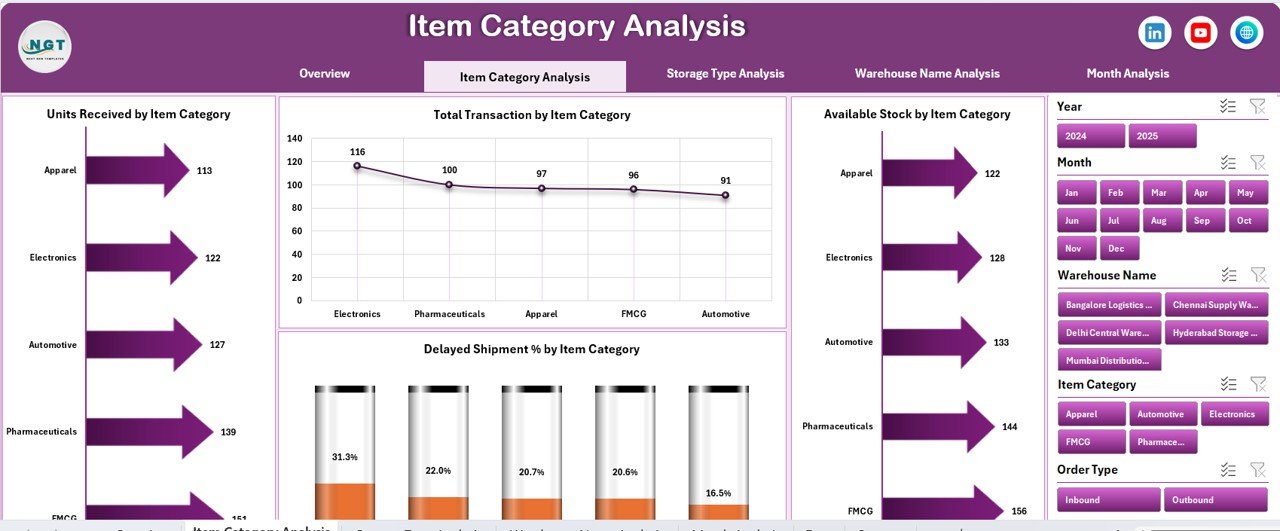
📦 2. Item Category Analysis
This page analyzes performance by product or item category.
Insights Covered
Units Received by Item Category
Total Transactions by Item Category
Available Stock by Item Category
Delayed Shipment % by Item Category
It helps optimize inventory allocation and reduce category-level bottlenecks.
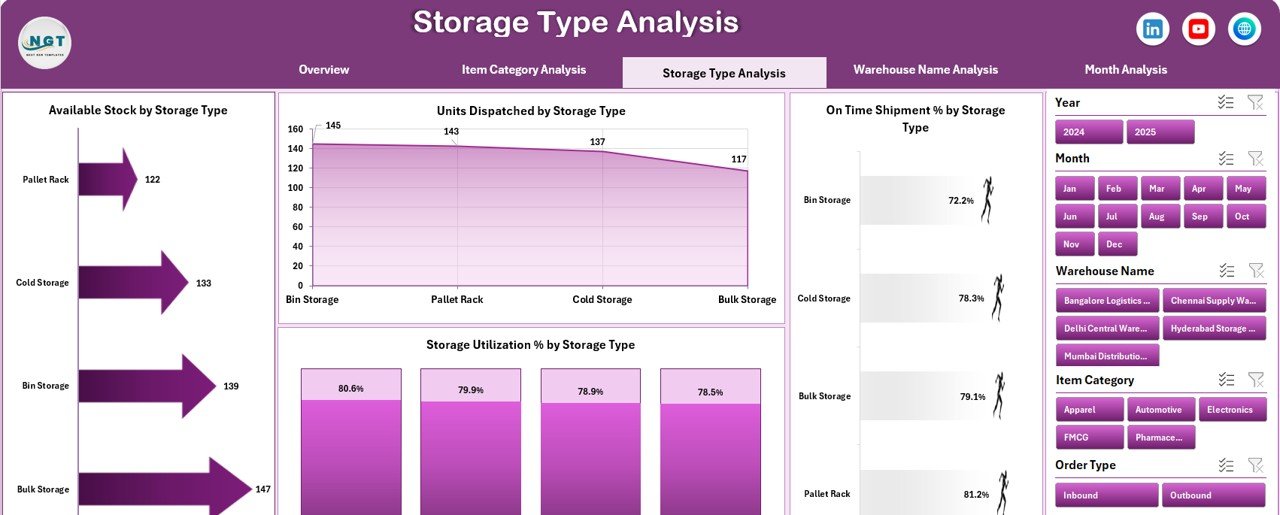
🧊 3. Storage Type Analysis
Different storage types behave differently. This page focuses on storage efficiency.
Charts Included
Units Received by Storage Type
Available Stock by Storage Type
On-Time Shipment % by Storage Type
Storage Utilization % by Storage Type
This analysis supports better space planning and utilization control.
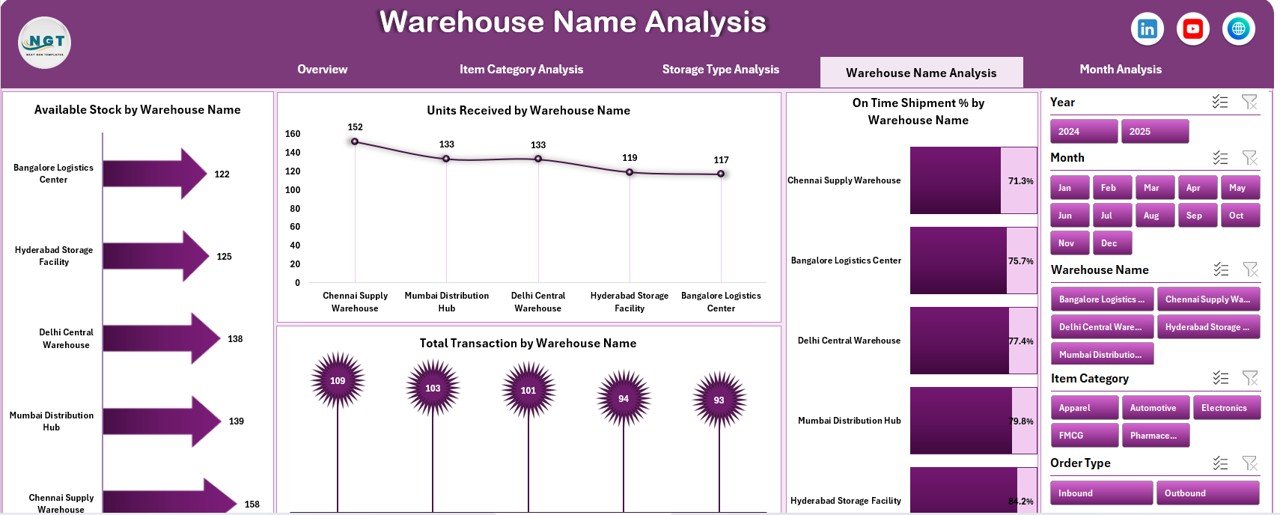
🏢 4. Warehouse Name Analysis
Ideal for organizations managing multiple warehouses.
Charts Included
Units Received by Warehouse Name
On-Time Shipment % by Warehouse Name
Available Stock by Warehouse Name
Total Transactions by Warehouse Name
It enables benchmarking and performance comparison across locations.
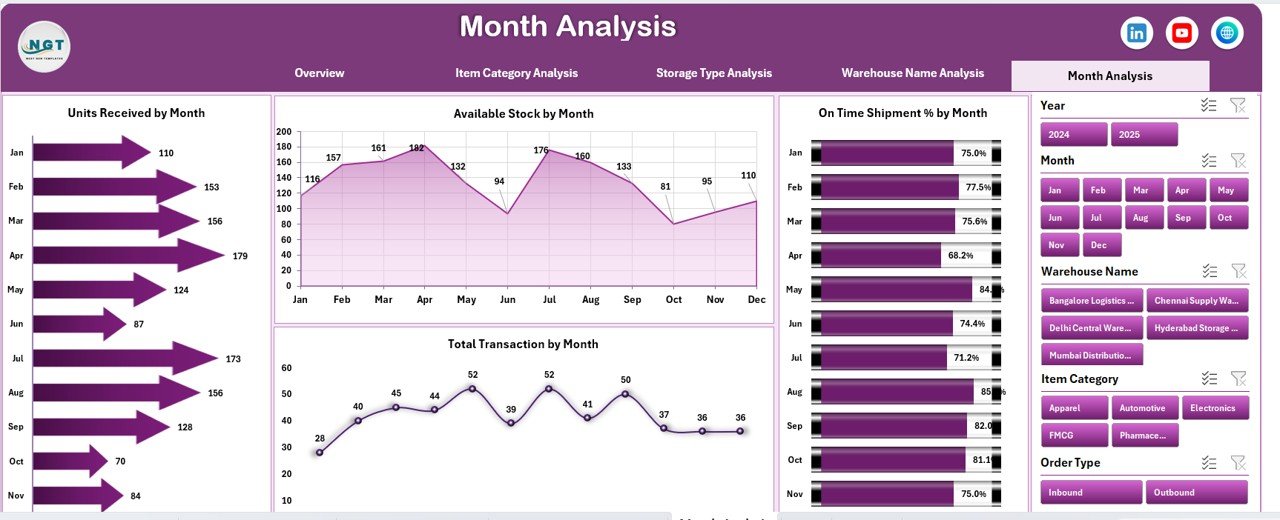
📅 5. Month Analysis
This page tracks warehouse trends over time.
Charts Included
Units Received by Month
On-Time Shipment % by Month
Available Stock by Month
Total Transactions by Month
This analysis supports forecasting, staffing, and capacity planning.
▶️ How to Use the Warehousing Dashboard in Excel
Using the dashboard is simple and user-friendly:
1️⃣ Enter or update warehouse data in the Data Sheet
2️⃣ Refresh pivot tables (one click)
3️⃣ Use slicers to filter by month, warehouse, item category, or storage type
4️⃣ Review KPIs, charts, and trends
5️⃣ Take faster, data-driven decisions
No advanced Excel skills are required.
👥 Who Can Benefit from This Warehousing Dashboard in Excel?
This dashboard is ideal for:
✔ Warehouse Managers
✔ Supply Chain & Logistics Teams
✔ Inventory Planners
✔ Operations Heads
✔ Business Owners
✔ Consultants & Analysts
Both small warehouses and multi-location operations can use and scale this dashboard easily.
🚀 Business Advantages
Using this dashboard helps organizations:
Reduce shipment delays
Improve storage utilization
Increase inventory visibility
Save reporting time
Improve operational planning
Support management and review meetings
### 📘 Click here to read the Detailed blog post
📺 Visit our YouTube channel to learn step-by-step video tutorials
👉 https://youtube.com/@PKAnExcelExpert