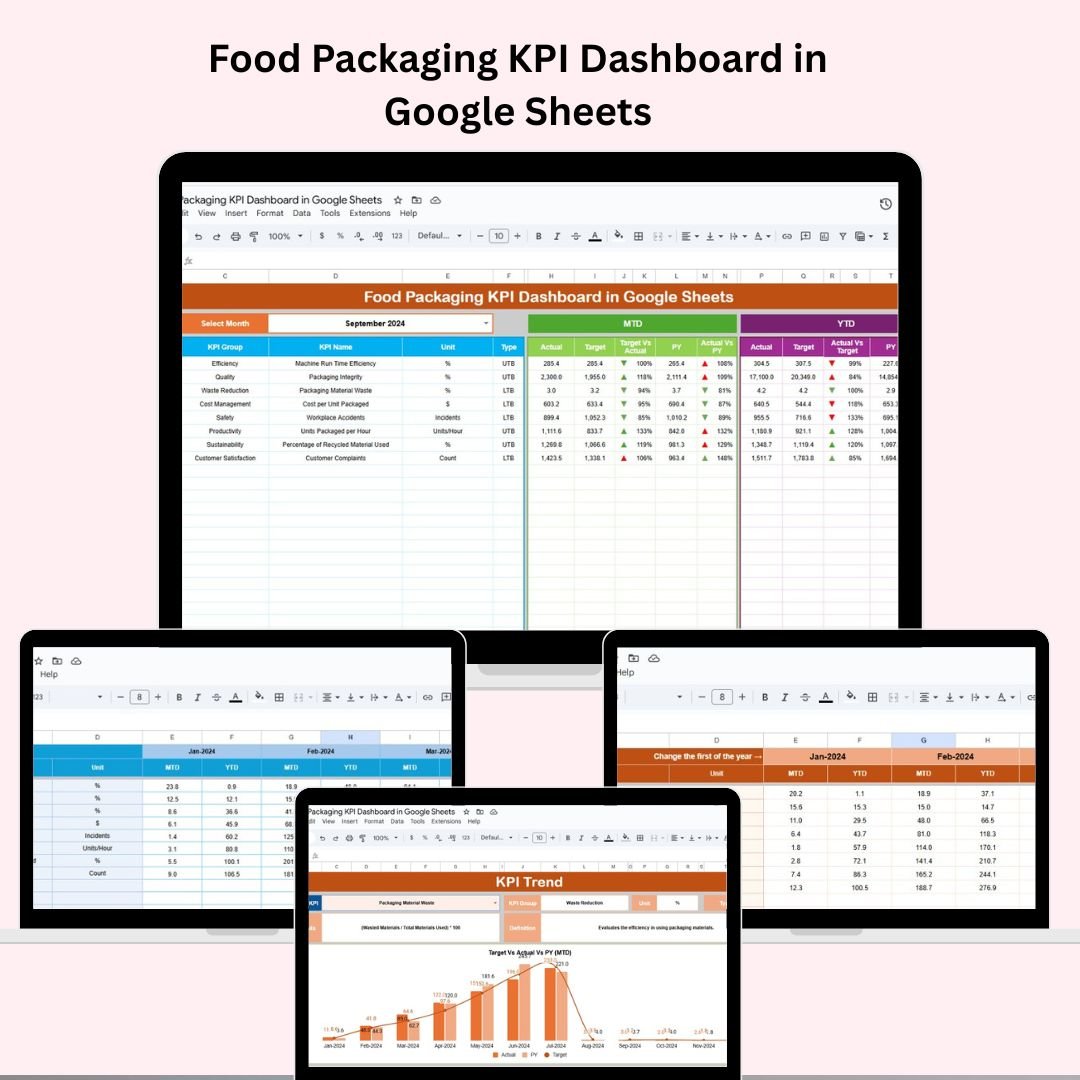
In the competitive landscape of food packaging, knowing your numbers isn’t optional—it’s essential. Efficiency, quality, and cost control depend on real-time visibility across your KPIs. That’s why we created the Food Packaging KPI Dashboard in Google Sheets—an intuitive, dynamic, and data-driven tool designed specifically for packaging professionals who want clarity, control, and consistency in performance tracking.
Whether you’re an operations manager, a quality assurance expert, or a plant supervisor, this dashboard gives you everything you need to monitor, manage, and improve your packaging KPIs without the hassle of complex systems.
✨ Key Features of the Food Packaging KPI Dashboard
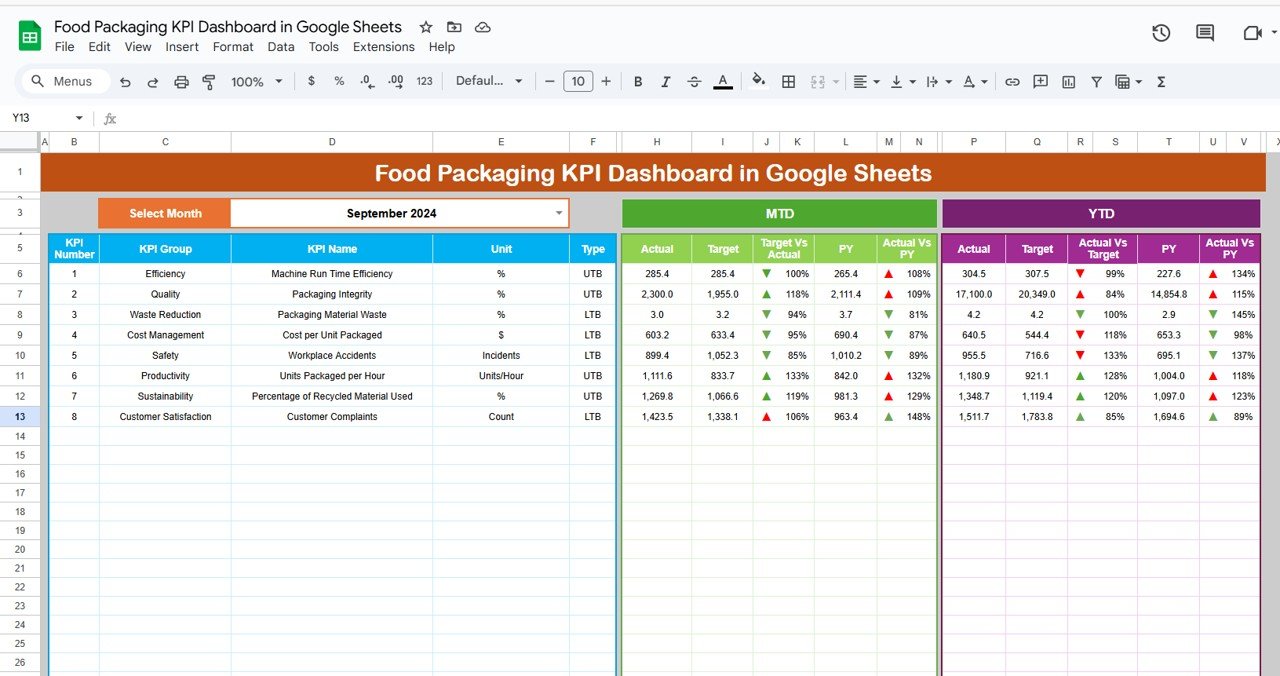
📊 Dashboard Sheet
-
🎯 Select Any Month (Cell D3) – Watch all dashboard numbers auto-update
-
🔄 MTD & YTD View – Get Actual, Target & Previous Year comparisons
-
🔺🔻 Conditional Formatting Arrows – Instantly spot performance gaps
-
📈 Real-Time Visualizations – Make data-driven decisions at a glance
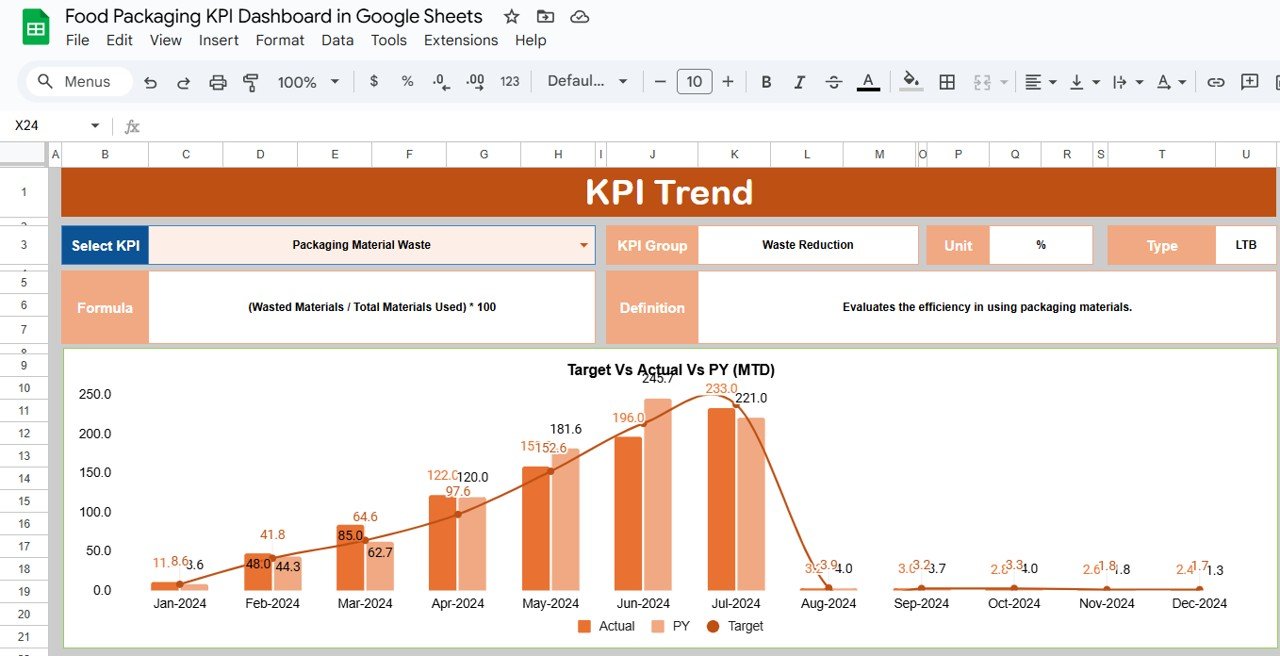
📉 KPI Trend Sheet
-
🧮 KPI Drop-down Selector – Choose from a list of defined KPIs
-
🏷️ KPI Metadata – View unit, type (UTB/LTB), formula & description
-
📊 Trend Analysis – Understand monthly performance across time
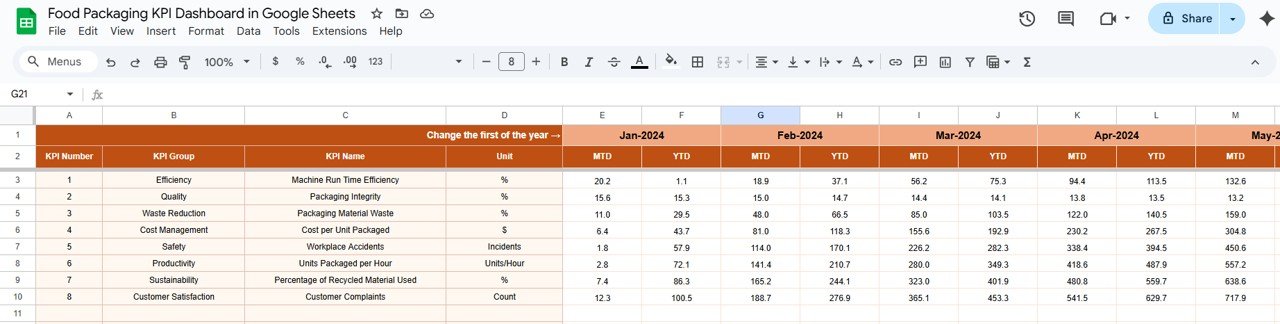
✍️ Actual Numbers Sheet
-
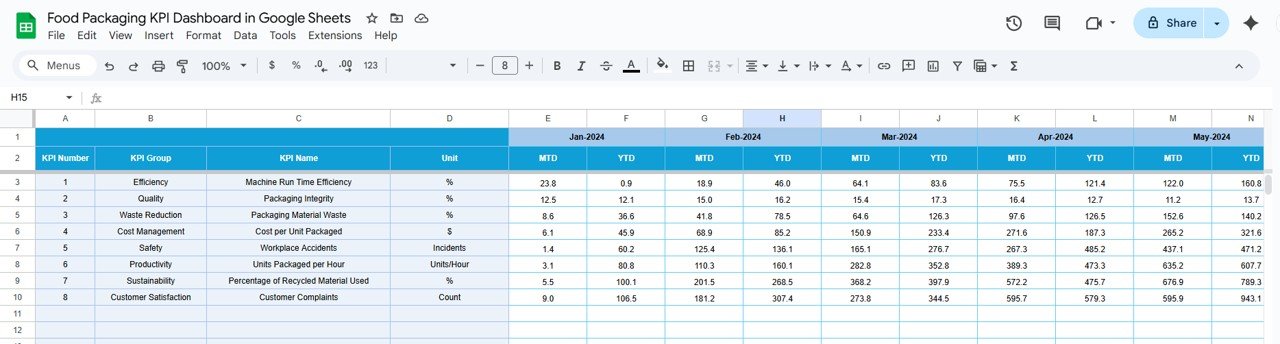
📅 Month-Specific Entry (Cell E1) – Update monthly actuals
-
✨ MTD and YTD Fields – Simple, centralized, and editable
-
✅ Instant Integration – Feeds data into dashboard and charts
🎯 Target Sheet
-
🔢 Define MTD & YTD Targets – Monthly goal setting
-
🎯 Department-Wide Alignment – Keep everyone on the same page
-
📌 Benchmark Tracking – Measure performance against set goals
🔁 Previous Year Sheet
-
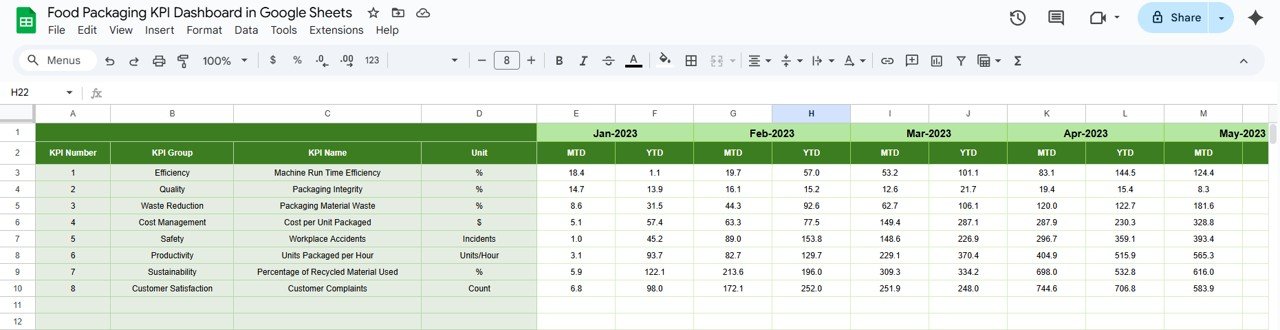
🗓️ Year-over-Year Comparison – Input past performance for all KPIs
-
🧭 Historical Insights – Learn from past trends and improve
🧾 KPI Definition Sheet
-
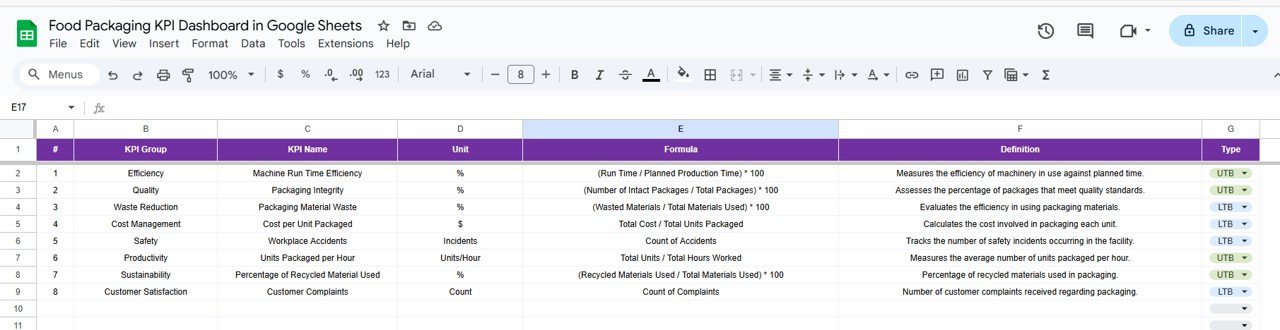
🔠 KPI Details – Group, Unit, Formula, and Definitions
-
🧭 KPI Type Tags – Mark as UTB (Upper the Better) or LTB (Lower the Better)
-
📚 Team Clarity – Everyone knows what each KPI means
📦 What’s Inside the Product?
-
✅ 6 Custom-Built Sheets (Dashboard, KPI Trend, Actual, Target, Previous Year, KPI Definition)
-
✅ Plug-and-play formulas for auto-calculation
-
✅ Conditional formatting for quick visual alerts
-
✅ Drop-down menus for simplified data selection
-
✅ Fully editable fields for total flexibility
-
✅ Built-in charts to visualize performance instantly
🛠️ How to Use the Dashboard
-
📥 Download and open the Google Sheets file
-
🗓️ Select a month from the dashboard (Cell D3)
-
🧮 Input MTD and YTD values in the Actual Numbers tab
-
🎯 Set monthly targets in the Target Sheet
-
🕰️ Enter previous year’s data for historical comparison
-
📊 Use the KPI Trend tab to track long-term performance
-
📤 Share with your team for real-time collaboration and updates
👤 Who Can Benefit from This Dashboard?
-
🏭 Food Packaging Companies – Track operations from floor to forecast
-
🧑💼 Operations Managers – Streamline production performance
-
✅ Quality Assurance Teams – Monitor defect and compliance KPIs
-
📈 Consultants & Analysts – Provide strategic insights to clients
-
🚀 Startups & SMEs – Get high-level tracking without high costs


Reviews
There are no reviews yet.