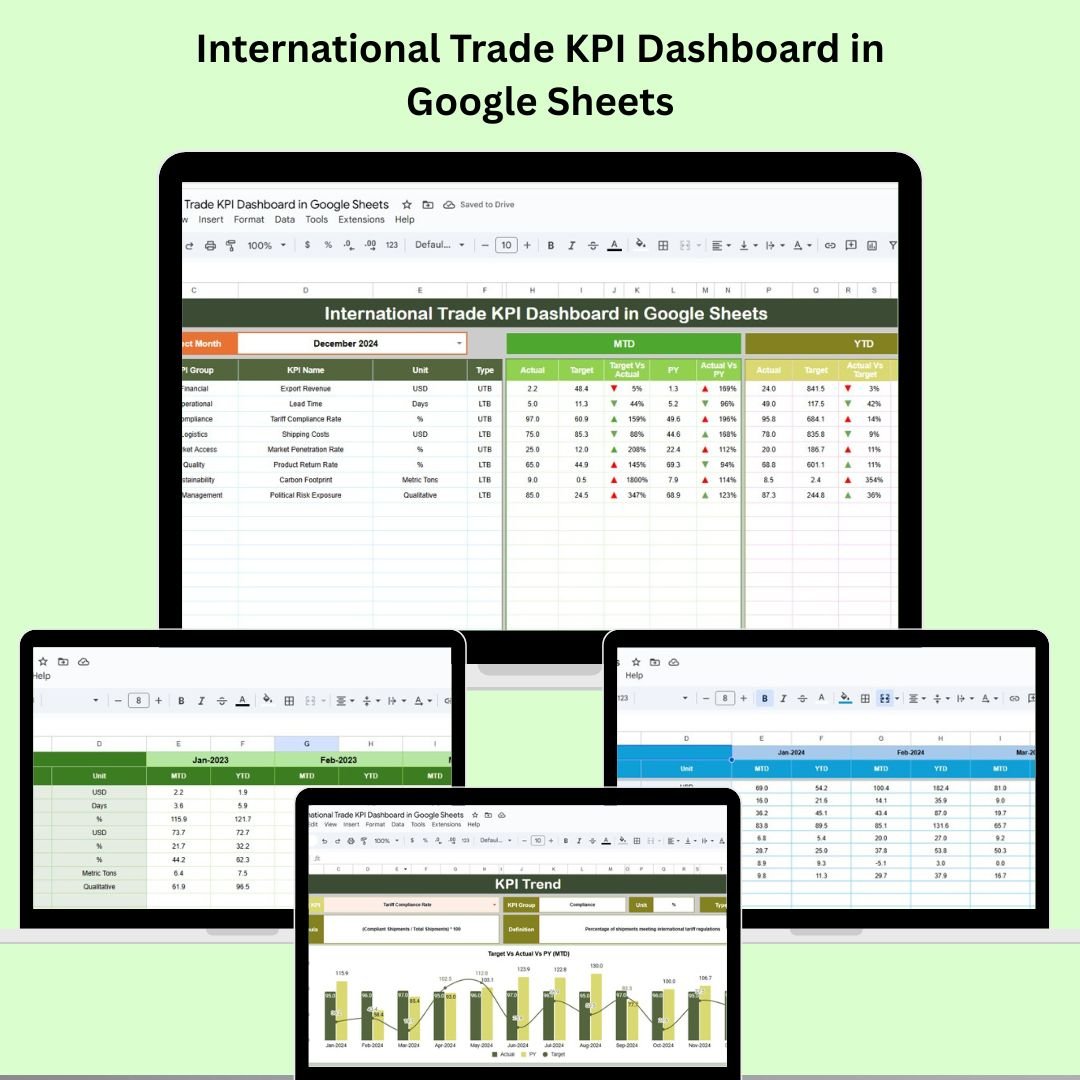
In a fast-paced global marketplace, making informed decisions in import-export operations is no longer optional—it’s a necessity. Whether you’re managing shipping volumes, trade costs, vendor efficiency, or customs performance, you need a crystal-clear view of your trade data.International Trade KPI Dashboard in Google Sheets
The International Trade KPI Dashboard in Google Sheets is your all-in-one trade performance tracker, designed to simplify data management and boost your strategic decision-making. With dynamic monthly reporting, powerful trend visuals, and real-time insights, this tool helps international trade professionals, logistics teams, and supply chain analysts stay ahead of the curve—all within Google Sheets.
⚙️ Key Features of the International Trade KPI Dashboard
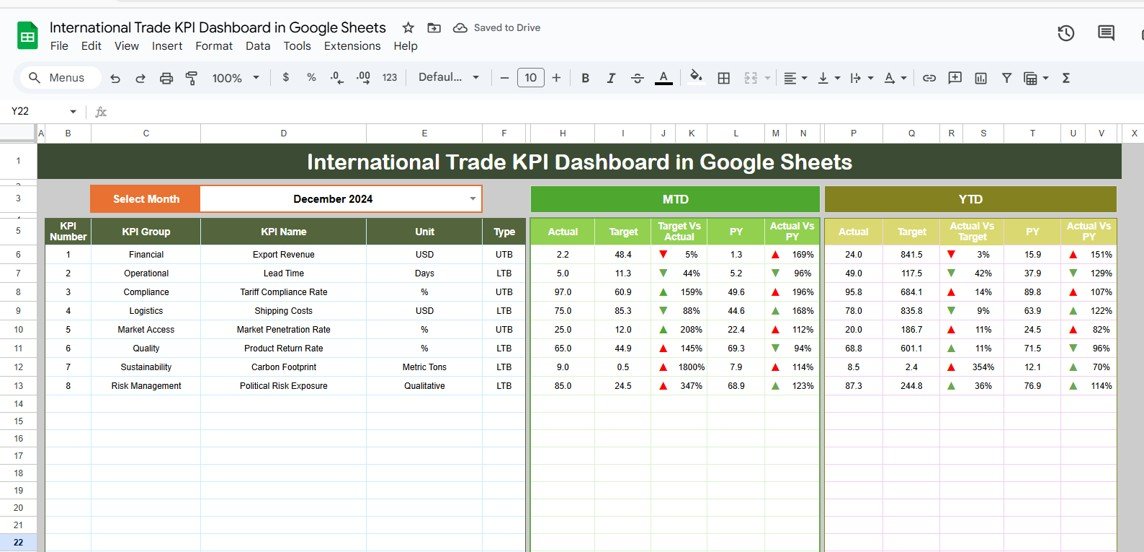
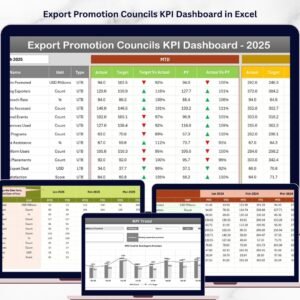
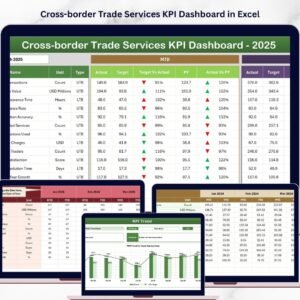
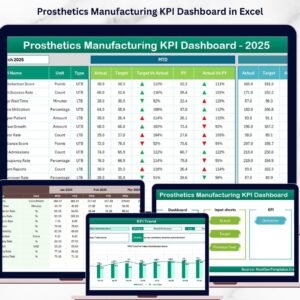
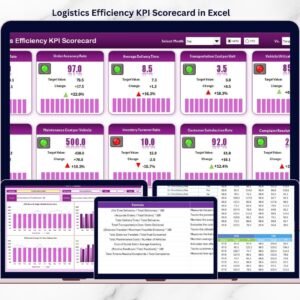
📊 Dynamic KPI Dashboard Sheet
✔️ Month Selector (Cell D3) – Instantly filter the entire dashboard by month.
✔️ MTD & YTD Metrics – Track Actual vs Target and Previous Year side-by-side.
✔️ Trend Arrows & Conditional Formatting – Visual cues show where you’re winning—or slipping.
✔️ Auto Calculations – Spend less time computing and more time optimizing.
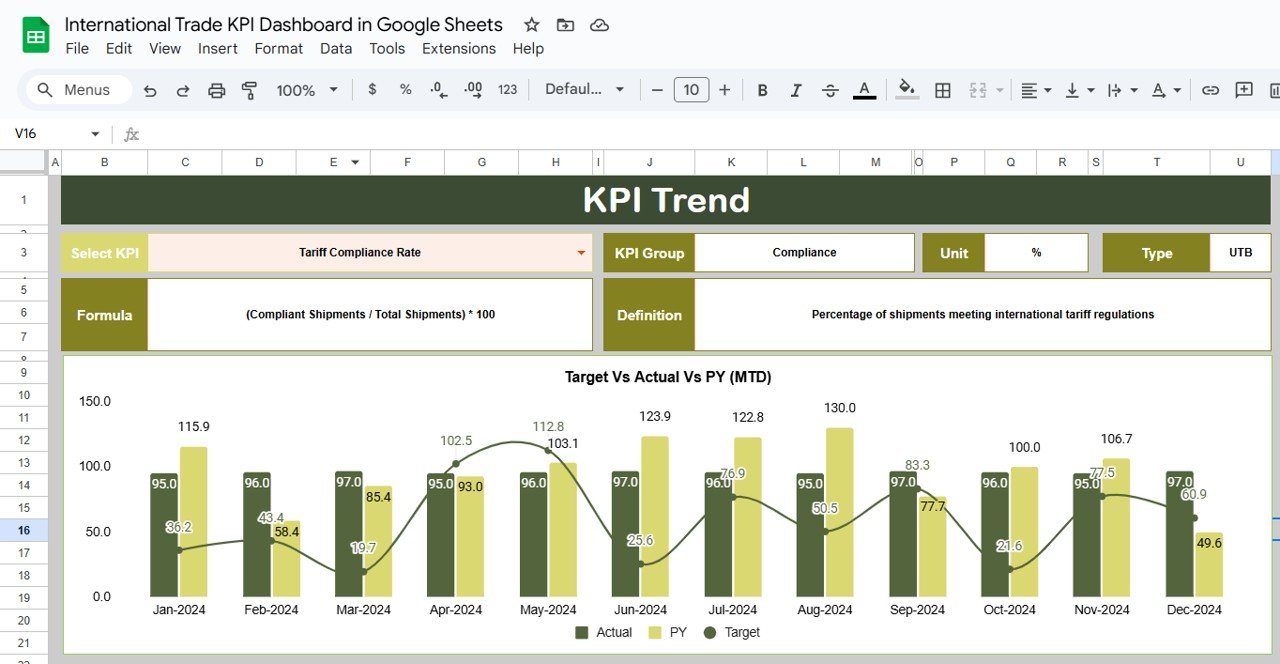
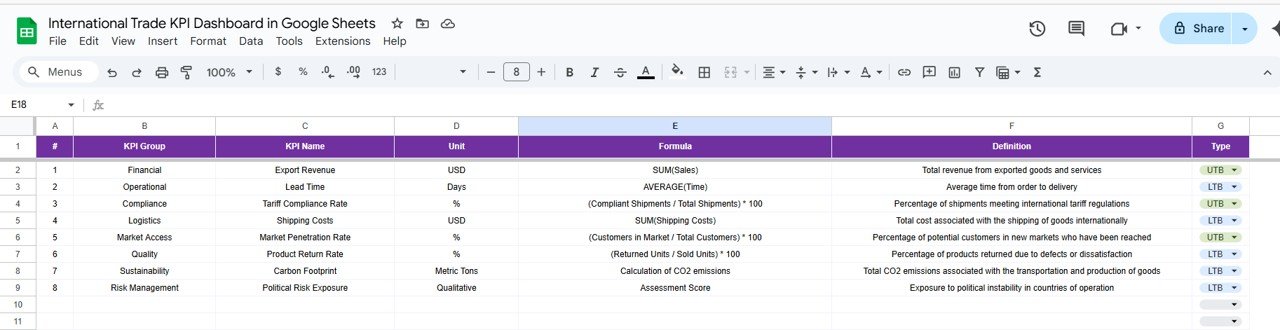
📈 KPI Trend Sheet
🔍 Drill down into any KPI by selecting it from a dropdown (Cell C3).
✅ Shows KPI Group, Unit, Formula, Type (UTB or LTB), and Definition.
📉 Ideal for spotting trends and performance gaps.
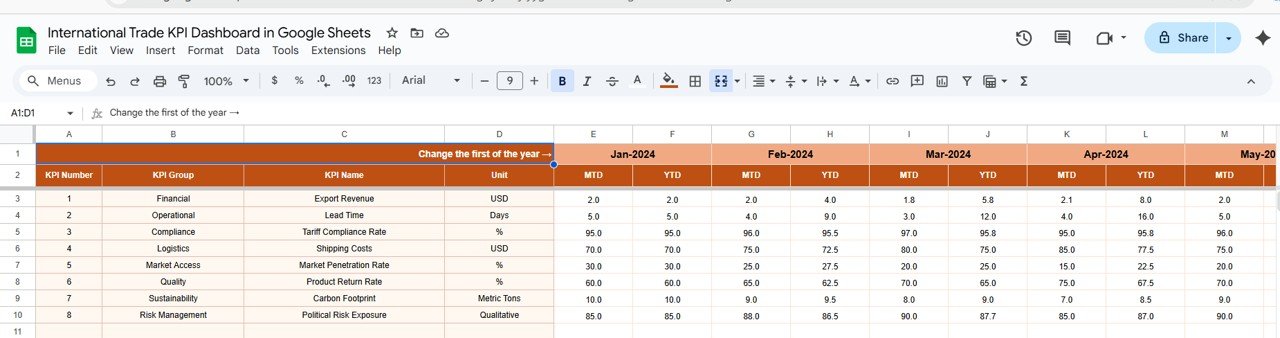
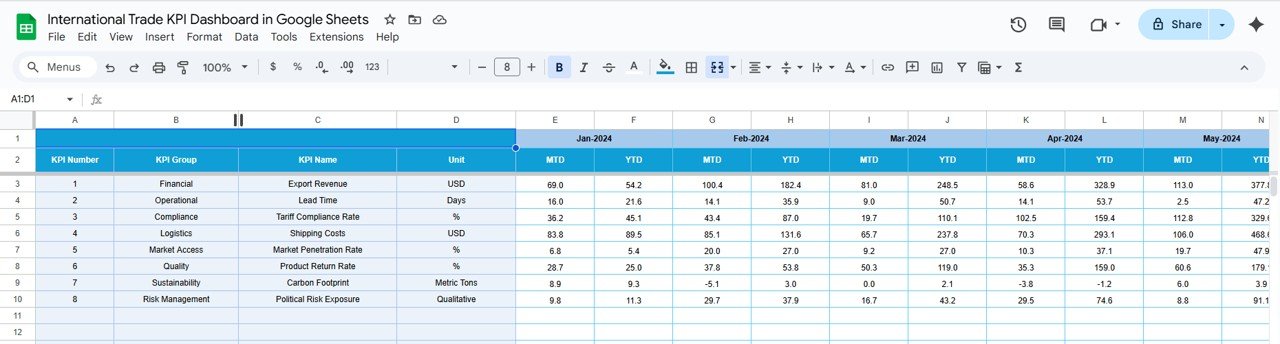
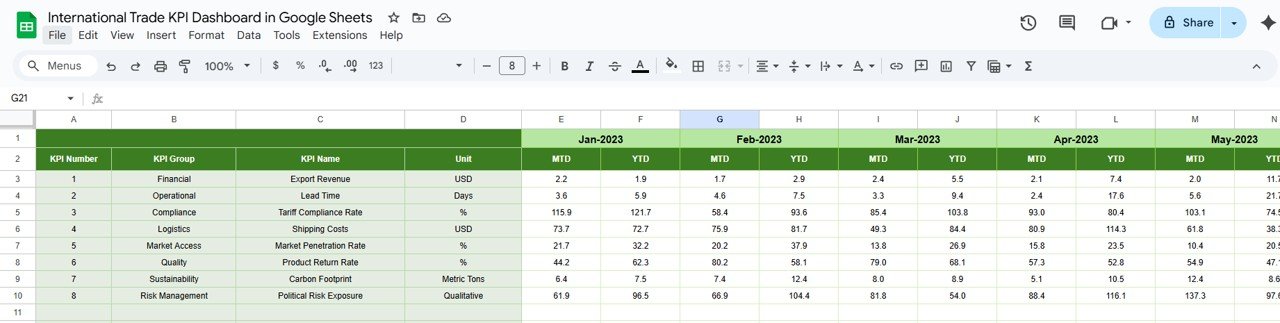
🧾 Actual Numbers, Targets & Previous Year Sheets
📥 Enter MTD and YTD data in structured tables.
🎯 Compare Actual vs Target and Year-over-Year performance.
🧠 Useful for forecasting, benchmarking, and strategic goal-setting.
📚 KPI Definition Sheet
🔖 Store complete definitions, formulas, and units for each KPI.
💡 Clearly identify whether a KPI is “Lower the Better” or “Upper the Better.”
✏️ 100% customizable—add more KPIs based on your business needs.
📦 What’s Inside the Dashboard?
-
1️⃣ Dashboard Sheet – Real-time visual insights with dropdown month selector
-
2️⃣ KPI Trend Sheet – Detailed KPI breakdown with trend tracking
-
3️⃣ Actual Number Sheet – Monthly input of real KPI values
-
4️⃣ Target Sheet – Set goals for every metric
-
5️⃣ Previous Year Data Sheet – Year-over-year growth analysis
-
6️⃣ KPI Definition Sheet – Master list of KPIs with formula, unit, and type
🚀 How to Use the Product
-
Start with the KPI Definition Sheet – Set up your KPIs, units, and aggregation formulas.
-
Enter Monthly Data – Fill in actual numbers, targets, and last year’s data in respective sheets.
-
Select a Month on the Dashboard – Watch the visuals update automatically.
-
Analyze KPI Trends – Use the trend sheet to understand performance over time.
-
Review & Act – Identify inefficiencies, opportunities, and make data-backed trade decisions.
👥 Who Can Benefit from This Dashboard?
-
🌐 Import/Export Analysts – Monitor shipments, trade cost, and vendor timelines
-
🚢 Logistics Managers – Track shipping volumes, delays, and customs clearance
-
📦 Supply Chain Teams – View global supply metrics in a single dashboard
-
💼 Operations Managers – Align business goals with real-time trade KPIs
-
🏢 SMEs & Enterprises – From startups to global exporters, it scales to your needs


Reviews
There are no reviews yet.