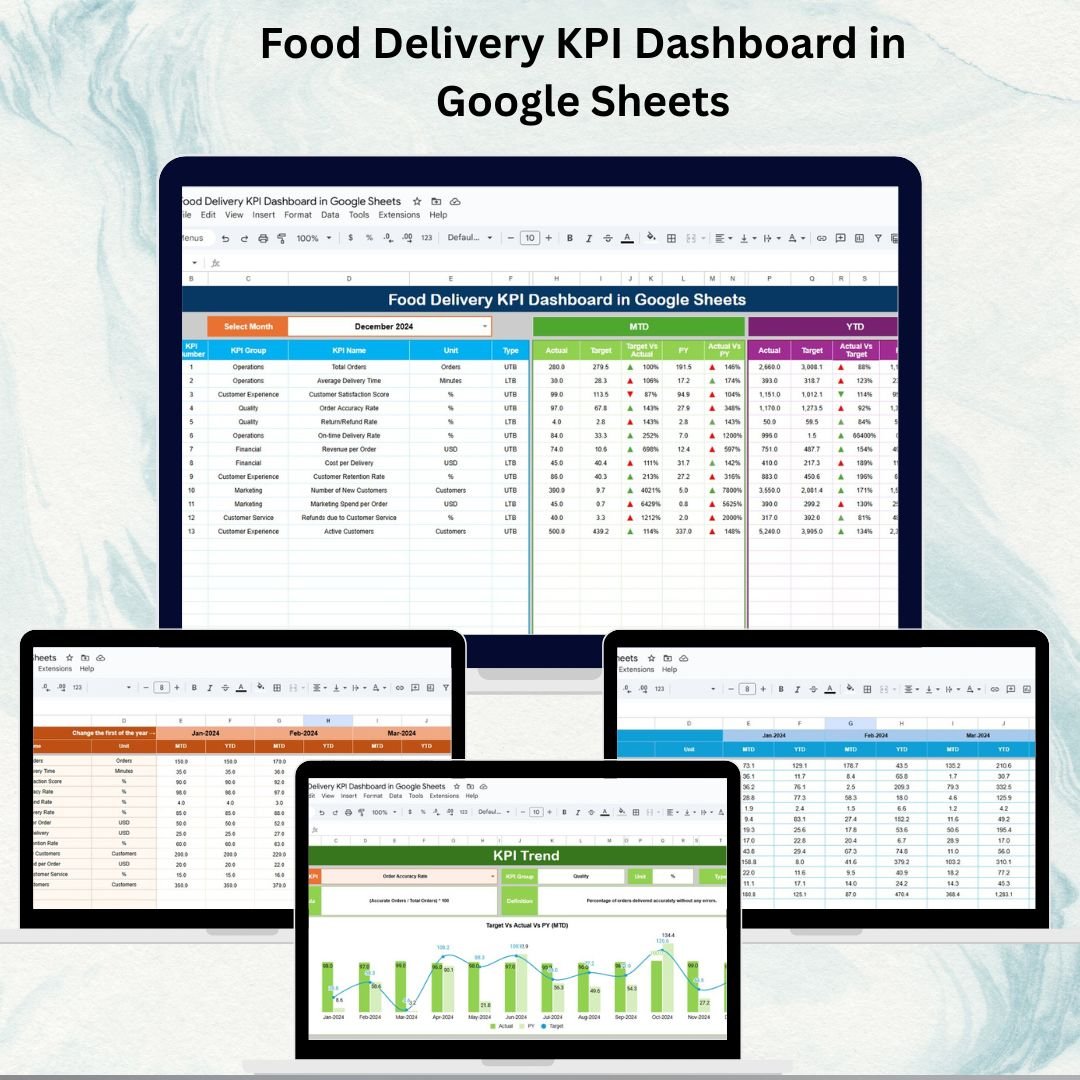
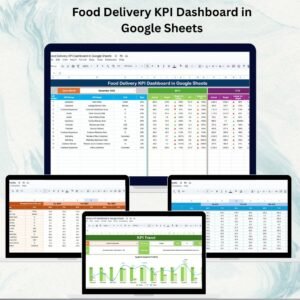
In a fast-paced, highly competitive food delivery environment, every minute and every customer review matters. The Food Delivery KPI Dashboard in Google Sheets is a ready-to-use, fully interactive solution designed to help delivery managers, operations teams, and business owners gain full visibility over all key performance indicators (KPIs) in one place.
Whether you want to monitor delivery time, order accuracy, customer ratings, or compare your performance against monthly targets—this dashboard gives you real-time insights with month-to-date (MTD) and year-to-date (YTD) reporting. With clear conditional formatting and intuitive dropdown selections, it transforms raw data into actionable insights that improve efficiency and customer satisfaction.
🔑 Key Features of the Food Delivery KPI Dashboard
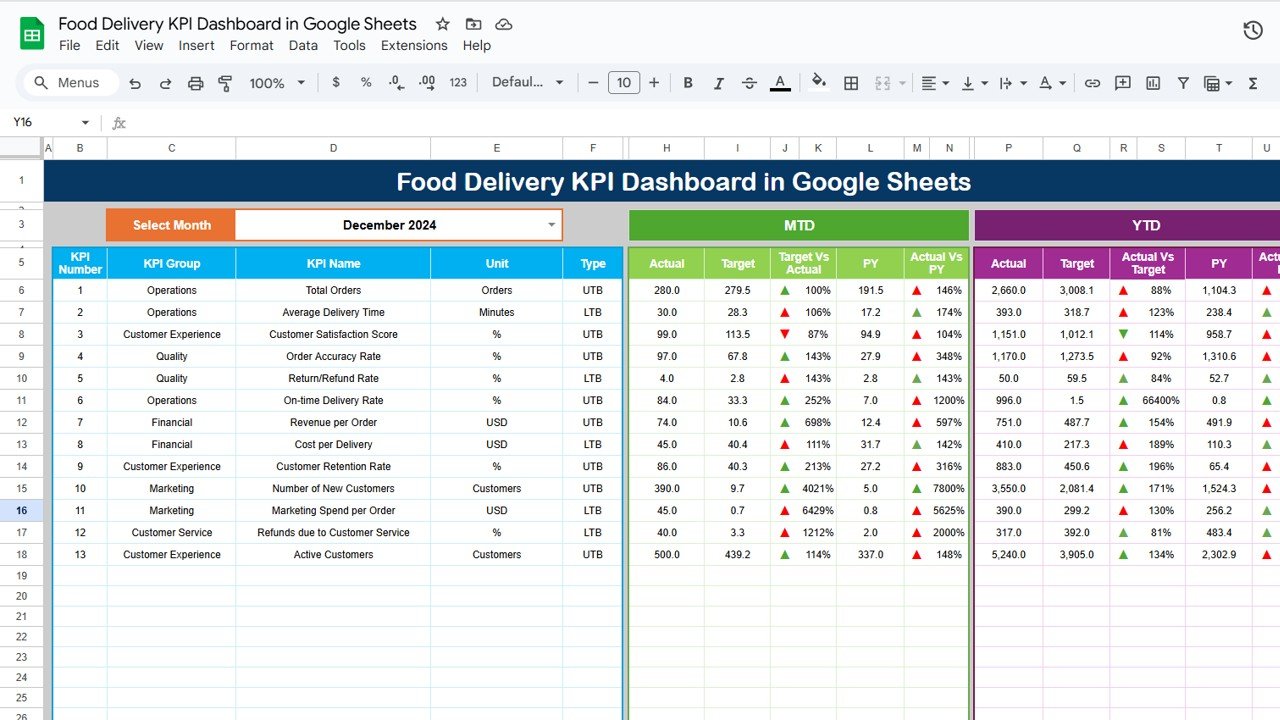
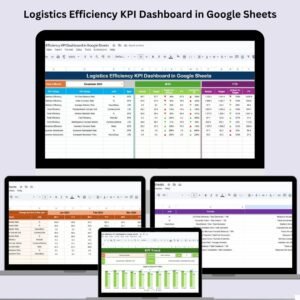
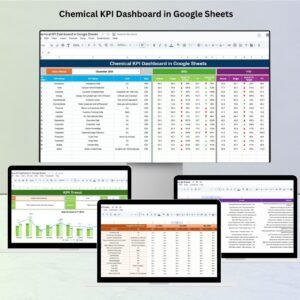
📌 Dashboard Sheet Tab – One-Screen Performance Overview
-
Select the month (Range D3) and automatically view MTD & YTD results
-
Compare Target vs Actual and Previous Year vs Actual using up/down arrows
-
View performance across all KPIs instantly with color indicators
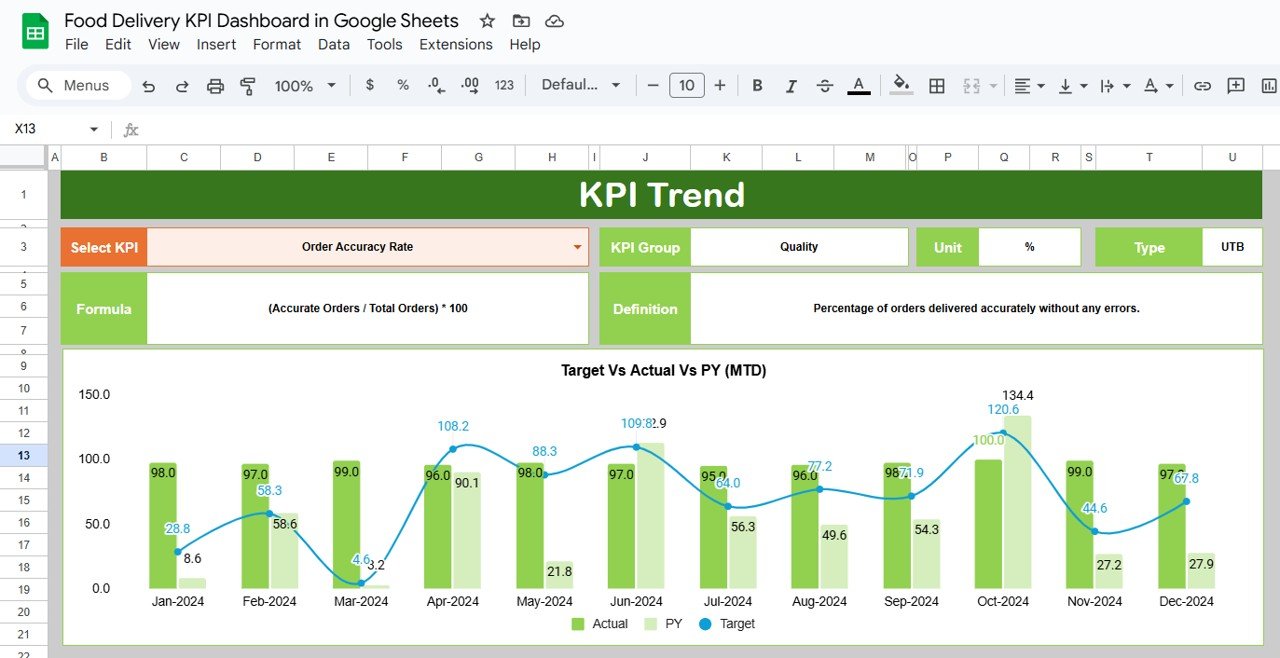
📌 KPI Trend Sheet Tab – Drill Down Into Performance
-
Select any KPI from a dropdown (Range C3)
-
View KPI Group, Unit, Formula, and Definition
-
Analyze trend over time and understand calculation logic
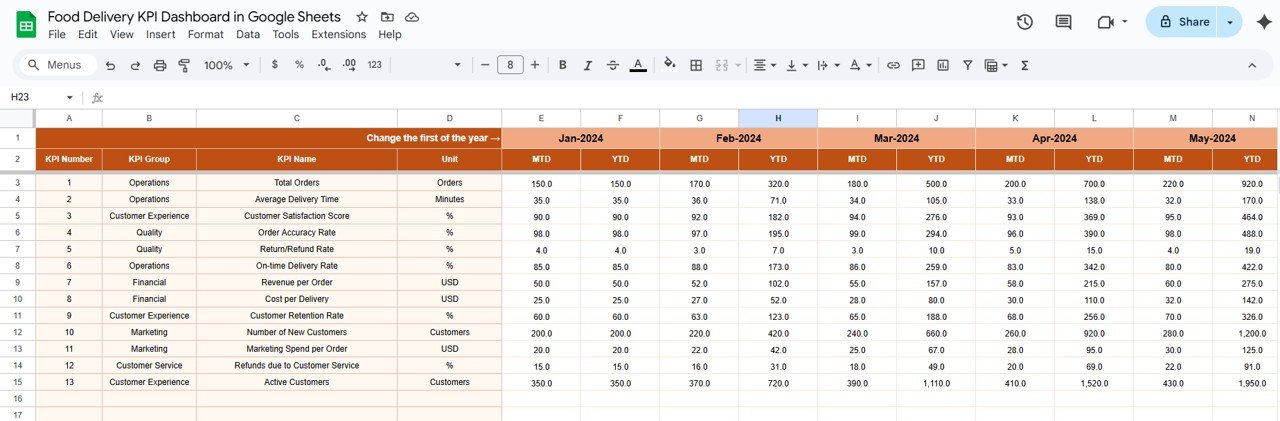
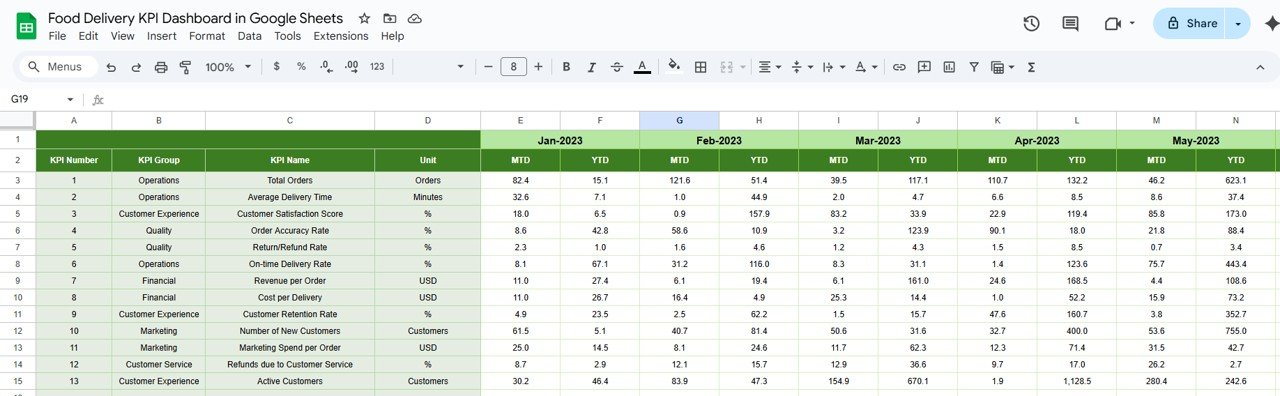
📌 Actual Numbers Sheet Tab – Easy Data Entry
-
Enter monthly MTD & YTD actuals
-
Choose the first month of fiscal year (Range E1)
-
Automatic calculation of cumulative results
📌 Target Sheet Tab – Goal Alignment
-
Record Monthly Target and YTD Target values for each KPI
-
Automatically compares with actuals in the Dashboard
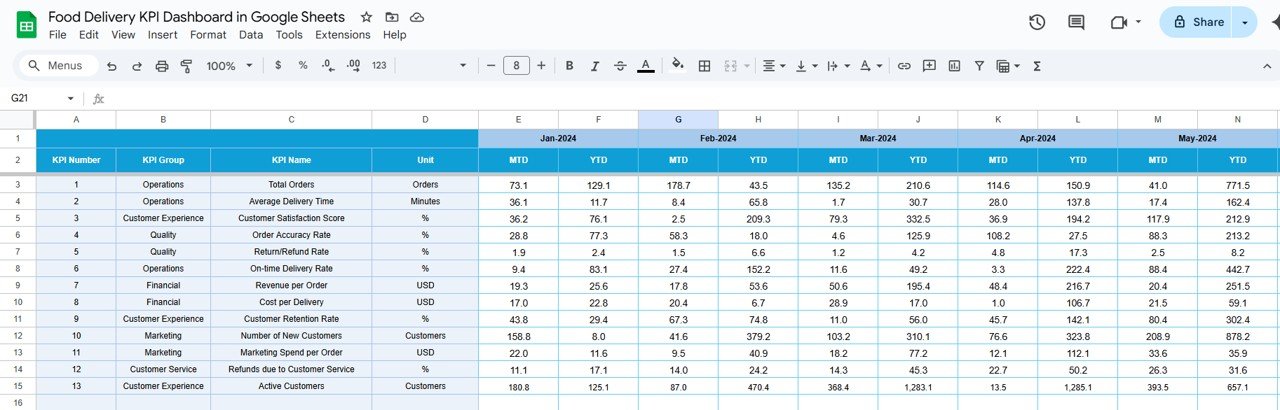
📌 Previous Year Numbers Sheet Tab – Year-on-Year Comparison
-
Store previous year KPI values for direct comparison
-
Quickly assess performance improvement or decline
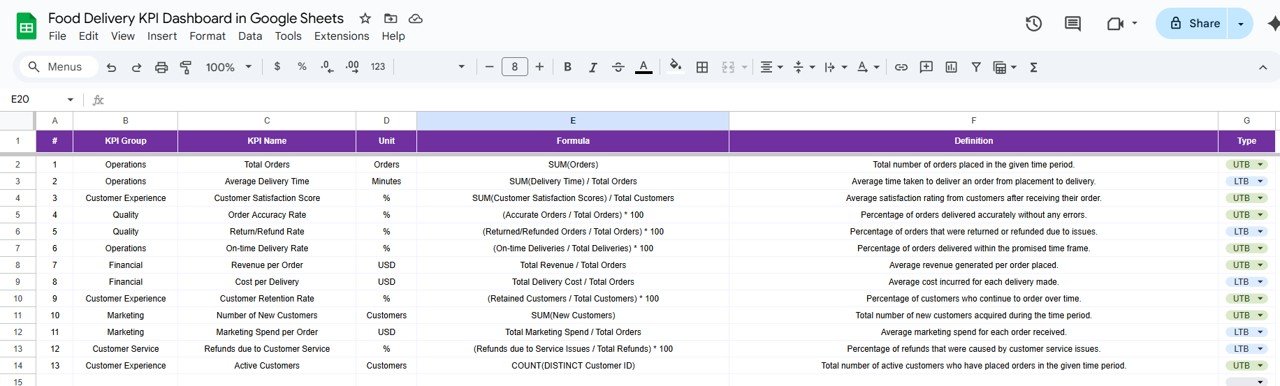
📌 KPI Definition Sheet Tab – KPI Clarification
-
Shows KPI Name, Group, Unit, Formula, and Definition
-
Indicates whether each KPI is LTB (Lower the Better) or UTB (Upper the Better)
-
Helps standardize KPI tracking across the team
📦 What’s Inside the Food Delivery KPI Dashboard?
✅ Dashboard Sheet – Interactive KPI overview
✅ KPI Trend Sheet – Detailed KPI drill down
✅ Actual Numbers Sheet – Raw performance data input
✅ Target Sheet – KPI target entries
✅ Previous Year Sheet – Historical KPI data
✅ KPI Definition Sheet – KPI formulas & definitions
✅ Pre-built Formulas & Charts – No setup required
✅ Customizable Format – Add/remove KPIs as needed
🧠 How to Use the Dashboard
-
Make a copy of the template in Google Drive
-
Enter actual performance data in the Actual Numbers Sheet
-
Fill in KPI targets in the Target Sheet
-
Add previous year data for comparison
-
Select a month on the Dashboard and review insights
-
Use the KPI Trend Sheet to analyze trends and spot issues
👥 Who Can Benefit from This Dashboard?
-
🚚 Delivery Managers – Monitor delivery performance & speed
-
🏪 Restaurant Owners – Improve order accuracy & customer ratings
-
📦 Operations Teams – Track daily operational KPIs
-
📊 Business Analysts – Compare targets vs actuals and identify bottlenecks
🔗 Click here to read the Detailed blog post
Watch the step-by-step video Demo:


Reviews
There are no reviews yet.