

In today’s highly competitive market, understanding customer engagement is essential for business growth. The Customer Engagement KPI Dashboard in Google Sheets is a powerful tool designed to help businesses track and analyze their customer engagement metrics. This customizable dashboard provides real-time insights into key performance indicators (KPIs), enabling businesses to make data-driven decisions to improve customer satisfaction and retention.
Key Features:
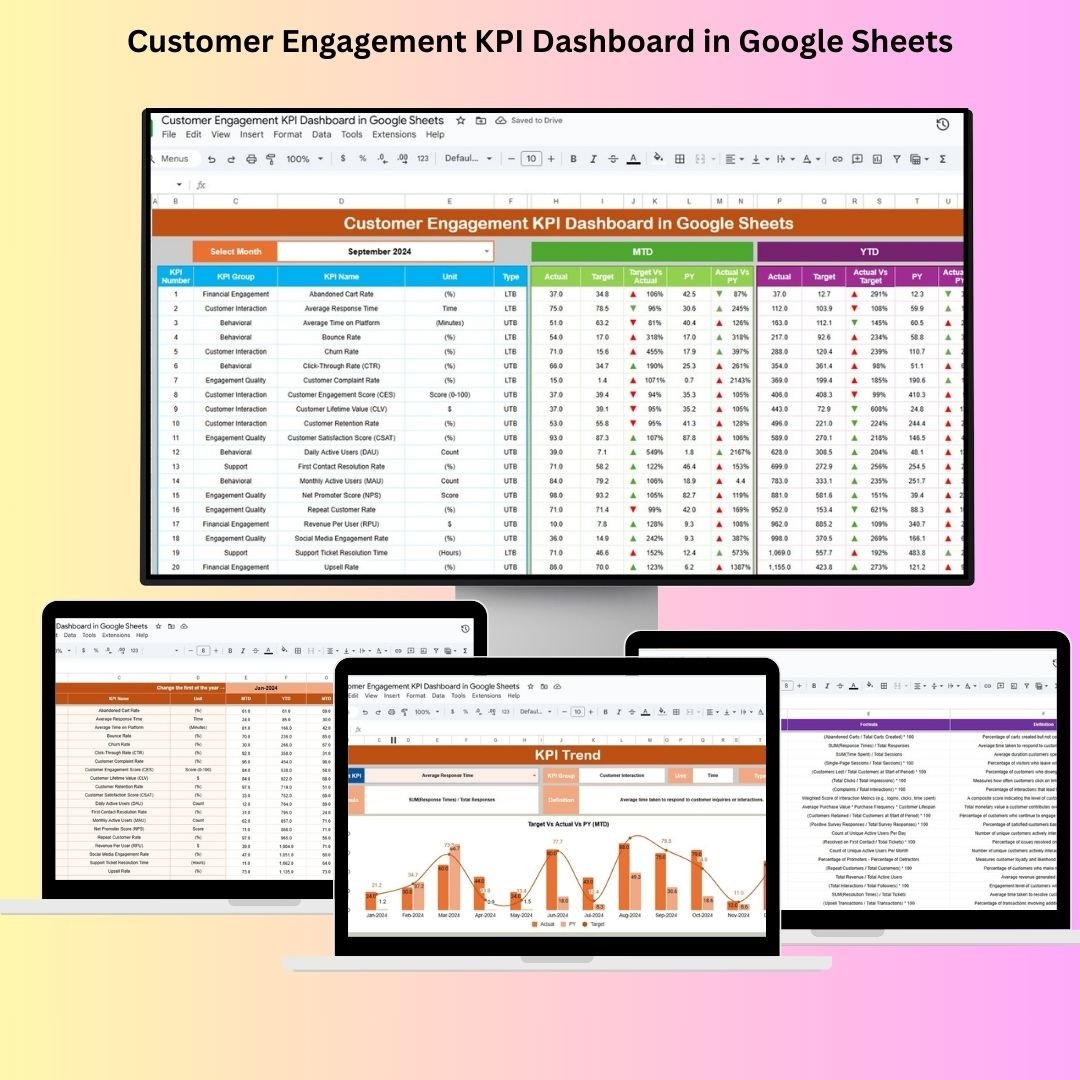
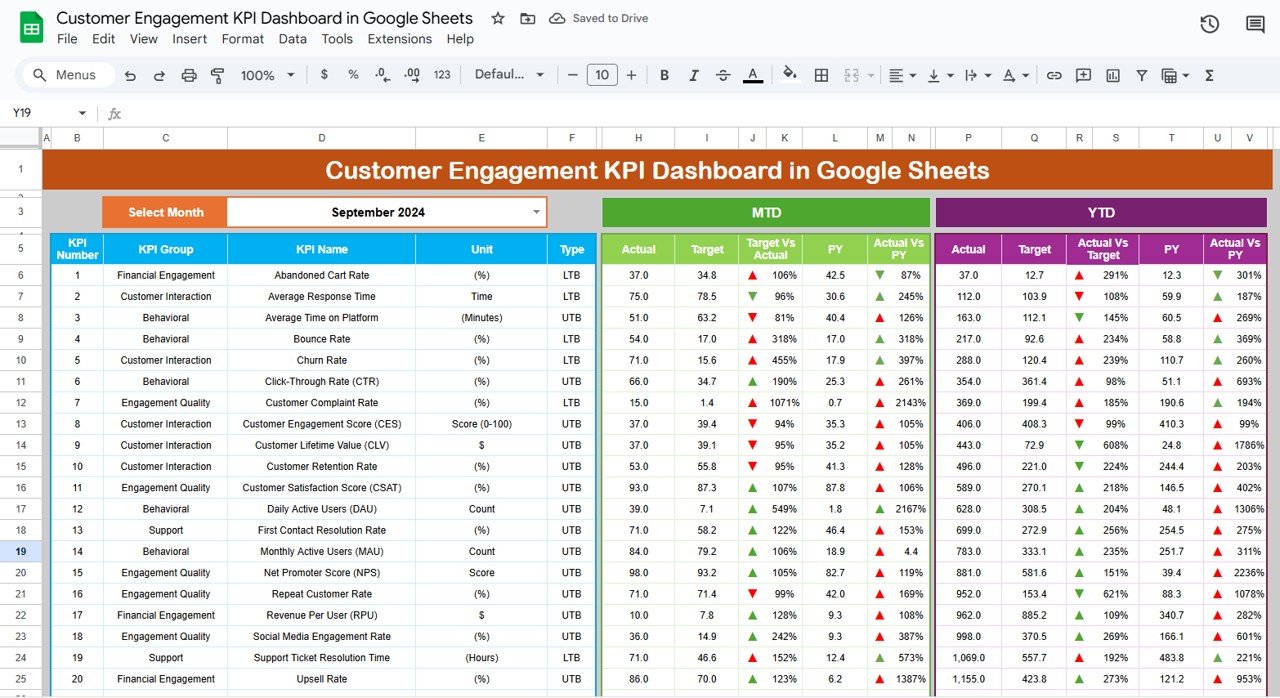
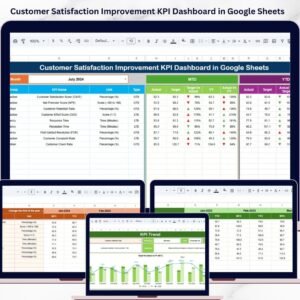
Dashboard Overview: The main sheet provides an overview of all critical customer engagement KPIs, including:
Month Selector: A dropdown to select the desired month and view corresponding data.
MTD & YTD Metrics: Shows Month-to-Date and Year-to-Date actual numbers, target values, and comparison to the previous year.
Comparisons: Display Target vs Actual and Previous Year vs Actual comparisons with conditional formatting to highlight performance trends.
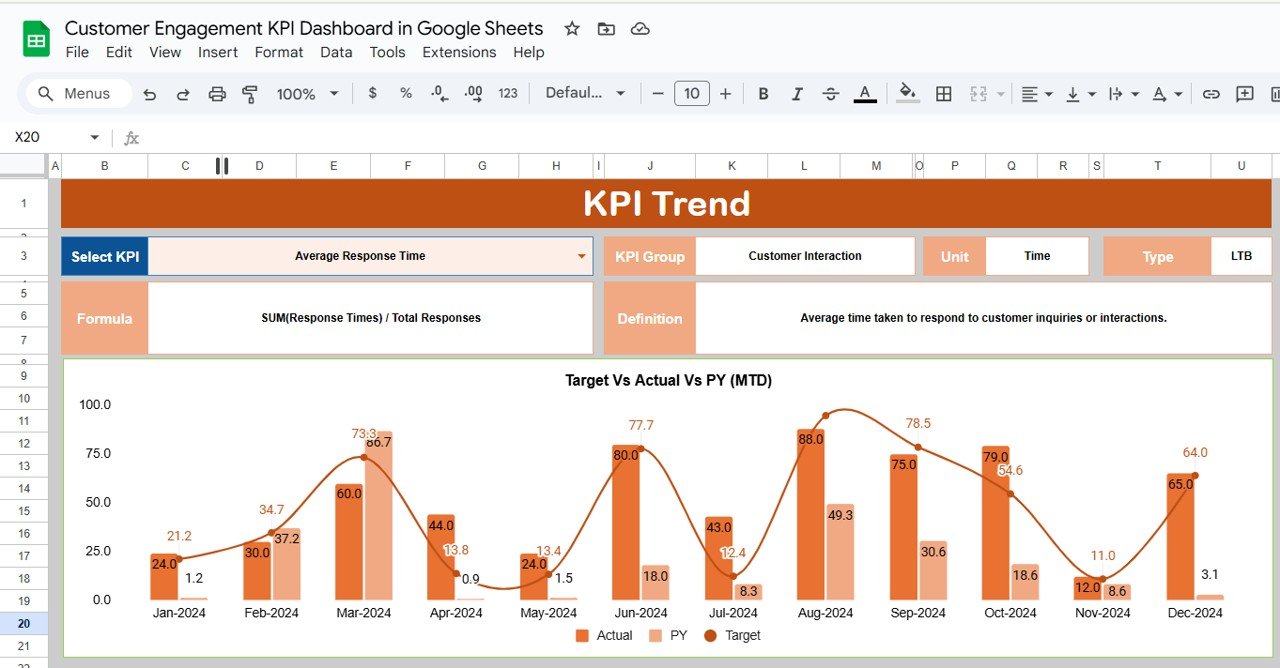
KPI Trend Sheet: Offers an in-depth view of each KPI’s performance over time. Key features include:
KPI Selection: Dropdown menus allow you to select individual KPIs and analyze their trends.
KPI Details: Provides definitions, units of measure, and formulas for each KPI to ensure clarity.
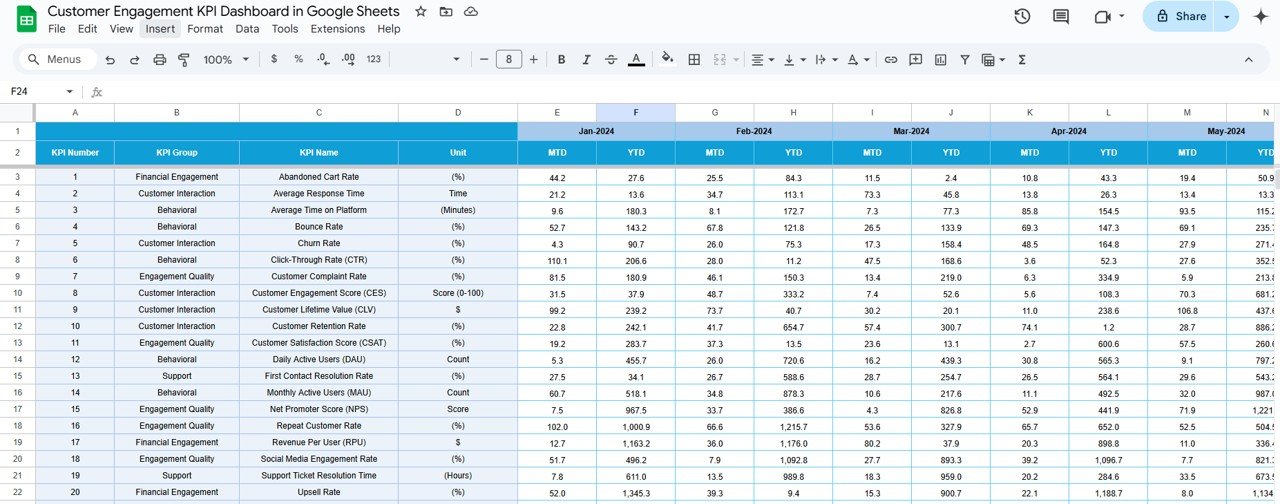
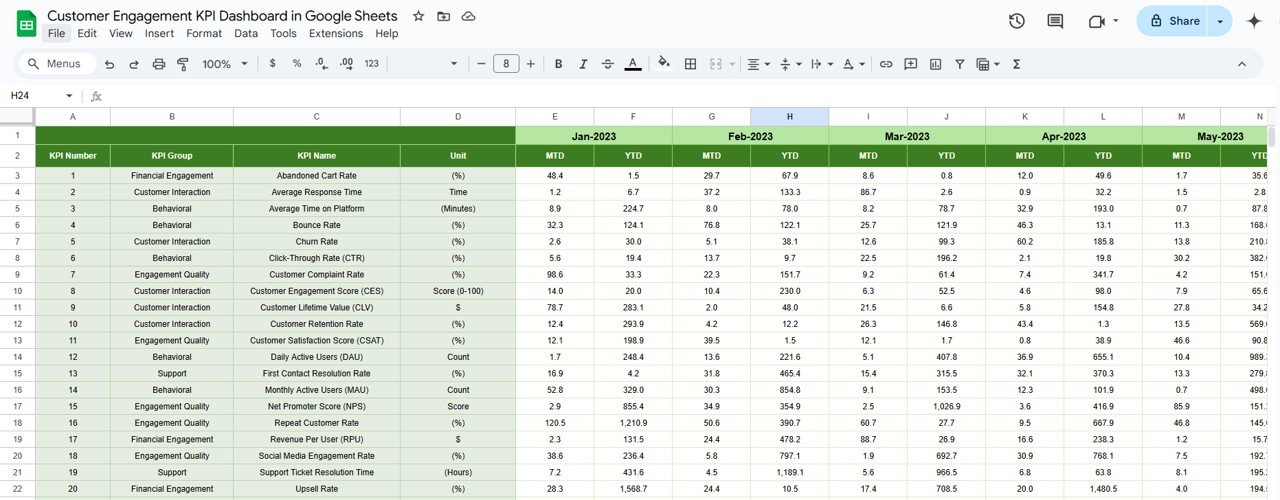
Actual Numbers Sheet: This is where the actual performance data is entered. You can:
Track Data Inputs: Input actual performance numbers for each KPI.
Compare with Targets: Monitor progress against your set targets.
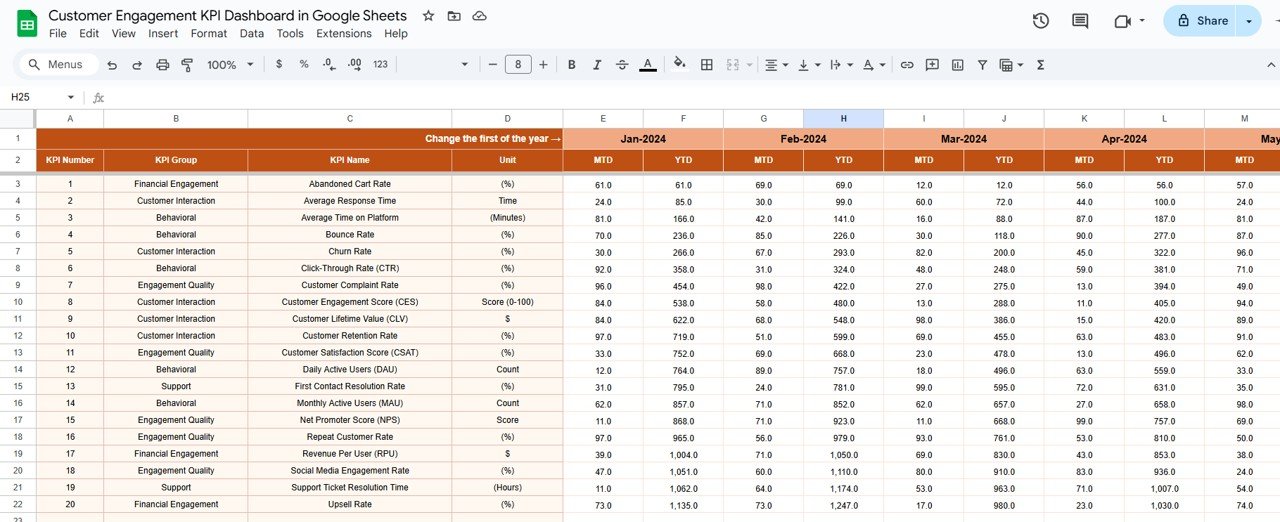
Target Sheet: Allows you to set and adjust targets for each KPI, ensuring you are aligned with your business objectives. Features include:
MTD & YTD Targets: Enter target values for the month and year.
Progress Monitoring: Compare actual results against the set targets.
Previous Year Numbers Sheet: Compares your current performance against previous year data, offering:
Historical Comparisons: Easily track year-over-year growth and performance trends.
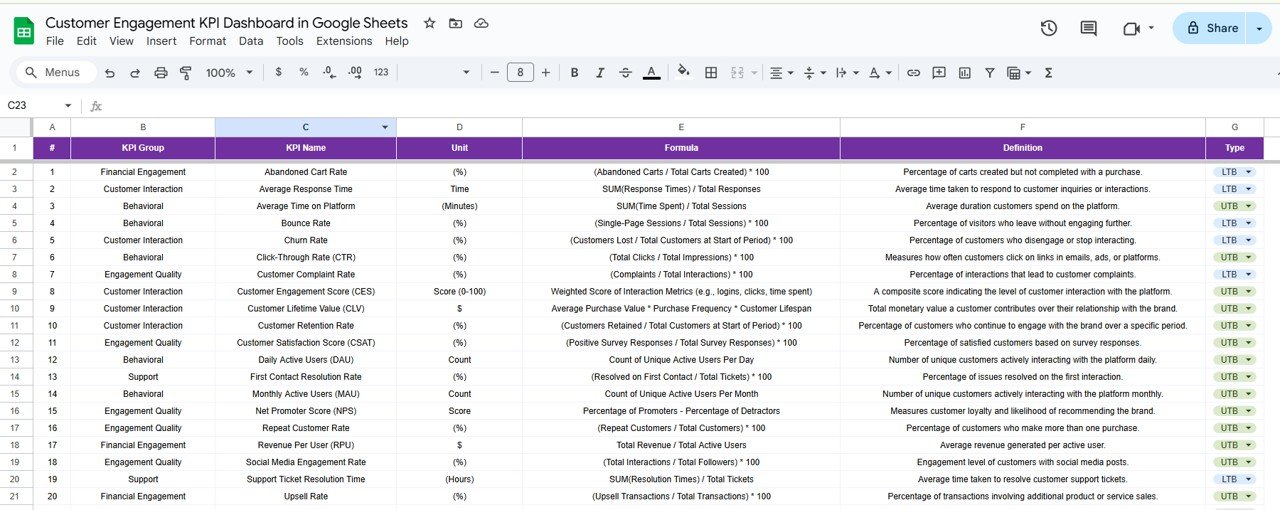
KPI Definition Sheet: A guide to all KPIs tracked in the dashboard. It includes:
KPI Name and Group: Categorize KPIs for better management.
Definition and Formula: Ensures everyone understands how each KPI is measured and calculated.
Benefits:
Comprehensive Performance Monitoring: Track all customer engagement metrics in one place, giving you a holistic view of your customer relationship strategies.
Real-Time Insights: Update your KPIs with actual data and instantly see how your business is performing. This helps you make informed decisions quickly.
Data-Driven Decision Making: Use the insights from your KPI trends to make data-backed decisions that enhance customer satisfaction and retention.
Customizable for Your Business Needs: Modify the dashboard to track KPIs that matter most to your business, making it adaptable to various industries and objectives.
Improved Accountability: By having clear and transparent KPIs, team members are encouraged to stay focused on improving customer engagement and performance metrics.
How to Use:
Access the Template: Open the provided Google Sheets link to access the dashboard template.
Customize KPIs: Adjust the template to suit your business needs by selecting the KPIs that align with your goals and objectives.
Enter Actual Data: Input your actual customer engagement data into the “Actual Numbers” sheet and set corresponding targets in the “Target” sheet.
Analyze Trends: Use the KPI Trend Sheet to analyze how your performance evolves over time and identify any issues that need attention.
Monitor and Adjust: Regularly check the “Dashboard Overview” sheet to track your performance and compare it to your targets. Make any necessary adjustments to optimize engagement strategies.
Conclusion:
The Customer Engagement KPI Dashboard in Google Sheets is an essential tool for any business looking to optimize customer relationships. By consolidating all key metrics into one user-friendly platform, businesses can easily track and analyze customer engagement data. This dashboard empowers teams to make data-driven decisions, improve customer experiences, and ultimately, drive business growth.
🔗 Click here to read the Detailed blog post
Visit our YouTube channel to learn step-by-step video tutorials
Youtube.com/@PKAnExcelExpert






Reviews
There are no reviews yet.