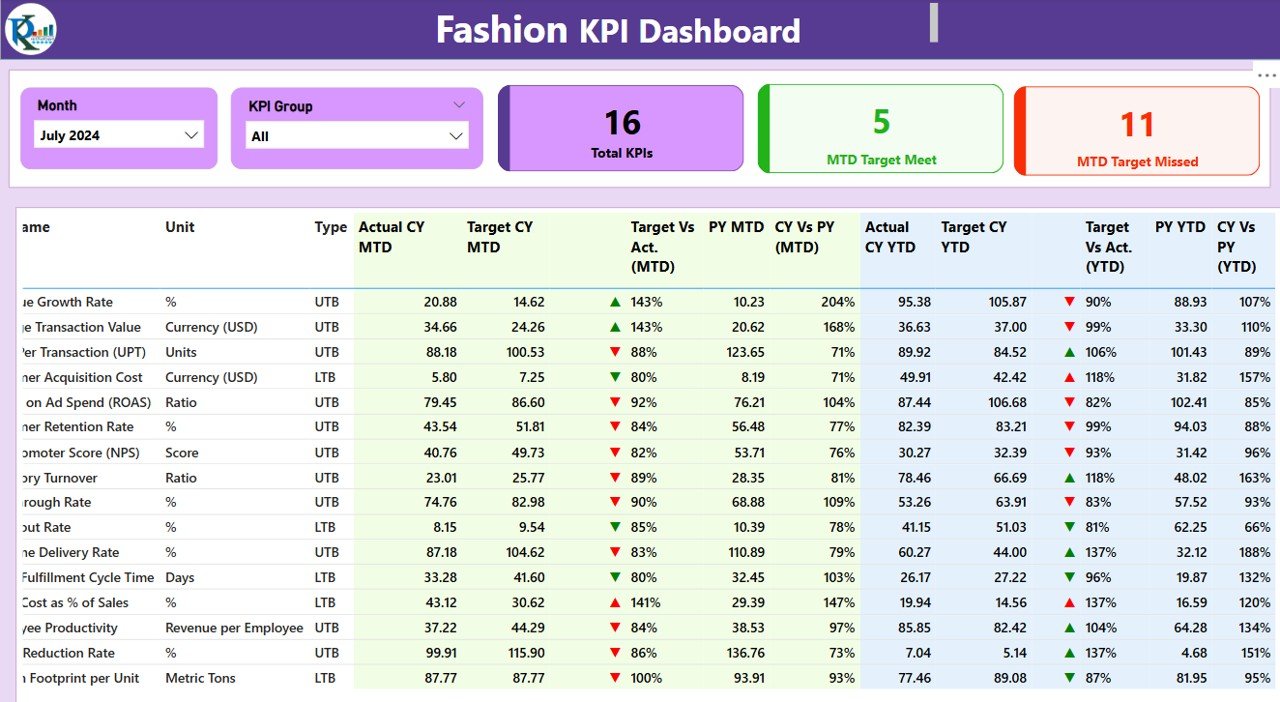
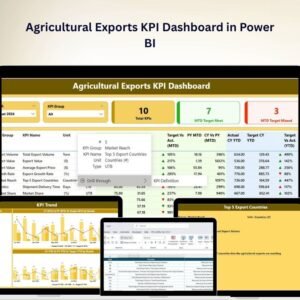
The Fashion KPI Dashboard in Power BI is a sophisticated tool designed specifically for fashion retailers, brands, and industry professionals to track and analyze key performance indicators (KPIs) related to the fashion business. Whether you’re managing inventory, sales, customer satisfaction, or marketing effectiveness, this dashboard provides actionable insights to improve business decisions and boost overall performance.
From tracking sales growth and customer behavior to monitoring inventory turnover and supply chain performance, this dashboard allows you to make data-driven decisions that enhance operational efficiency and maximize profitability. With its visually rich interface and real-time data integration, you can get a complete view of your fashion business, enabling you to adapt quickly in an ever-evolving market.
Key Features of the Fashion KPI Dashboard in Power BI
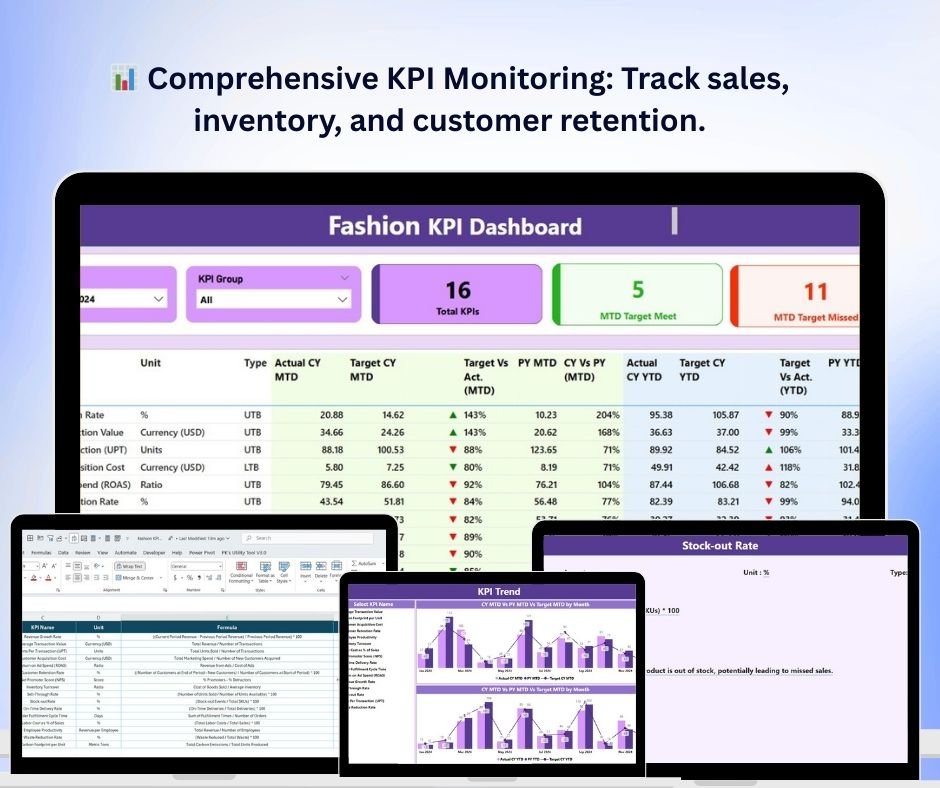
📊 Comprehensive KPI Monitoring
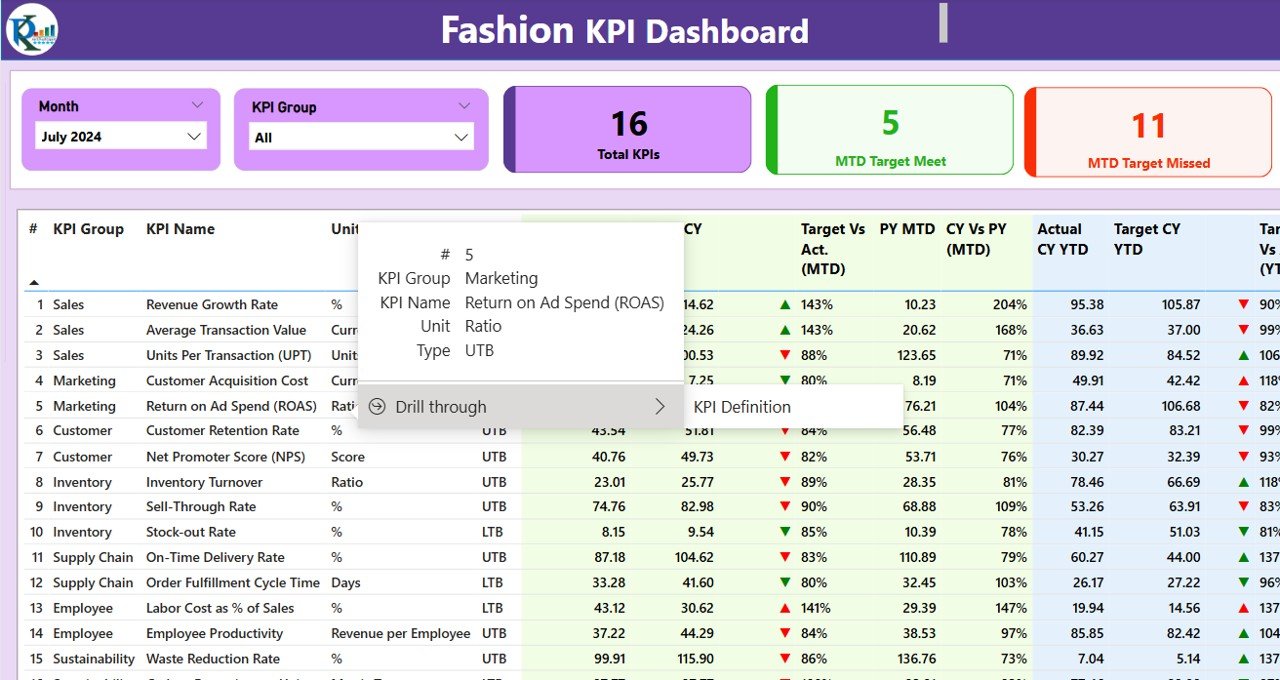
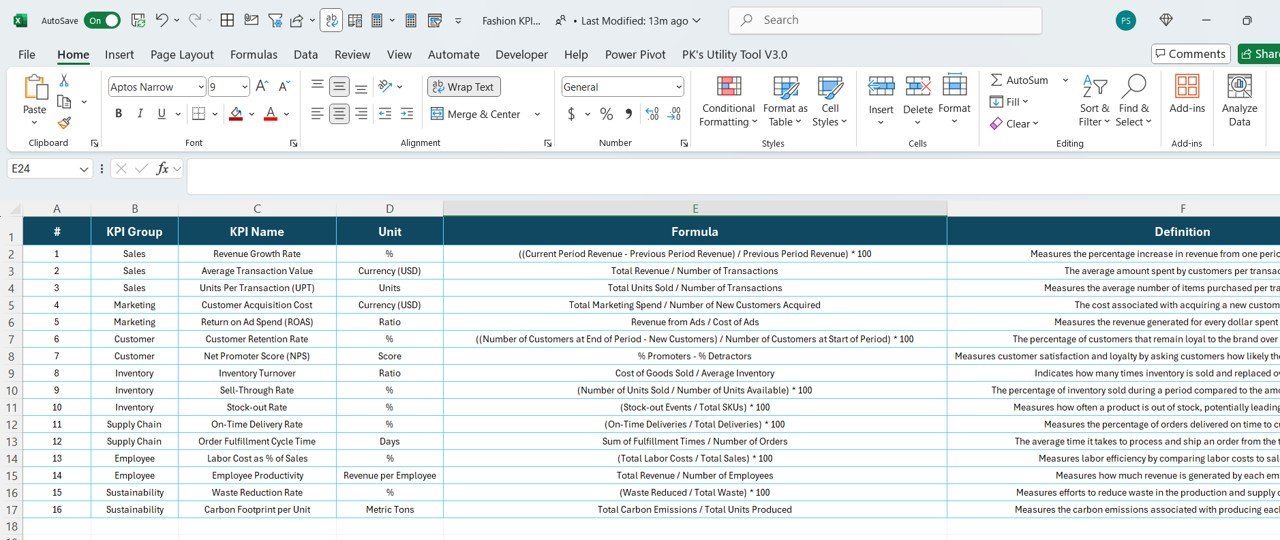
Track essential KPIs such as sales revenue, profit margins, inventory turnover, and customer retention. Use this data to evaluate performance across all areas of your fashion business, from product sales to customer engagement.
📈 Sales and Profitability Tracking
Monitor your fashion sales, profit margins, and conversion rates in real time. This allows you to assess which products or collections are performing best, identify trends, and adjust pricing or inventory strategies accordingly.
🔄 Inventory Management & Stock Levels
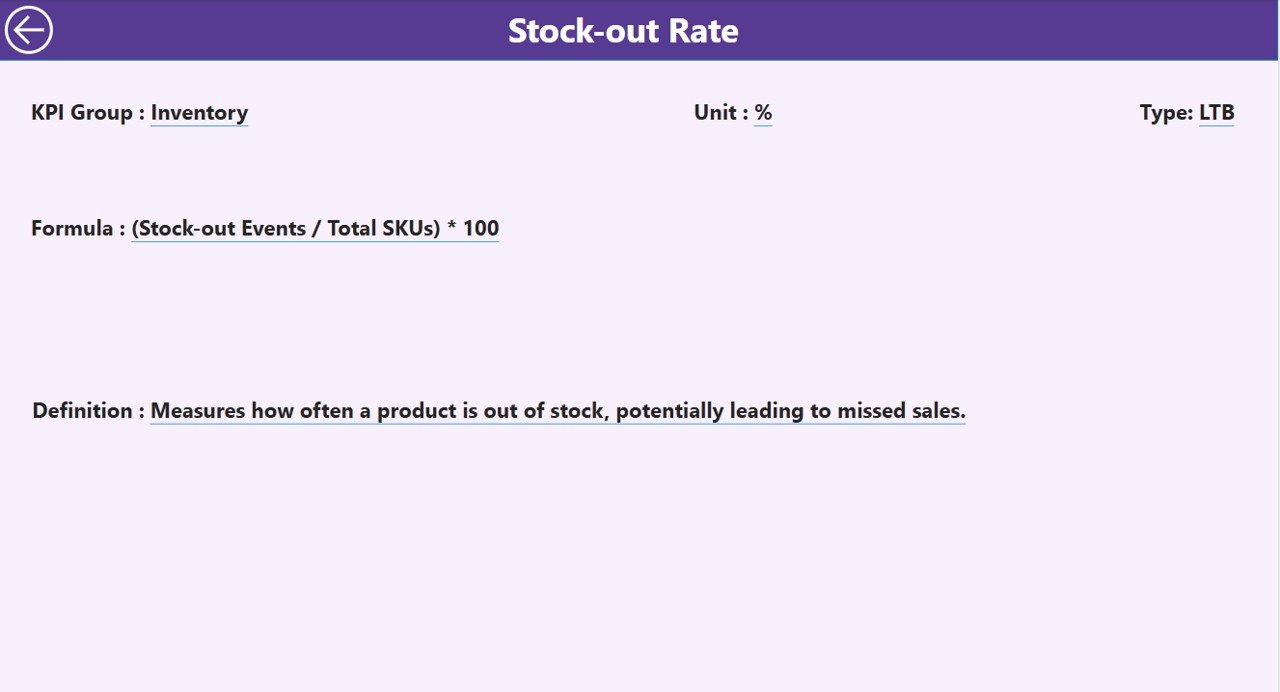
Track inventory levels, turnover rates, and stock performance. Use these insights to prevent overstocking or stockouts, optimize supply chain processes, and reduce excess inventory.
💡 Customer Behavior Insights
Analyze customer buying patterns, retention rates, and demographics to better understand your target audience. This helps in refining marketing strategies and improving customer engagement.
🛍 Sales Channel Performance
Monitor performance across multiple sales channels, including online stores, brick-and-mortar locations, and wholesale. Identify which channels are performing best and optimize strategies accordingly.
⚙️ Real-Time Data Integration
Integrate real-time data from various sources such as POS systems, e-commerce platforms, and inventory management tools. This ensures that you are always working with the most accurate and up-to-date information.
Why You’ll Love the Fashion KPI Dashboard in Power BI
✅ Comprehensive Business Insights
Track every aspect of your fashion business, from sales and customer behavior to inventory management and profitability, all in one place.
✅ Optimize Sales & Marketing Efforts
By monitoring sales performance and customer behavior, you can fine-tune your sales strategies, marketing campaigns, and promotions to drive growth.
✅ Improve Inventory Management
Track stock levels, turnover rates, and restocking needs, helping you avoid overstocking or stockouts and optimizing inventory to meet customer demand.
✅ Make Data-Driven Decisions
Leverage powerful data insights to make informed decisions about pricing, promotions, inventory replenishment, and marketing campaigns.
✅ Customizable & Scalable
The dashboard is fully customizable to fit your specific business needs. Whether you’re a small boutique or a large fashion retailer, the dashboard can scale to meet your requirements.
What’s Inside the Fashion KPI Dashboard in Power BI?
-
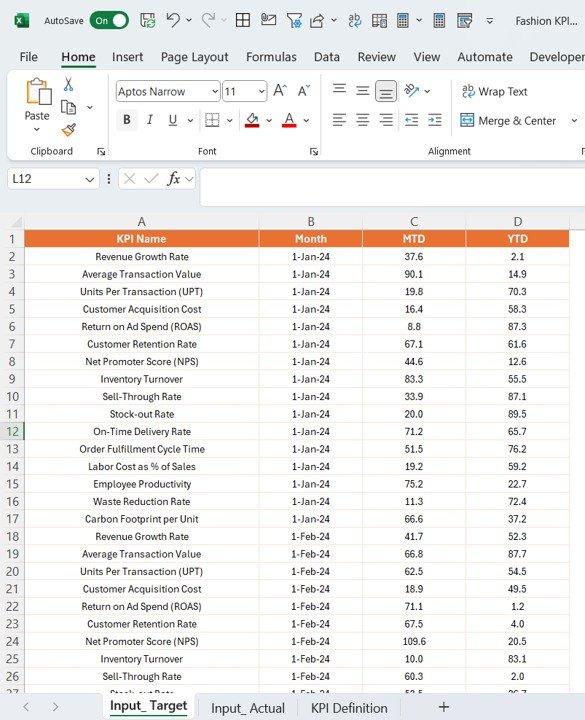
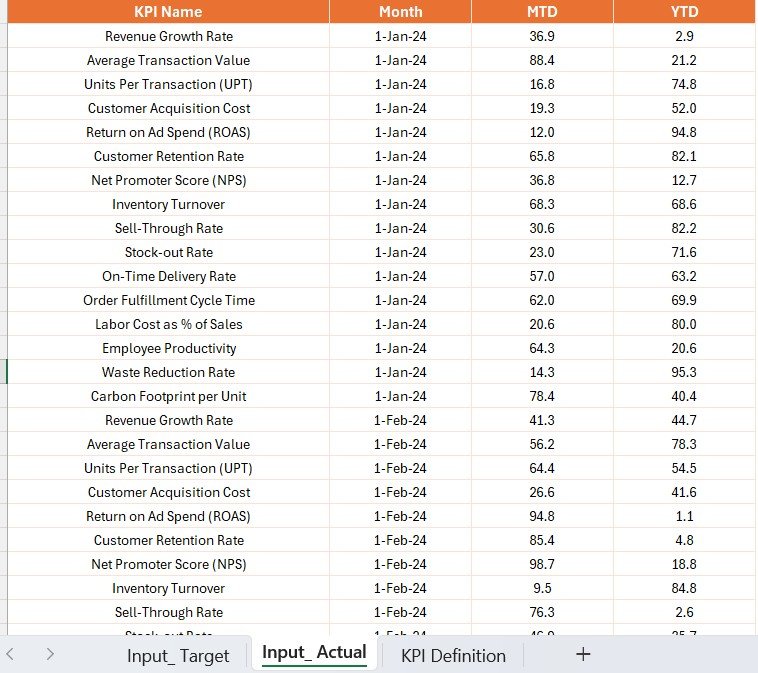
Comprehensive KPI Monitoring: Track sales, profit margins, inventory, and customer retention.
-
Sales & Profitability Tracking: Monitor sales revenue, profit margins, and conversion rates.
-
Inventory Management & Stock Levels: Track inventory turnover and stock performance.
-
Customer Behavior Insights: Analyze customer demographics, buying patterns, and retention.
-
Sales Channel Performance: Monitor performance across all sales channels.
-
Real-Time Data Integration: Integrate data from various sources for up-to-date insights.
How to Use the Fashion KPI Dashboard in Power BI
1️⃣ Download the Template: Access the Fashion KPI Dashboard in Power BI instantly.
2️⃣ Integrate Your Data Sources: Link your sales, inventory, and customer data sources to the dashboard for real-time updates.
3️⃣ Track Key Metrics: Monitor important KPIs such as sales, inventory levels, and customer retention.
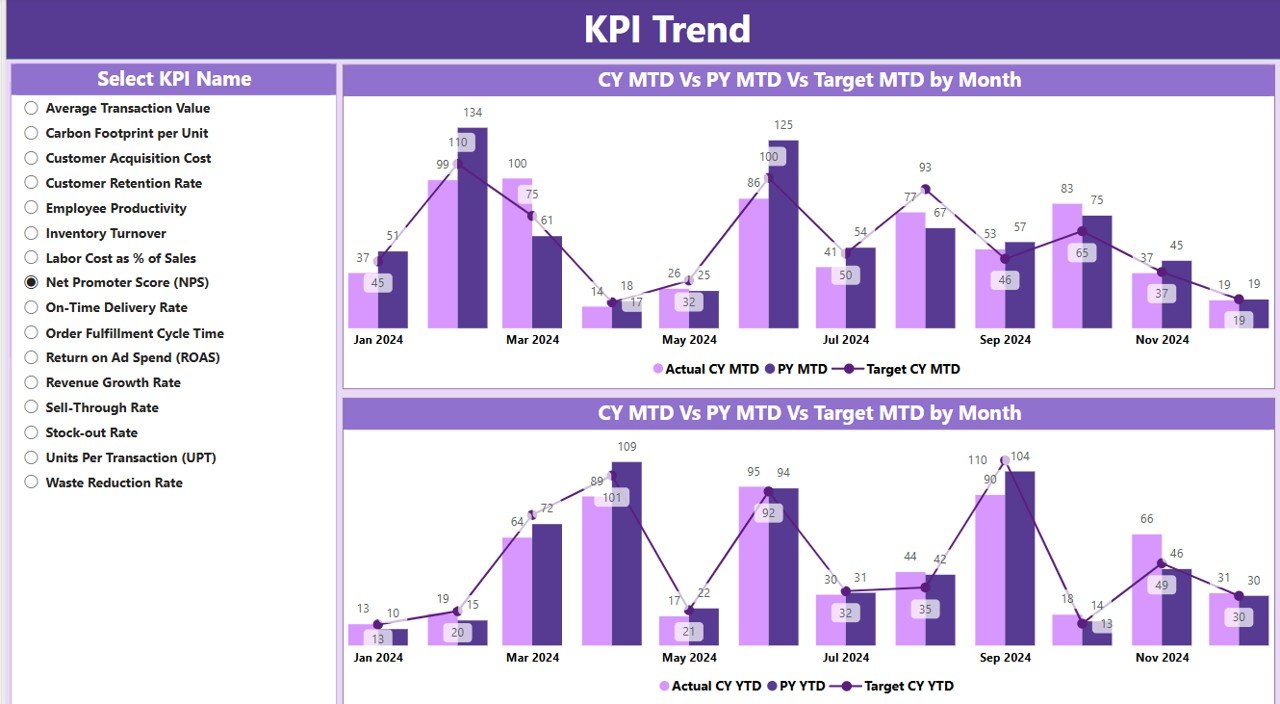
4️⃣ Analyze Trends & Data: Use time-based analysis to track performance trends and adjust strategies.
5️⃣ Optimize Your Fashion Business: Make data-driven decisions to optimize sales, marketing, inventory, and customer service.
Who Can Benefit from the Fashion KPI Dashboard in Power BI?
🔹 Fashion Retailers & Brands
🔹 E-commerce Fashion Stores
🔹 Inventory & Supply Chain Managers
🔹 Fashion Product Managers
🔹 Marketing & Sales Teams
🔹 Business Owners & Executives in the Fashion Industry
🔹 Retail Analytics Professionals
Optimize your fashion business with the Fashion KPI Dashboard in Power BI. Track your sales, inventory, customer behavior, and profitability all in one place and make informed decisions to drive success.
Click here to read the Detailed blog post
Visit our YouTube channel to learn step-by-step video tutorials
Youtube.com/@PKAnExcelExpert


Reviews
There are no reviews yet.