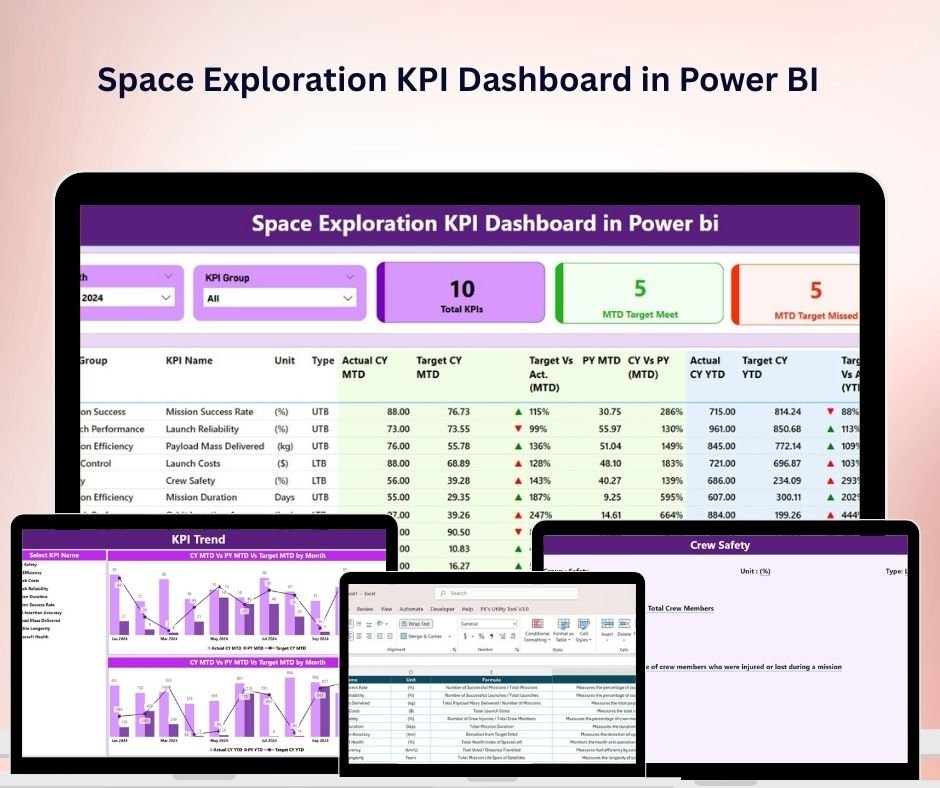


The Space Exploration KPI Dashboard in Power BI is an advanced tool designed to help space agencies, analysts, and enthusiasts track and analyze the performance of space missions with precision. This dynamic dashboard provides a comprehensive, real-time view of mission-critical metrics, empowering users to make data-driven decisions and efficiently manage space mission performance.
With the increasing complexity and scale of space missions, the need for a robust tool to track mission performance has never been more important. This Power BI-based KPI dashboard consolidates key performance indicators (KPIs) in one centralized location, enabling users to easily monitor the success and progress of various space exploration activities.
Key Features of the Space Exploration KPI Dashboard:
🛰️ Comprehensive Overview:
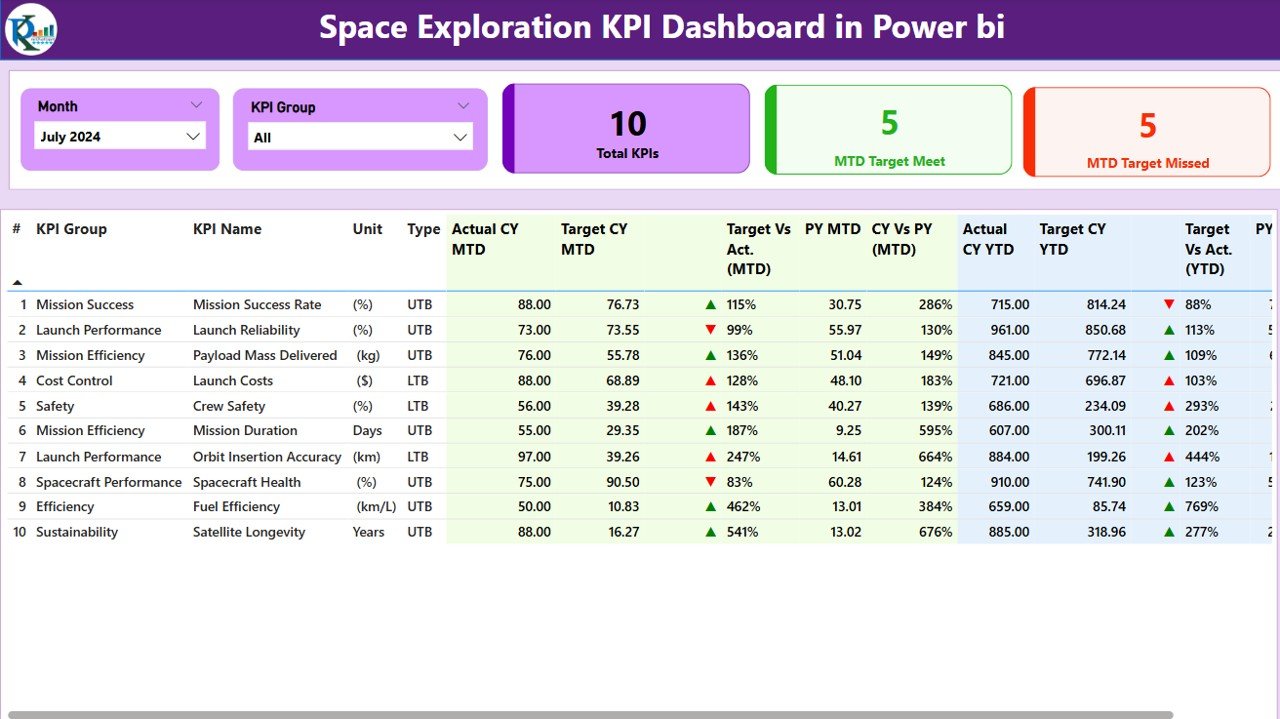
The Summary Page of the dashboard provides a quick snapshot of all key performance indicators related to space missions. It includes high-level metrics such as mission success rates, resource utilization, cost efficiency, and overall mission progress. This page serves as the primary interface, offering interactive filters that allow users to drill down into specific mission types, time periods, or KPI groups for more detailed analysis.
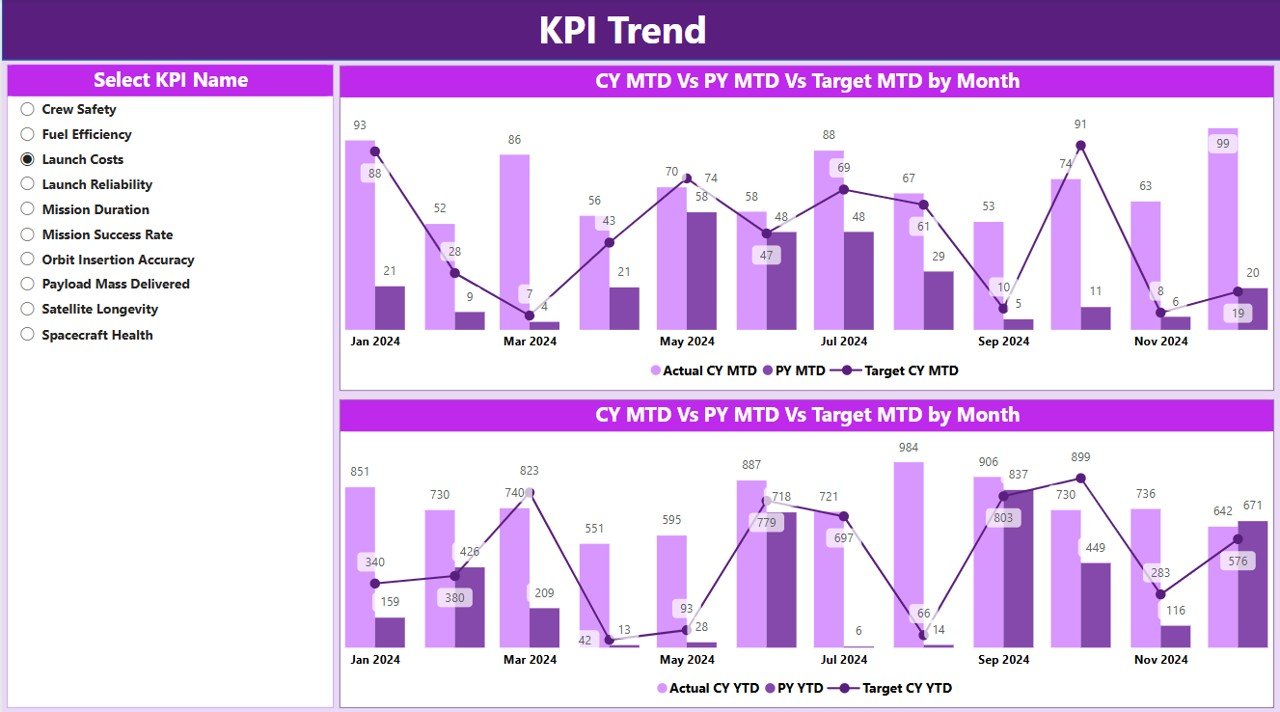
📈 KPI Trend Analysis:
One of the standout features of the dashboard is the KPI Trend Page, which visualizes performance trends over time. This feature allows users to track changes in key metrics, helping to identify areas of improvement, monitor ongoing mission performance, and ensure that objectives are being met. It offers graphical representations such as line charts, bar charts, and trend lines for easy interpretation.
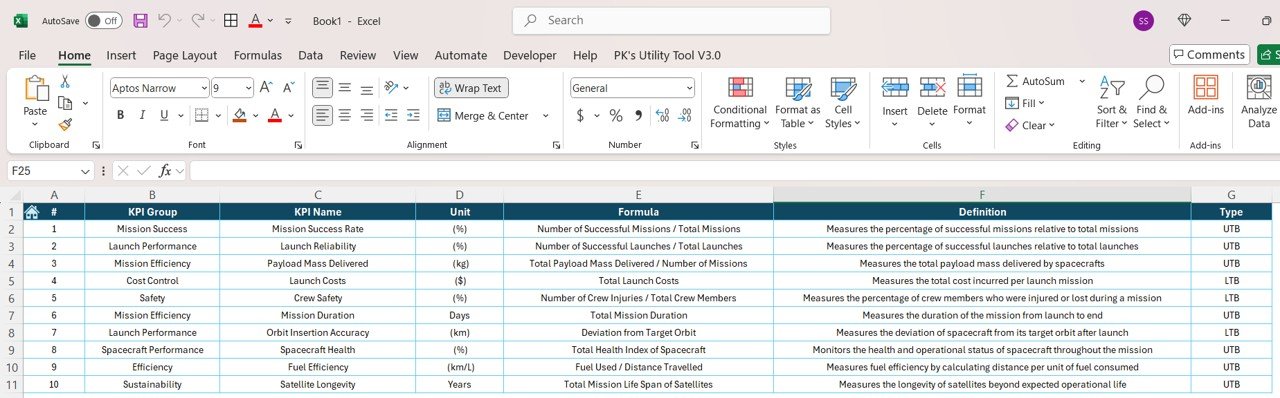
📚 KPI Definitions for Clarity:
The KPI Definition Page provides clear and concise descriptions of each KPI included in the dashboard. Whether it’s mission success rates, satellite performance, resource efficiency, or astronaut safety, each metric is thoroughly explained to ensure users fully understand its relevance. This feature ensures consistency in how KPIs are measured and reported, making the dashboard highly valuable for both new and experienced users.
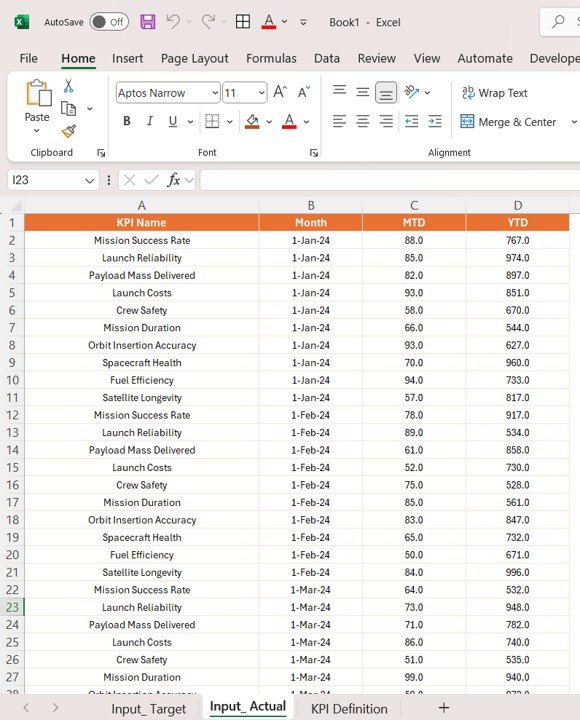
📊 Excel Data Integration:
For those who rely on Excel as a primary data source, the dashboard allows seamless integration with Excel files, enabling users to easily import and update mission data. This ensures that data remains consistent across various sources, and any changes made in Excel are automatically reflected in the Power BI dashboard. This feature is particularly useful for space agencies and researchers who frequently update and maintain large datasets.
Why You’ll Love This Space Exploration KPI Dashboard:
🔍 Real-Time Insights:
Stay up-to-date with live mission performance data and trends, allowing for timely interventions and course corrections when necessary.
💡 Informed Decision Making:
By consolidating critical KPIs in one dashboard, users can make informed, data-driven decisions about mission progress, resource allocation, and potential improvements.
📅 Historical Performance Tracking:
Track mission performance over time with year-on-year comparisons, identifying long-term trends and providing insights into mission success or challenges.
⚙️ Customization and Flexibility:
Tailor the dashboard to suit your specific needs by adjusting the data inputs, KPIs tracked, and visualizations displayed. The dashboard’s customizable nature ensures it aligns with the unique requirements of each space mission or project.
🎯 Optimized for Mission Management:
With clear, actionable insights, the dashboard empowers space mission managers, scientists, and analysts to optimize resources, ensure mission objectives are met, and mitigate potential risks before they impact the mission.
How to Use the Space Exploration KPI Dashboard in Power BI:
1️⃣ Download the Dashboard Template:
Instantly access the dashboard template through your Power BI account and start integrating your data sources.
2️⃣ Customize Your KPIs:
Tailor the dashboard to focus on the KPIs most relevant to your space exploration objectives. Whether it’s rocket launch success, satellite performance, or astronaut safety, you can set up your KPIs accordingly.
3️⃣ Integrate Data from Excel:
Import your mission data directly from Excel into Power BI, ensuring that the dashboard always reflects the most up-to-date information.
4️⃣ Monitor Performance:
Use the interactive visuals and data filters to monitor mission performance continuously. View trends, compare past and current missions, and identify any performance deviations that need attention.
5️⃣ Make Data-Driven Decisions:
Leverage the insights from the dashboard to optimize mission strategies, allocate resources efficiently, and address performance issues before they become major obstacles.
Who Can Benefit from This Space Exploration KPI Dashboard?
-
Space Agencies:
Track the progress of various space missions, including satellite launches, crewed missions, and interplanetary exploration projects. -
Mission Control Teams:
Stay informed on the status of key mission metrics, such as resource usage, time management, and technical performance, ensuring smooth operation throughout the mission lifecycle. -
Space Researchers & Analysts:
Analyze mission data in-depth, identify trends, and gain insights that can guide future missions, improving overall mission outcomes. -
Aerospace Engineers:
Monitor and assess the performance of spacecraft, propulsion systems, and other critical technologies in real time, ensuring that all engineering components perform as expected. -
Space Enthusiasts & Educators:
Provide an interactive and educational experience for students and enthusiasts interested in space exploration and technology.
Click here to read detailed blog post
Visit our YouTube channel to learn step-by-step video tutorials


Reviews
There are no reviews yet.