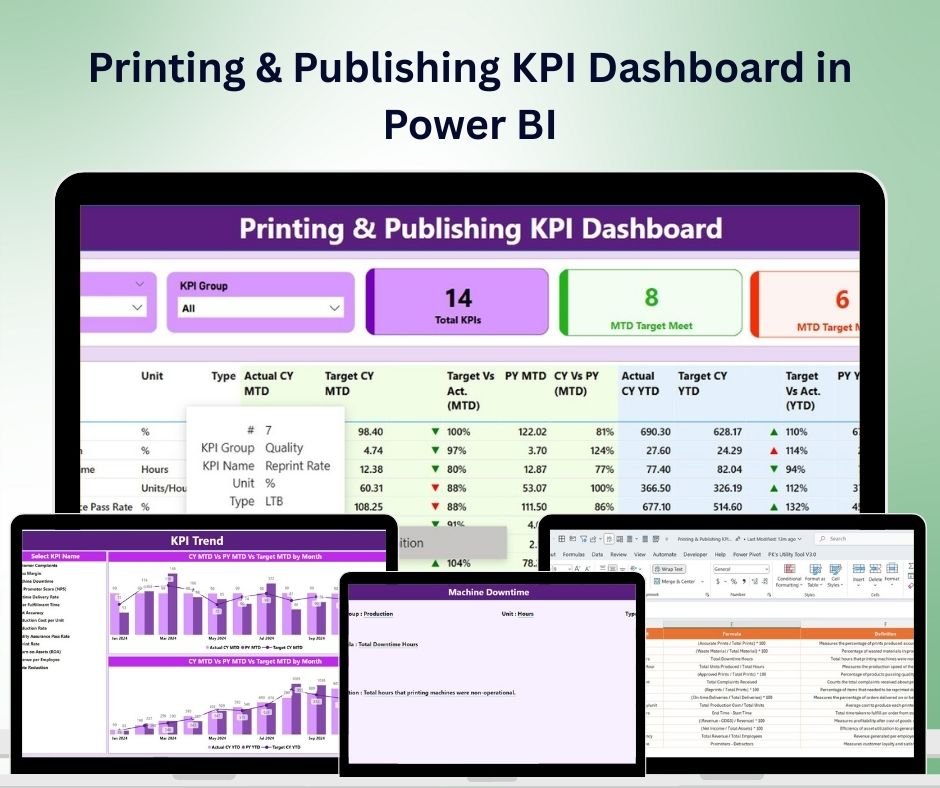

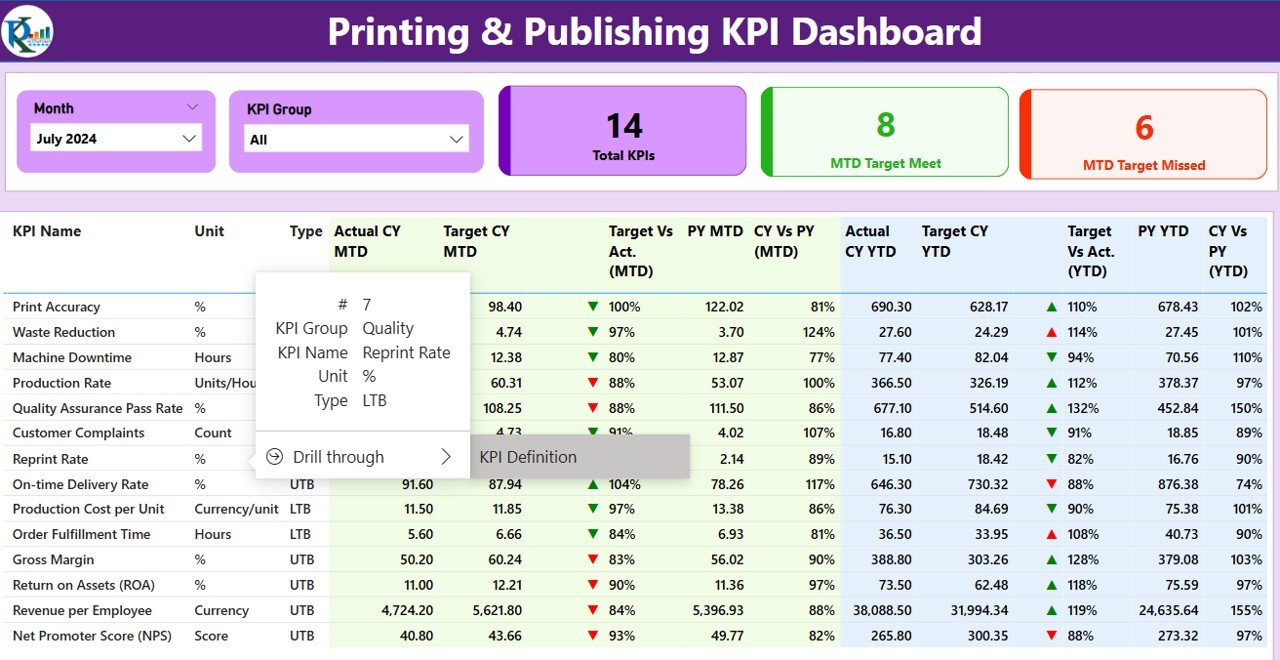
The Printing & Publishing KPI Dashboard in Power BI is a comprehensive tool designed to help businesses in the printing and publishing industry monitor key performance indicators (KPIs) with ease. This Power BI dashboard allows you to track essential metrics like production efficiency, cost per print, sales performance, inventory levels, and customer satisfaction, ensuring that you have real-time insights to optimize operations and drive business growth.
The printing and publishing sector can be complex, with numerous variables impacting profitability, production times, and customer satisfaction. With this KPI dashboard, you can efficiently manage these variables and make informed decisions that lead to improved productivity, reduced costs, and increased profitability.
Key Features of the Printing & Publishing KPI Dashboard in Power BI
📊 Comprehensive KPI Tracking
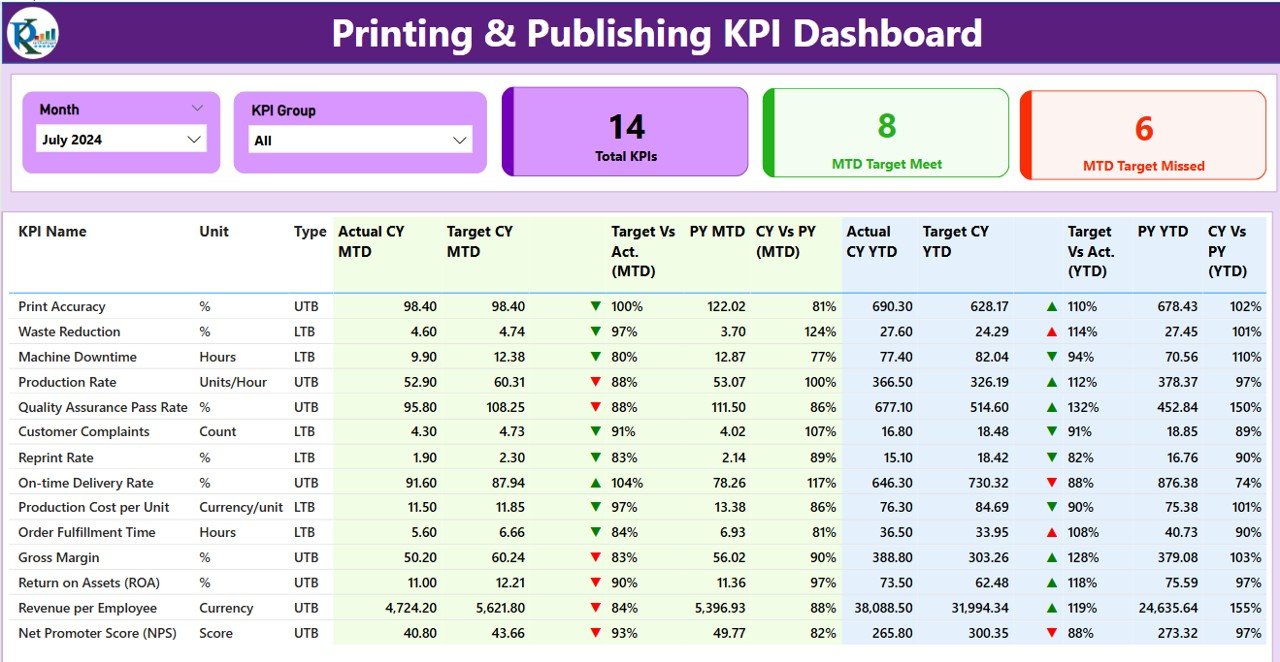
Monitor a wide range of KPIs relevant to the printing and publishing industry, including production efficiency, cost per print, inventory turnover, and more. Keep track of critical business metrics to optimize operations.
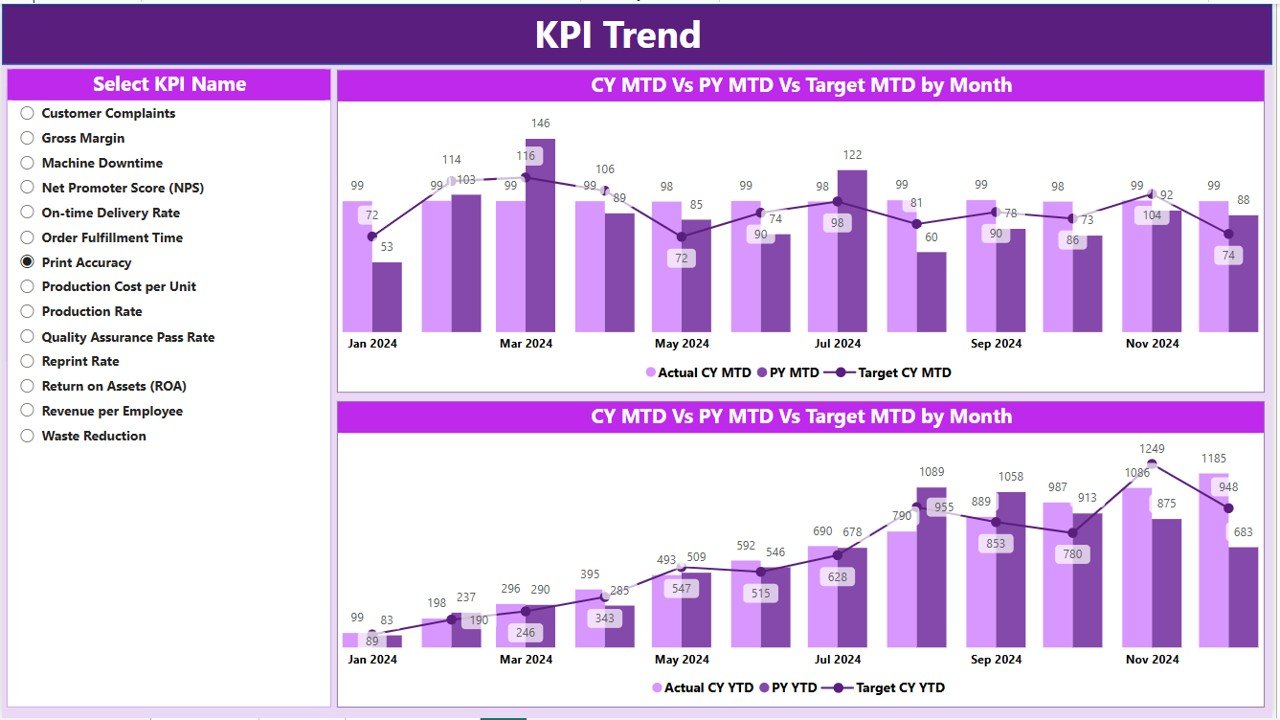
📈 Production Efficiency Monitoring
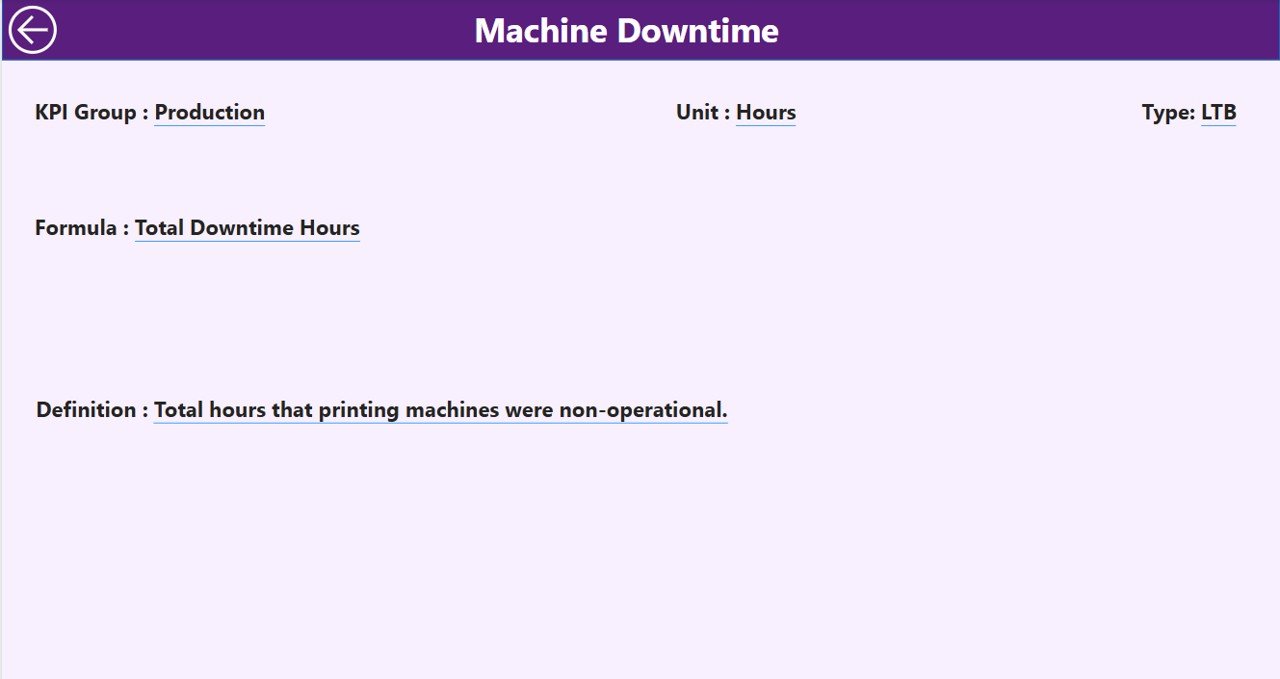
Track the efficiency of your printing operations. Analyze production speed, downtime, and machine performance to identify areas for improvement and ensure optimal output.
💰 Cost Management
Track costs associated with printing, including material costs, labor, and overheads. Identify high-cost areas and optimize resource allocation to reduce overall printing expenses.
📦 Inventory Management
Monitor inventory levels of raw materials, finished goods, and packaging supplies. Maintain an accurate view of inventory in real-time to avoid stockouts and overstock situations.
📉 Sales & Revenue Analysis
Assess sales performance and revenue generation through key metrics like order volume, average order size, and customer acquisition costs. Monitor revenue trends and adjust pricing and marketing strategies as needed.
⚙️ Customizable KPIs & Reports
Tailor the dashboard to fit the unique needs of your printing and publishing business. Customize KPIs, reporting formats, and data visualizations to focus on what matters most to your operations.
Why You’ll Love the Printing & Publishing KPI Dashboard in Power BI
✅ Track and Optimize Production Efficiency
Monitor key production metrics to identify bottlenecks and optimize workflow for better operational efficiency.
✅ Reduce Costs & Improve Profitability
Keep track of cost per print and resource utilization to minimize expenses and maximize profitability.
✅ Enhance Inventory Management
Maintain real-time visibility into inventory levels and manage your raw materials and finished goods more effectively.
✅ Monitor Sales & Revenue Performance
Track revenue performance, customer acquisition, and sales trends to inform pricing strategies and boost business growth.
✅ Customizable & Scalable
The dashboard is fully customizable and can scale with your business, making it suitable for both small printing shops and large publishing enterprises.
What’s Inside the Printing & Publishing KPI Dashboard in Power BI?
-
Comprehensive KPI Tracking: Monitor production efficiency, costs, and sales metrics.
-
Production Efficiency Monitoring: Track production speeds, downtimes, and machine performance.
-
Cost Management: Manage and track production costs, labor, and material costs.
-
Inventory Management: Monitor raw materials and finished goods inventory levels.
-
Sales & Revenue Analysis: Track sales performance, revenue, and customer acquisition costs.
-
Customizable KPIs & Reports: Customize metrics, reports, and visualizations to fit your needs.
How to Use the Printing & Publishing KPI Dashboard in Power BI
1️⃣ Download the Template: Access the Printing & Publishing KPI Dashboard in Power BI instantly.
2️⃣ Integrate Your Data Sources: Link data from your production, sales, and inventory systems to the dashboard for real-time updates.
3️⃣ Track KPIs & Performance: Monitor key metrics such as production efficiency, cost per print, inventory levels, and revenue.
4️⃣ Analyze & Report on Trends: Use built-in analytics tools to analyze trends and identify opportunities for improvement.
5️⃣ Optimize Operations & Profitability: Leverage the insights to streamline production, reduce costs, and maximize profitability.
Who Can Benefit from the Printing & Publishing KPI Dashboard in Power BI?
🔹 Printing & Publishing Businesses
🔹 Operations & Production Managers
🔹 Supply Chain & Inventory Managers
🔹 Business Owners & Executives
🔹 Financial & Cost Analysts
🔹 Sales & Marketing Teams
🔹 Large Enterprises in the Printing Industry
Enhance your operational efficiency, reduce costs, and improve profitability with the Printing & Publishing KPI Dashboard in Power BI. Monitor key metrics to drive growth and success in your printing and publishing business.
Click here to read the Detailed blog post
Visit our YouTube channel to learn step-by-step video tutorials
Youtube.com/@PKAnExcelExpert


Reviews
There are no reviews yet.