
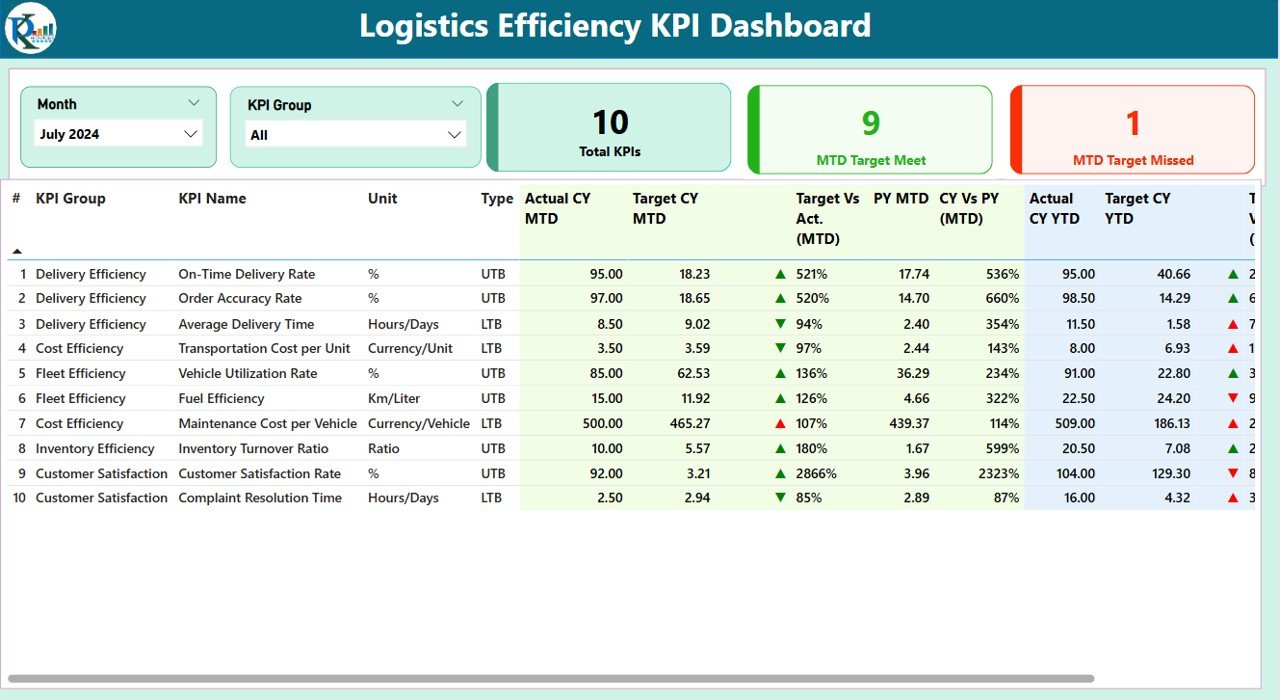
The Logistics Efficiency KPI Dashboard in Power BI is an advanced and interactive tool designed to help logistics managers, supply chain professionals, and business owners monitor and optimize key performance indicators (KPIs) related to logistics operations. This Power BI-based dashboard provides real-time data, enabling businesses to track delivery performance, shipping costs, inventory levels, and much more—all in one place.
This tool is perfect for businesses aiming to reduce operational costs, streamline supply chain management, and improve overall logistics efficiency. By utilizing powerful visualizations and detailed metrics, users can make data-driven decisions to improve delivery times, manage inventory levels effectively, and optimize routes and resources.
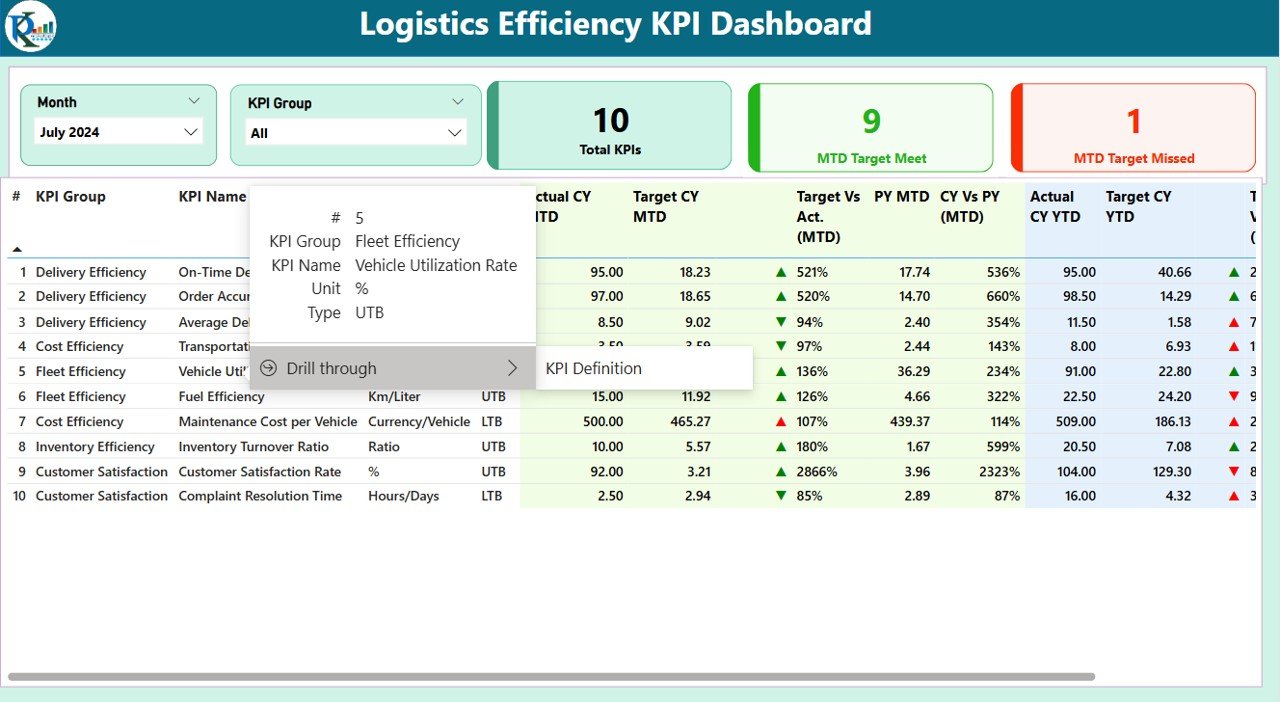
Key Features of the Logistics Efficiency KPI Dashboard in Power BI
📊 Comprehensive KPI Tracking
Track essential KPIs such as order fulfillment rate, shipping cost per unit, on-time delivery, and inventory turnover. Monitor these key metrics in real-time to assess logistics performance and efficiency.
📈 Cost and Profitability Analysis
Monitor logistics costs and profitability by analyzing shipping expenses, warehouse costs, and other operational expenditures. Evaluate how logistics impacts your overall profitability.
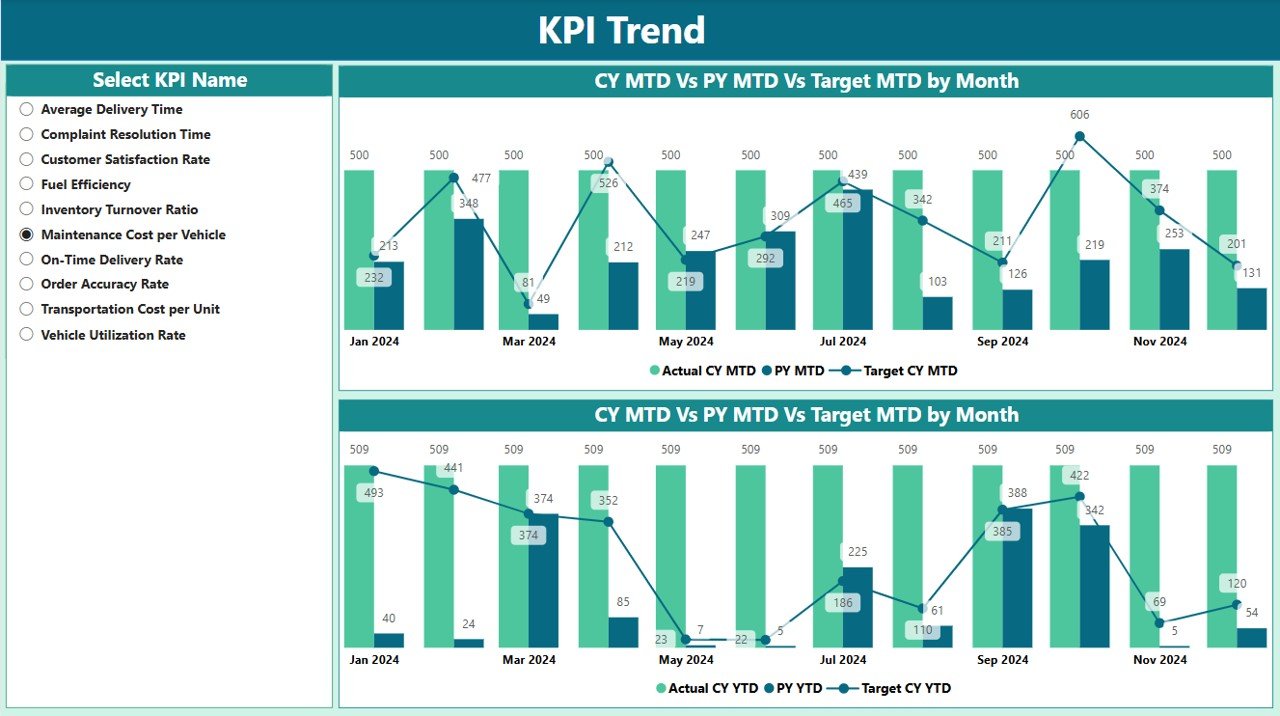
🚚 Delivery Performance Monitoring
Track on-time deliveries, delivery delays, and order fulfillment rates. Assess which routes and delivery processes are most efficient and identify bottlenecks in the system.
📦 Inventory Management Insights
Gain real-time insights into inventory levels, stockouts, and order volumes. Use this information to streamline inventory management and reduce excess stock or stockouts.
⚙️ Route Optimization and Efficiency
Analyze the performance of different routes and delivery methods to optimize transportation efficiency, reduce shipping times, and improve cost-effectiveness.
🔄 Customizable & Scalable Dashboard
Customize the dashboard to track the KPIs that matter most to your business. Whether you’re in retail, manufacturing, or any other industry with logistics needs, this dashboard adapts to your specific requirements.
Why You’ll Love the Logistics Efficiency KPI Dashboard in Power BI
✅ Real-Time Data Integration
Integrate data from various logistics platforms, including inventory systems, shipping carriers, and order management systems. Access real-time data to make informed decisions quickly.
✅ Optimize Operational Costs
Monitor logistics costs and identify areas where expenses can be reduced, ensuring that you’re operating at maximum efficiency while maintaining profitability.
✅ Improve Delivery Times & Reliability
Use delivery performance data to identify delays, optimize routes, and improve on-time delivery rates, ultimately improving customer satisfaction.
✅ Gain Complete Logistics Visibility
Track all logistics activities in one centralized dashboard. Gain comprehensive visibility into your entire logistics operation to make better decisions.
✅ Customizable & Scalable
Tailor the dashboard to meet the unique needs of your business. Whether you’re managing one warehouse or a global logistics network, the dashboard can scale with your needs.
What’s Inside the Logistics Efficiency KPI Dashboard in Power BI?
-
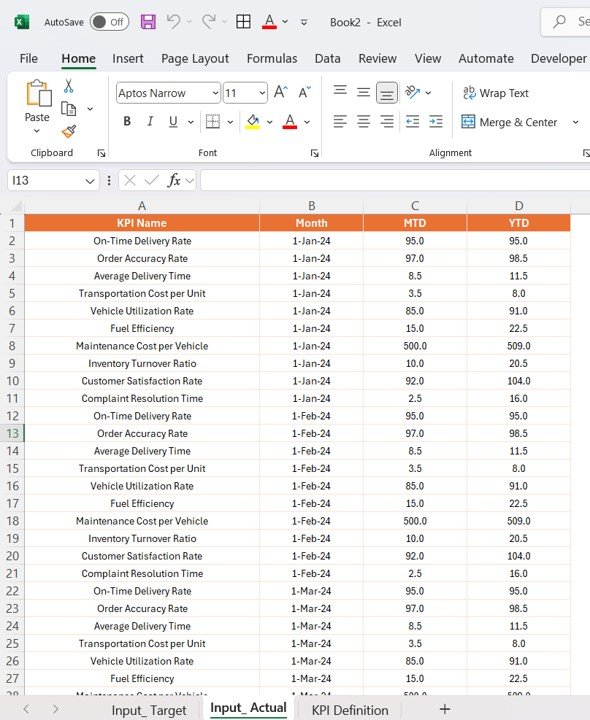
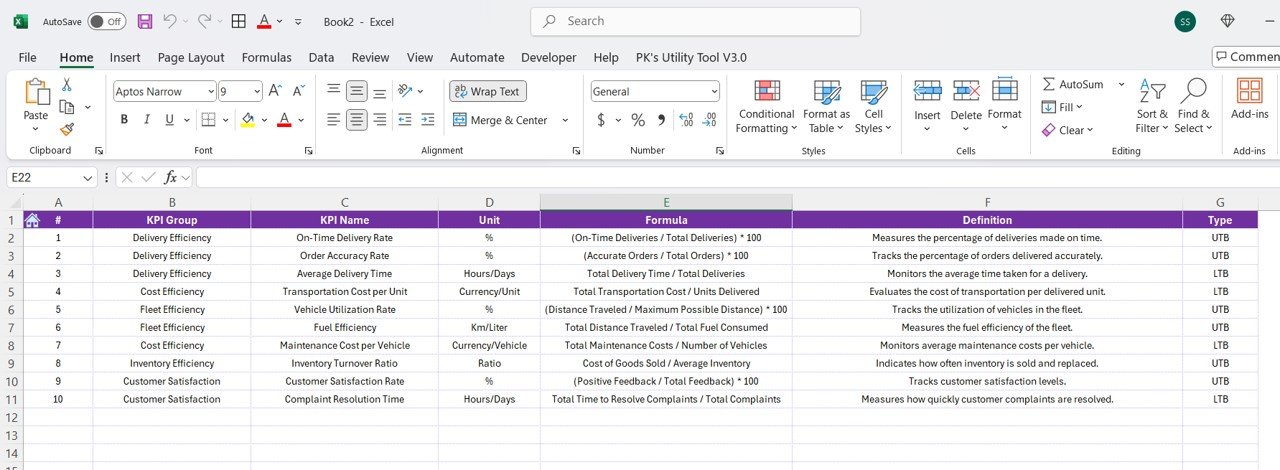
Comprehensive KPI Tracking: Monitor key logistics metrics like order fulfillment rate, shipping cost per unit, and on-time delivery.
-
Cost & Profitability Analysis: Track logistics expenses and profitability metrics.
-
Delivery Performance: Analyze on-time delivery and delays.
-
Inventory Management Insights: Monitor real-time inventory data and trends.
-
Route Optimization: Optimize delivery routes for greater efficiency.
-
Customizable KPIs & Metrics: Tailor the dashboard to your specific needs and goals.
How to Use the Logistics Efficiency KPI Dashboard in Power BI
1️⃣ Download the Template: Access the Logistics Efficiency KPI Dashboard in Power BI instantly.
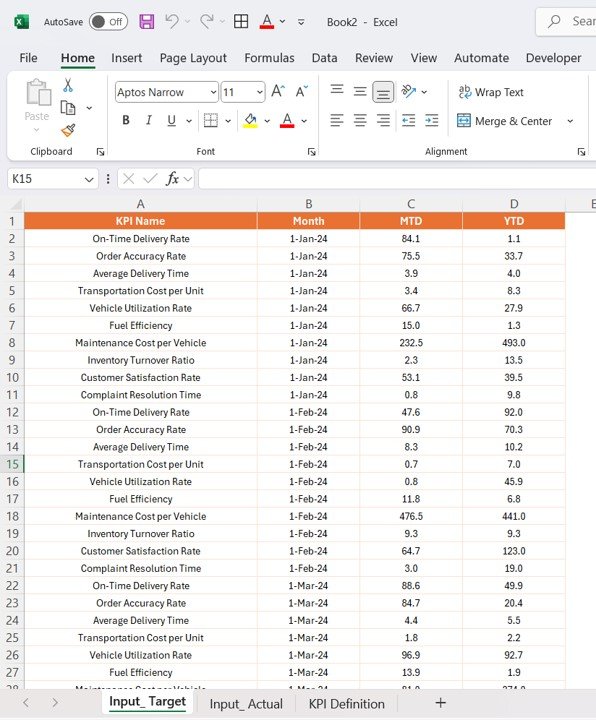
2️⃣ Integrate Your Data: Connect the dashboard to your existing logistics systems, including shipping carriers, inventory systems, and order management tools.
3️⃣ Track KPIs & Metrics: Monitor essential KPIs such as shipping costs, on-time delivery, and inventory levels.
4️⃣ Analyze Data & Identify Trends: Use the dashboard to analyze trends, identify inefficiencies, and optimize logistics processes.
5️⃣ Improve Operational Efficiency: Use insights from the dashboard to make decisions that reduce costs, improve delivery performance, and enhance overall logistics efficiency.
Who Can Benefit from the Logistics Efficiency KPI Dashboard in Power BI?
🔹 Logistics Managers
🔹 Supply Chain Managers
🔹 Warehouse & Inventory Managers
🔹 Operations & Efficiency Teams
🔹 Transportation & Fleet Managers
🔹 Business Owners & Executives
🔹 Retailers & E-commerce Platforms
🔹 Manufacturers with Supply Chain Operations
Optimize your logistics operations with the Logistics Efficiency KPI Dashboard in Power BI. Track performance, reduce costs, and improve delivery times with this powerful tool.
Click here to read the Detailed blog post
Visit our YouTube channel to learn step-by-step video tutorials
Youtube.com/@PKAnExcelExpert


Reviews
There are no reviews yet.