


The Smart Home Industry KPI Dashboard in Power BI is a powerful analytics tool designed to help businesses in the smart home industry track and monitor key performance indicators (KPIs). This dashboard offers insights into product sales, customer satisfaction, energy usage, and system performance—critical metrics for making data-driven decisions that enhance operational efficiency and customer satisfaction.
From smart security systems to energy-efficient devices, this Power BI-based dashboard provides a holistic view of your business’s performance. With real-time data integration, customizable metrics, and visually engaging reports, the dashboard helps organizations in the smart home space optimize operations, boost product sales, and improve service quality.
Key Features of the Smart Home Industry KPI Dashboard in Power BI
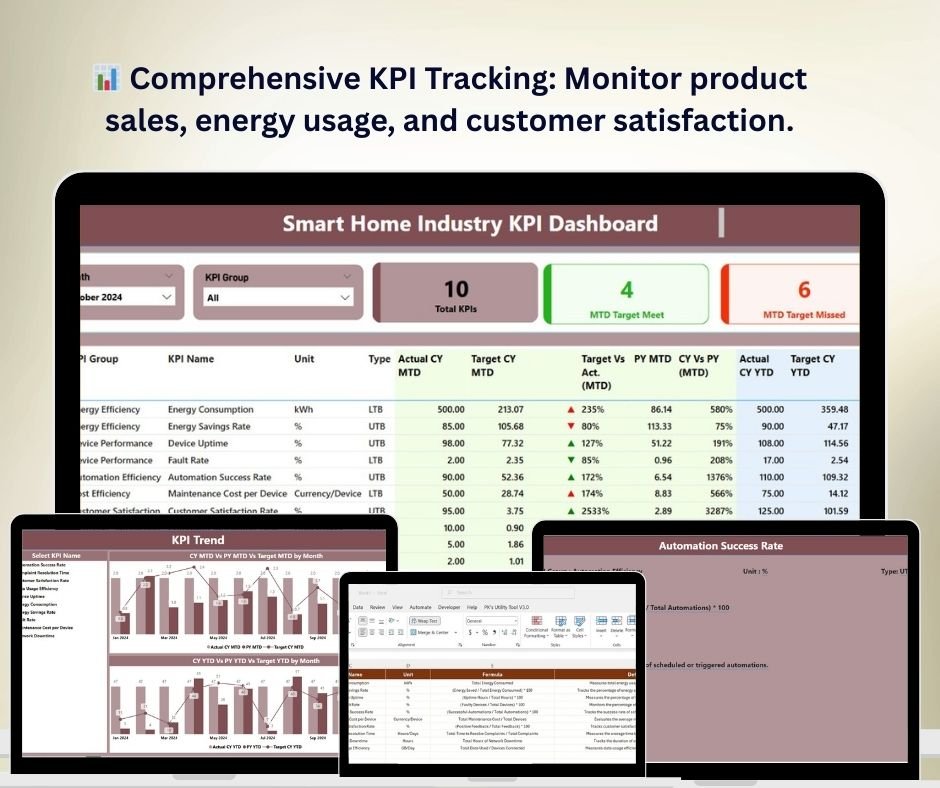
📊 Comprehensive KPI Tracking
Monitor essential KPIs such as sales performance, customer satisfaction, product efficiency, and energy consumption. The dashboard provides a comprehensive view of your smart home business’s performance.
📈 Product Sales Analysis
Track sales data across different product categories such as smart lighting, security systems, and thermostats. Gain valuable insights into the most popular products and emerging trends in the market.
🔋 Energy Usage & Efficiency Monitoring
Analyze energy consumption patterns for smart home devices. Measure the energy savings generated by various smart products and assess how well your devices perform in reducing energy usage.
💡 Customer Satisfaction Insights
Measure customer satisfaction using KPIs such as Net Promoter Score (NPS), customer reviews, and service request response times. Use these insights to improve your products and services.
📅 Time-Based Performance Analysis
Track your KPIs over various time periods (daily, weekly, monthly) and identify trends or seasonal fluctuations in product sales, energy consumption, and customer satisfaction.
⚙️ Customizable & Scalable Dashboard
Customize the dashboard to meet your business’s unique needs. Whether you’re tracking specific product categories or focusing on different performance metrics, this dashboard is flexible and scalable.
🔑 Real-Time Data Integration
Integrate data from different sources like sales platforms, customer feedback systems, and product usage analytics for accurate, real-time performance tracking.
Why You’ll Love the Smart Home Industry KPI Dashboard in Power BI

✅ Gain In-Depth Insights into Smart Home Products
Monitor sales, energy usage, and customer satisfaction to gain a comprehensive view of your smart home business’s performance.
✅ Optimize Product Performance & Sales
Track the performance of different smart home products and identify the best-sellers to inform marketing and sales strategies.
✅ Enhance Customer Experience
Measure customer satisfaction and identify areas for improvement to ensure your customers have a positive experience with your products.
✅ Improve Energy Efficiency
Track energy consumption patterns and evaluate how your smart products are performing in terms of energy savings, helping to promote sustainability.
✅ Customizable & Scalable
The dashboard is fully customizable to meet the specific needs of your smart home business. Tailor the dashboard to focus on the most relevant KPIs and scale it as your business grows.
What’s Inside the Smart Home Industry KPI Dashboard in Power BI?
-
Comprehensive KPI Tracking: Track key metrics such as sales, energy consumption, and customer satisfaction.
-
Product Sales Analysis: Monitor sales data for various smart home products.
-
Energy Usage Monitoring: Track energy consumption and savings from smart products.
-
Customer Satisfaction Insights: Measure customer feedback, NPS, and service performance.
-
Time-Based Performance: Analyze KPIs over different periods to identify trends.
-
Real-Time Data Integration: Integrate real-time data for accurate performance monitoring.
How to Use the Smart Home Industry KPI Dashboard in Power BI
1️⃣ Download the Template: Access the Smart Home Industry KPI Dashboard in Power BI instantly.
2️⃣ Integrate Your Data Sources: Link your sales, product usage, and customer feedback data for real-time insights.
3️⃣ Monitor KPIs & Performance: Track key metrics such as sales, energy usage, and customer satisfaction.
4️⃣ Analyze Trends & Data: Use time-based analysis to track performance trends and optimize your product offerings.
5️⃣ Optimize Business Operations: Use the insights from the dashboard to improve product performance, customer service, and energy efficiency.
Who Can Benefit from the Smart Home Industry KPI Dashboard in Power BI?
🔹 Smart Home Product Manufacturers
🔹 E-commerce & Retailers in the Smart Home Space
🔹 Energy Efficiency Analysts & Engineers
🔹 Customer Service & Support Teams
🔹 Product Managers & Marketing Teams
🔹 Smart Home Business Owners & Executives
🔹 Data Analysts & Business Intelligence Professionals
Take control of your smart home business performance with the Smart Home Industry KPI Dashboard in Power BI. Track sales, energy consumption, and customer satisfaction, and make data-driven decisions that optimize your business operations and customer experience.
Click here to read the Detailed blog post
Visit our YouTube channel to learn step-by-step video tutorials
Youtube.com/@PKAnExcelExpert


Reviews
There are no reviews yet.