



Executive Search & Staffing KPI Dashboard in Power BI Recruitment today isn’t just about intuition — it’s about data-driven intelligence. The Executive Search & Staffing KPI Dashboard in Power BI empowers HR leaders, staffing agencies, and talent-acquisition teams to transform raw hiring data into actionable insights.
This ready-to-use Power BI dashboard consolidates all your recruitment metrics — from time-to-fill and cost-per-hire to candidate conversion and client satisfaction — into one dynamic workspace. Built entirely in Microsoft Power BI, it enables organizations to track recruiter productivity, evaluate performance trends, and optimize hiring efficiency in real time.
Whether you’re managing an in-house talent function or running a staffing agency, this dashboard helps you focus on what truly matters: faster hiring, better candidates, and happier clients.
⚙️ Key Features of the Executive Search & Staffing Dashboard
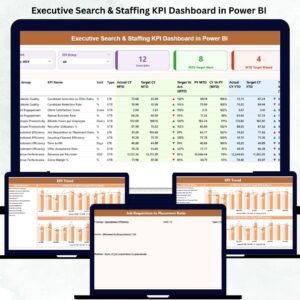
📊 Three Interactive Pages: Summary Page, KPI Trend Page, and KPI Definition Page.
🧭 Easy Navigation: Slicers for Month and KPI Group filter data instantly.
📈 Automated Visuals: Actual vs Target vs Previous Year comparisons for MTD and YTD performance.
📅 Excel Data Source: Connects seamlessly to Excel for real-time updates.
🎯 Dynamic KPI Selection: Drill down to any metric using interactive selectors.
📊 Combo Charts: Dual visuals for trend and target tracking over time.
🔍 Drill-Through Details: Access formulas and definitions via the KPI Definition Page.
📤 Instant Refresh: Click “Refresh” to update metrics without manual effort.
💡 100 % Customizable: Add, remove, or modify KPIs as your business evolves.
💻 No Coding Required: Fully Power BI based — plug in your data and analyze instantly.
📊 What’s Inside the Dashboard
🧾 1️⃣ Summary Page – Central Performance Hub
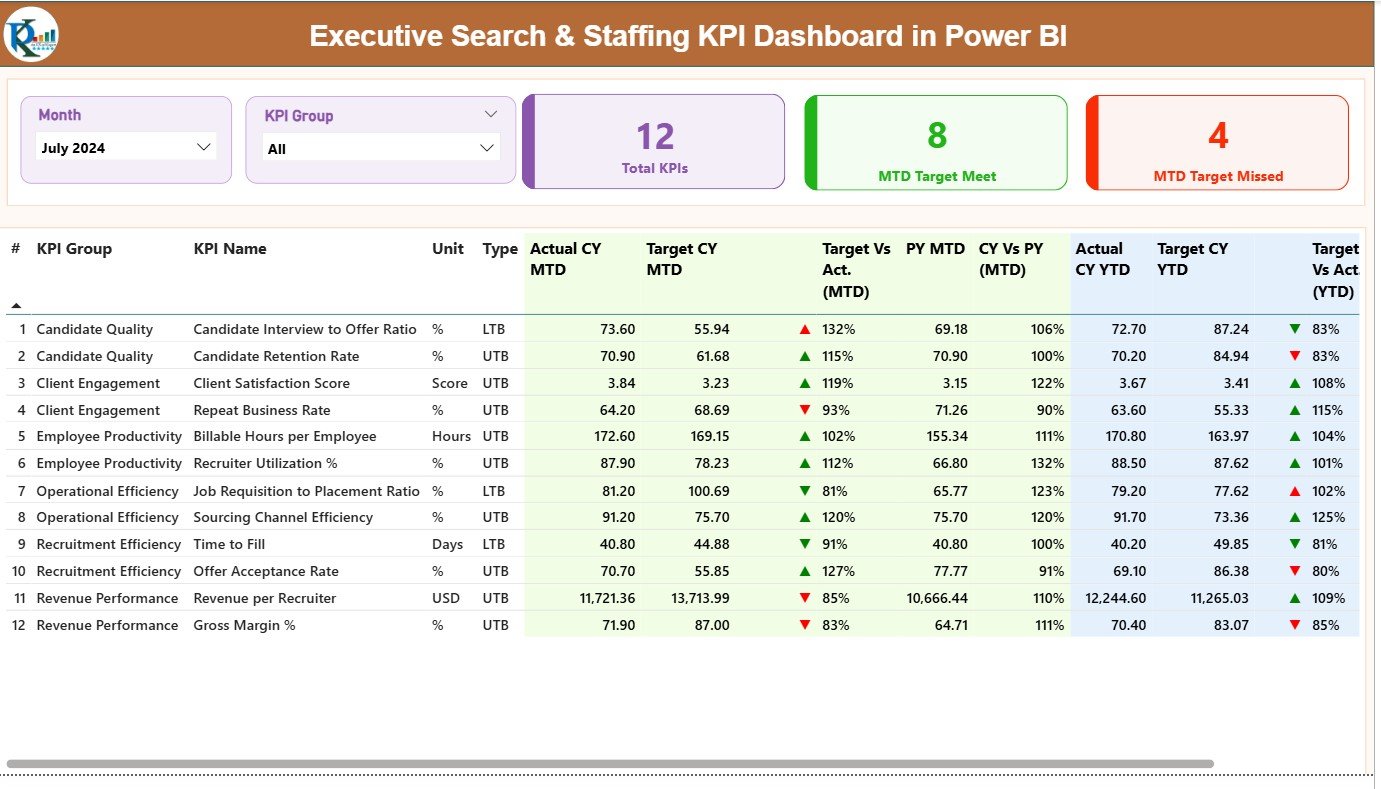
Get a bird’s-eye view of all recruitment KPIs.
Slicers for Month and KPI Group.
KPI Cards showing Total KPIs Count, MTD Target Met, and Missed KPIs.
Visuals to compare actual vs target and track monthly success ratios.
💡 Purpose: See immediately where your team is on track and where it needs attention.
📈 2️⃣ KPI Trend Page – Analyze Progress Over Time
Track month-to-month and year-to-date performance with dual combo charts.
Select any KPI to view its Actual, Target, and Previous Year values.
Identify rising or declining trends for each recruiter or process stage.
📊 Purpose: Spot patterns and make data-driven decisions for continuous improvement.
📘 3️⃣ KPI Definition Page – Reference & Transparency
Understand how each metric is calculated.
Fields include KPI Number, Group, Unit, Formula, and Type (LTB/UTB).
Hidden drill-through page accessible from the Summary sheet.
Includes a “Back” button to return seamlessly.
🧠 Purpose: Ensure clarity and consistency for data audits and stakeholder reviews.
👥 Who Can Benefit from This Dashboard
💼 Recruitment Agencies – Monitor consultant performance and client delivery.
🏢 Corporate HR Teams – Measure time-to-fill and hiring quality across departments.
🎯 Talent Acquisition Leads – Align hiring targets with business growth goals.
📊 Executive Search Firms – Track engagement success and client satisfaction metrics.
💰 Finance Teams – Control cost-per-hire and assess recruitment ROI.
🌟 Advantages of Using the Executive Search & Staffing KPI Dashboard
✅ Real-Time Visibility: Automatic updates ensure you’re always working with current data.
✅ Centralized Data Hub: Eliminate spreadsheet chaos with a single Power BI workspace.
✅ Performance Transparency: Benchmark recruiters and track individual KPIs easily.
✅ Data-Driven Decisions: Visual cues highlight strengths and bottlenecks instantly.
✅ Time Savings: Automated charts replace manual reporting.
✅ Client Reporting Made Easy: Share interactive dashboards for professional presentations.
💡 Best Practices for Effective Use
📌 Assign ownership for each KPI to ensure accountability.
📌 Validate Excel data before refreshing.
📌 Update targets monthly for accurate MTD/YTD insights.
📌 Use consistent color schemes (Green = Met, Red = Missed).
📌 Drill through for detailed definitions when reviewing outliers.
📌 Automate weekly refresh for real-time updates.
🧠 Key KPIs Included
Recruitment Efficiency: Time to Fill, Time to Hire, Offer Acceptance Rate.
Candidate Quality: Qualified Candidates per Opening, First-Year Retention Rate.
Recruiter Productivity: Positions Filled per Recruiter, Submissions per Hire.
Client Satisfaction: Feedback Score, Repeat Business Rate, Revenue per Client.
Financial Performance: Cost per Hire, Recruitment ROI, Billing Margin (%).
🧩 Conclusion
The Executive Search & Staffing KPI Dashboard in Power BI is a complete performance-management solution for modern recruitment. By transforming hiring data into visual insights, it empowers decision-makers to optimize recruiter productivity, shorten hiring cycles, and improve client satisfaction.
Whether you’re running a boutique staffing firm or managing enterprise-level hiring operations, this Power BI dashboard gives you the clarity, control, and competitive advantage you need to lead with confidence.

























Reviews
There are no reviews yet.