In today’s fast-paced business world, measuring employee productivity is not just a good-to-have—it’s essential. Whether you’re an HR manager, team lead, or business owner, you need a simple, powerful way to track how your workforce is performing.Employee Productivity Dashboard in Excel
That’s where the Employee Productivity Dashboard in Excel comes in. It’s a ready-to-use, interactive Excel dashboard designed to help you monitor efficiency, output, and workload distribution without spending a fortune on expensive software.Employee Productivity Dashboard in Excel

🚀 What is the Employee Productivity Dashboard in Excel?
This Excel-based tool consolidates key performance metrics such as:
-
👥 Total Employees
-
⏱️ Average Hours Worked
-
✅ Total Tasks Completed
-
❌ Total Errors Made
-
📊 Efficiency (%)
All this data is transformed into easy-to-read charts and cards, helping you spot performance gaps and identify high achievers instantly.
📊 Key Dashboard Tabs & Features
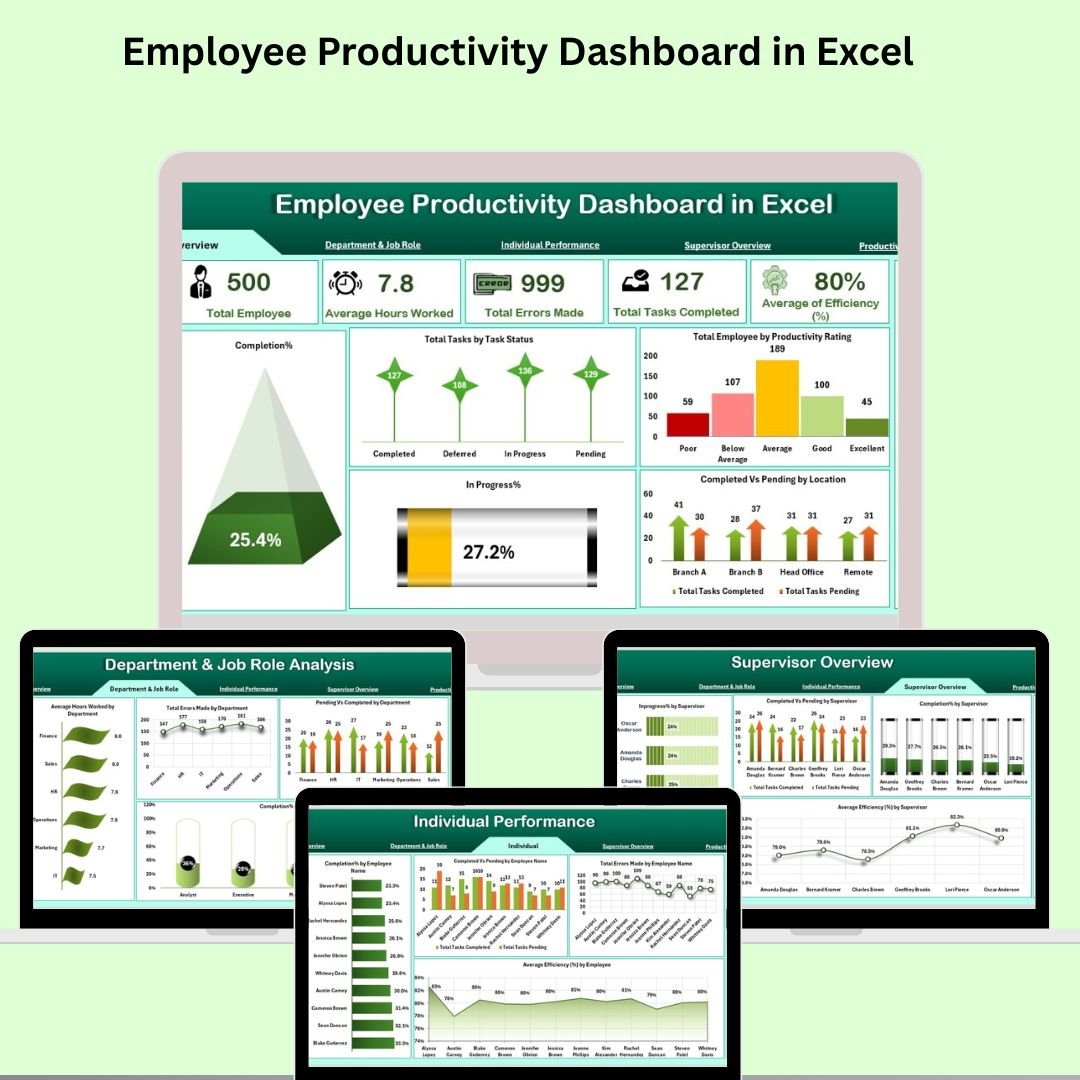
🏠 Overview Sheet Tab
This is your main control panel, featuring:
-
KPI Cards:
📌 Total Employees
⏱️ Avg. Hours Worked
❌ Total Errors Made
✅ Total Tasks Completed
📈 Avg. Efficiency (%) -
Charts:
📊 Completion %
📌 Task Status Breakdown
👥 Employee Count by Productivity Rating
📍 Completed vs Pending by Location
🔄 In Progress %
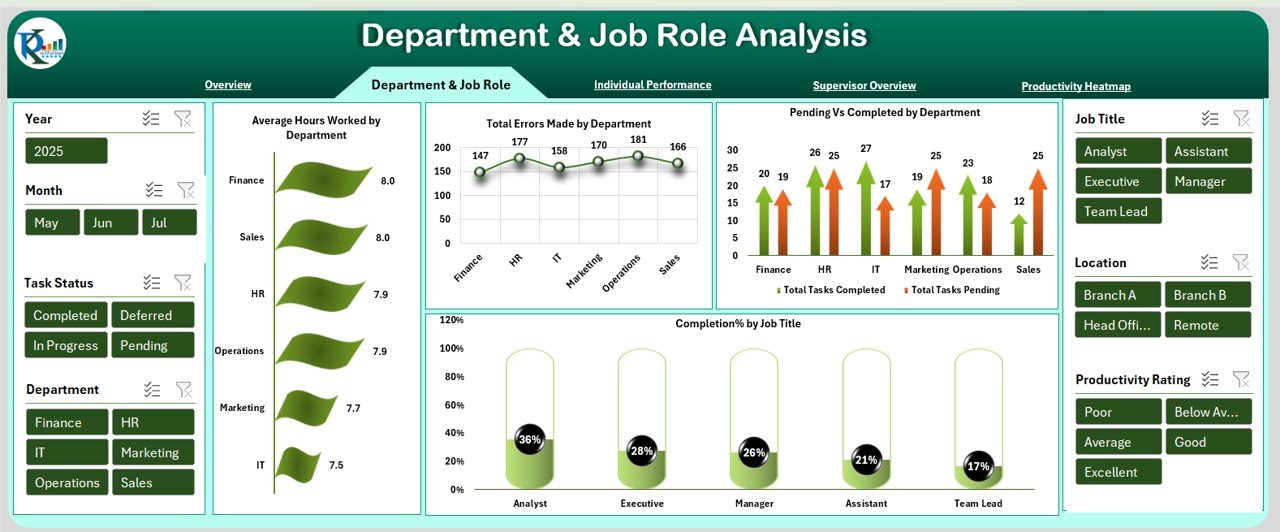
🏢 Department & Job Role Analysis
Dive deep into department-wise performance.
-
🔍 Avg. Hours Worked by Department
-
❌ Errors by Department
-
📊 Pending vs Completed Tasks
-
🧑💼 Completion % by Job Title
Use this tab to understand where interventions may be needed.
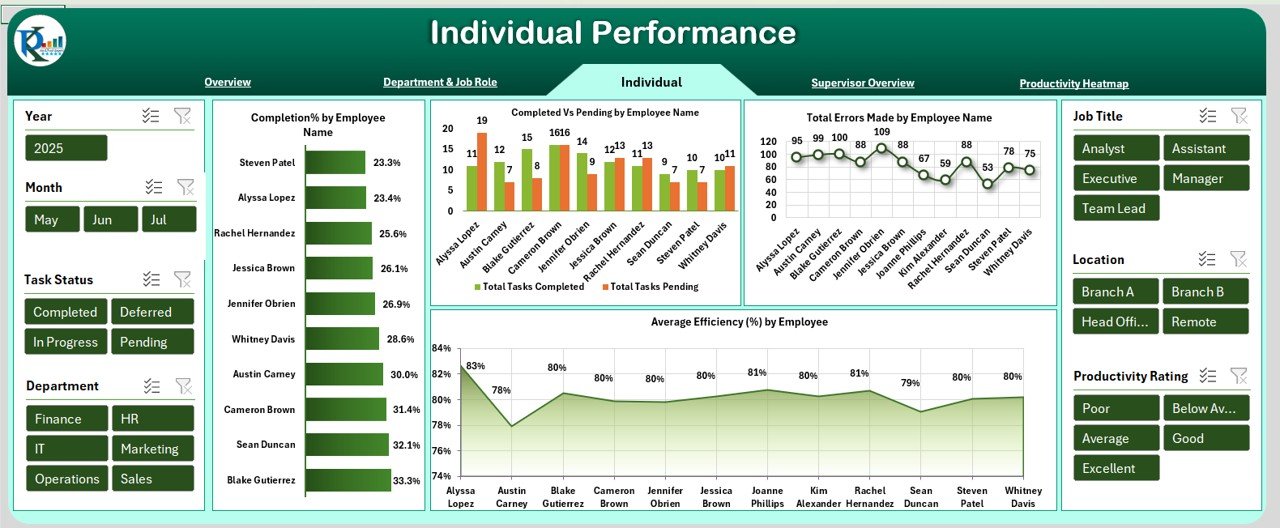
🙋♂️ Individual Performance
Track employee-level performance with charts like:
-
✅ Completion % by Employee
-
🔄 Completed vs Pending Tasks
-
❌ Errors Made
-
📈 Avg. Efficiency %
Perfect for performance reviews and employee feedback sessions.
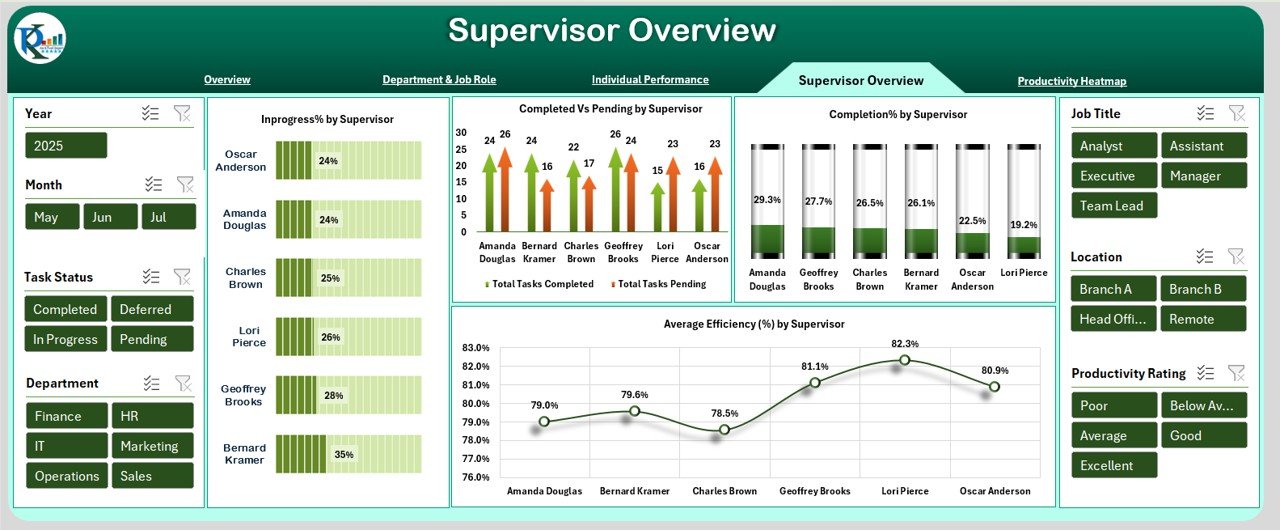
👨💼 Supervisor Overview
Evaluate productivity under different supervisors:
-
🔄 Completed vs Pending by Supervisor
-
📊 Efficiency %
-
🕒 In Progress %
This helps identify coaching opportunities at the managerial level.
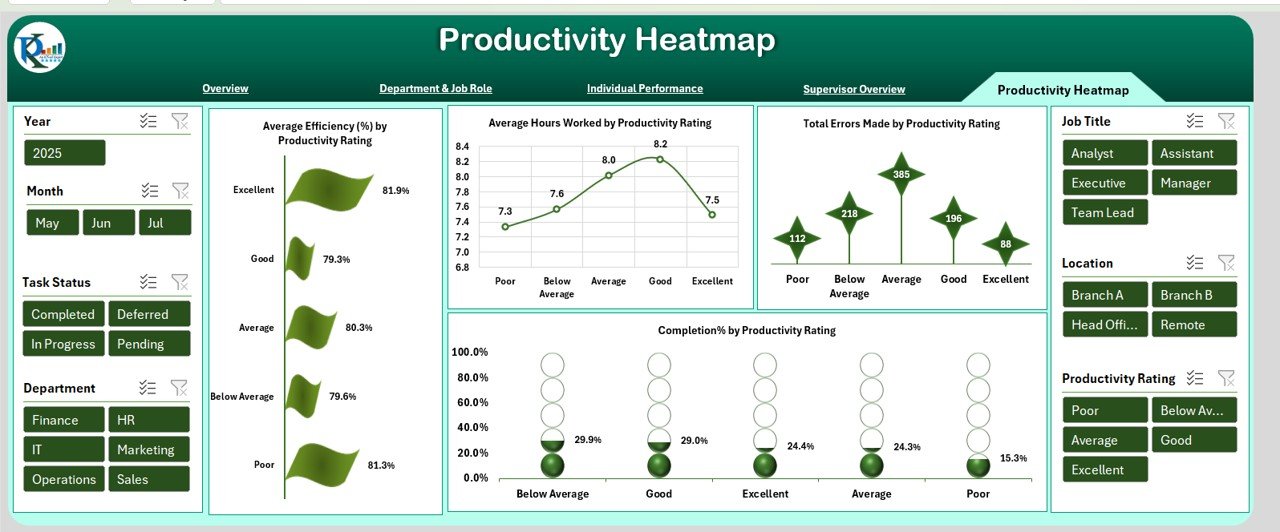
🌡️ Productivity Heatmap
Visualize productivity levels using heatmaps:
-
🔥 Avg. Efficiency by Rating
-
⏱️ Avg. Hours Worked by Rating
-
❌ Errors by Rating
-
📈 Completion % by Rating
Great for spotting patterns and clusters of performance.
🏆 Advantages of Using This Excel Dashboard
✔️ Cost-Effective – No premium software needed
✔️ Fully Editable – Modify KPIs and add metrics
✔️ User-Friendly – Basic Excel skills are enough
✔️ Quick Insights – Save hours on report generation
✔️ Data-Driven Decisions – Make informed management calls
✔️ Scalable – Use for any team size
✔️ Secure – Add password protection or restrict editing
🧠 Best Practices to Maximize Impact
-
🎯 Set clear productivity KPIs
-
📆 Update weekly or bi-weekly for accuracy
-
🔐 Secure sensitive data with protection
-
🧩 Use conditional formatting to flag performance issues
-
📉 Track trends over time for long-term planning
-
🛠️ Automate calculations using Excel formulas and PivotTables
⚙️ Common Use Cases
-
HR departments tracking employee engagement
-
Project managers overseeing task completion
-
Team leaders managing work allocation
-
Executives reviewing performance trends
-
SMEs optimizing workforce productivity
❓ FAQs
Q1. Do I need Excel expertise to use it?
No! It’s designed for beginners with prebuilt formulas and charts.
Q2. Can I add more KPIs?
Yes. Just update the data source and link it to the dashboard.
Q3. Is it mobile-friendly?
Basic viewing is okay on mobile, but desktop offers full interactivity.
Q4. Can I use this for remote teams?
Absolutely. Add a column for work mode and filter as needed.
Q5. How secure is this file?
Use Excel’s protection features to restrict access or editing.
Click here Read the detailed blog post Employee Productivity Dashboard in Excel
🎥 Watch the full tutorial on YouTube
👉 Youtube.com/@PKAnExcelExpert


Reviews
There are no reviews yet.