Running a distillery demands precision. You manage fermentation cycles, monitor yield %, control bottling efficiency, track inventory, and push sales targets — all at the same time. However, when performance data sits in scattered sheets, clarity disappears. Consequently, production gaps go unnoticed, costs rise quietly, and profitability suffers.
That is why we created the Distilleries KPI Dashboard in Excel — a ready-to-use, structured performance monitoring system designed specifically for distillery operations.
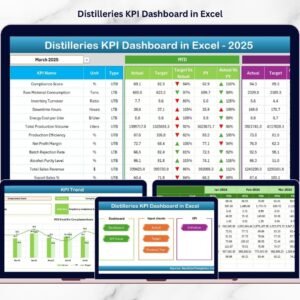
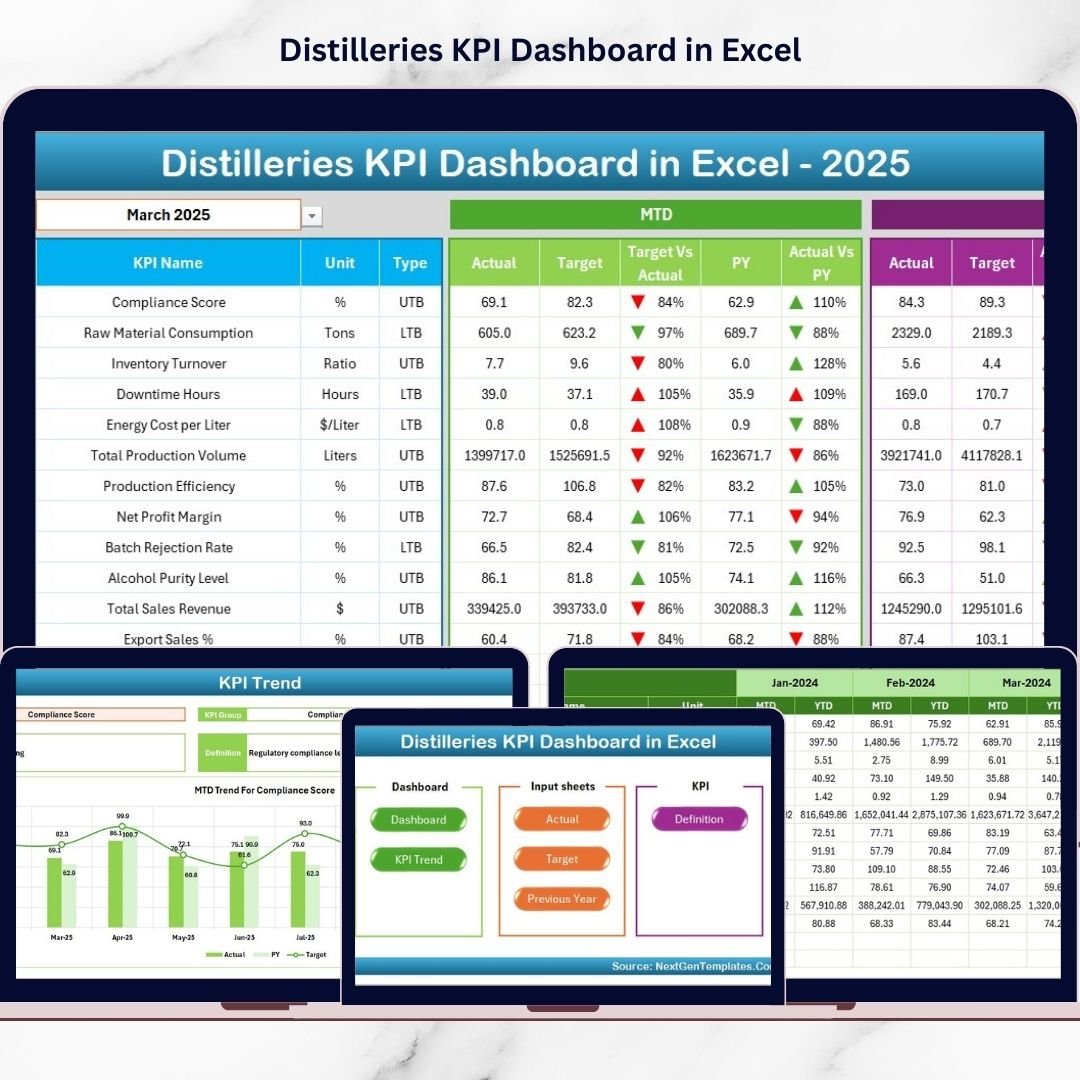
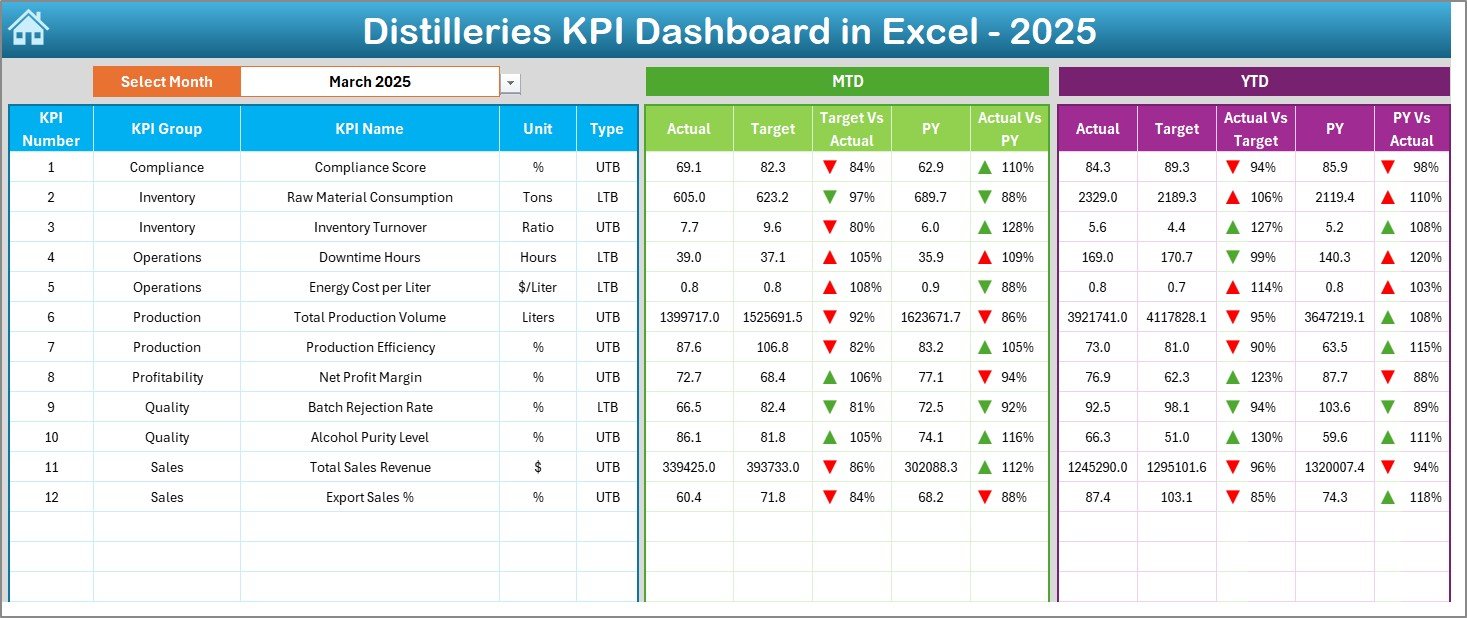
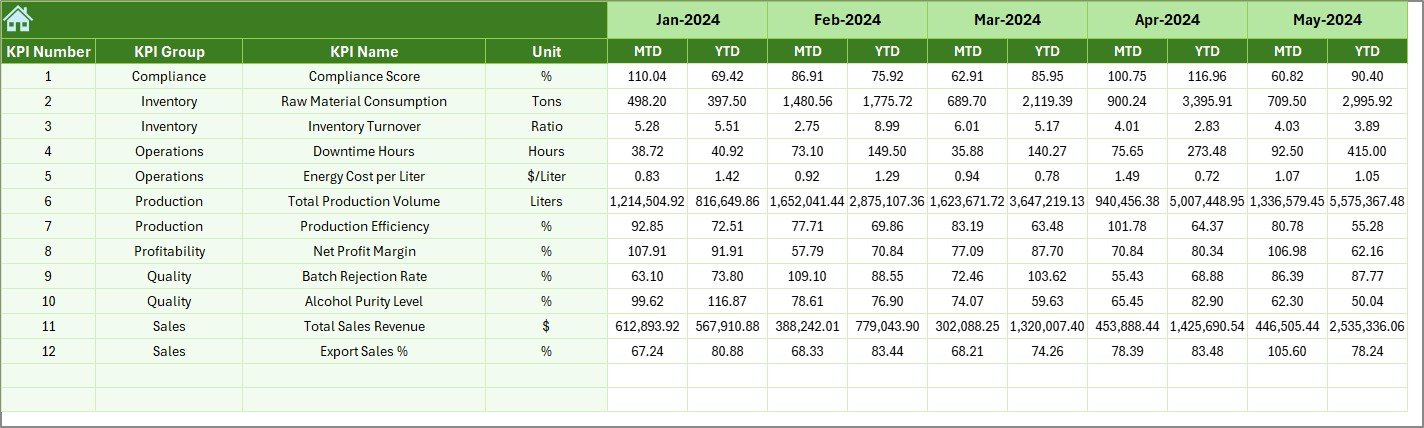
This dashboard centralizes production, quality, financial, inventory, and sales KPIs into one powerful Excel file. As a result, you gain full operational visibility with MTD, YTD, and Previous Year comparisons — all supported by visual indicators and trend charts.
If you want control, consistency, and data-driven decisions in your distillery, this dashboard delivers exactly that.
🚀 Key Feature of Distilleries KPI Dashboard in Excel
This dashboard includes 7 structured worksheets, each designed for a specific purpose.
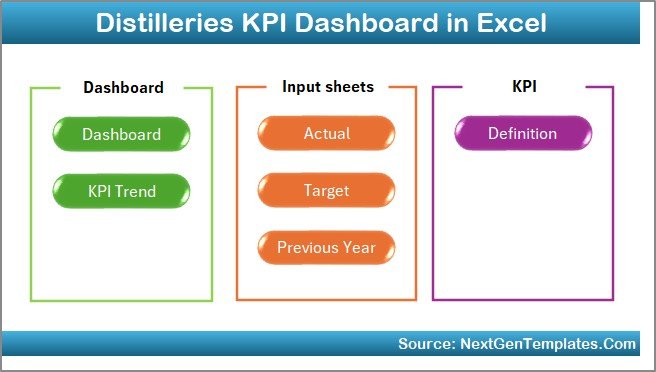
📊 Dashboard Sheet – Complete KPI performance overview
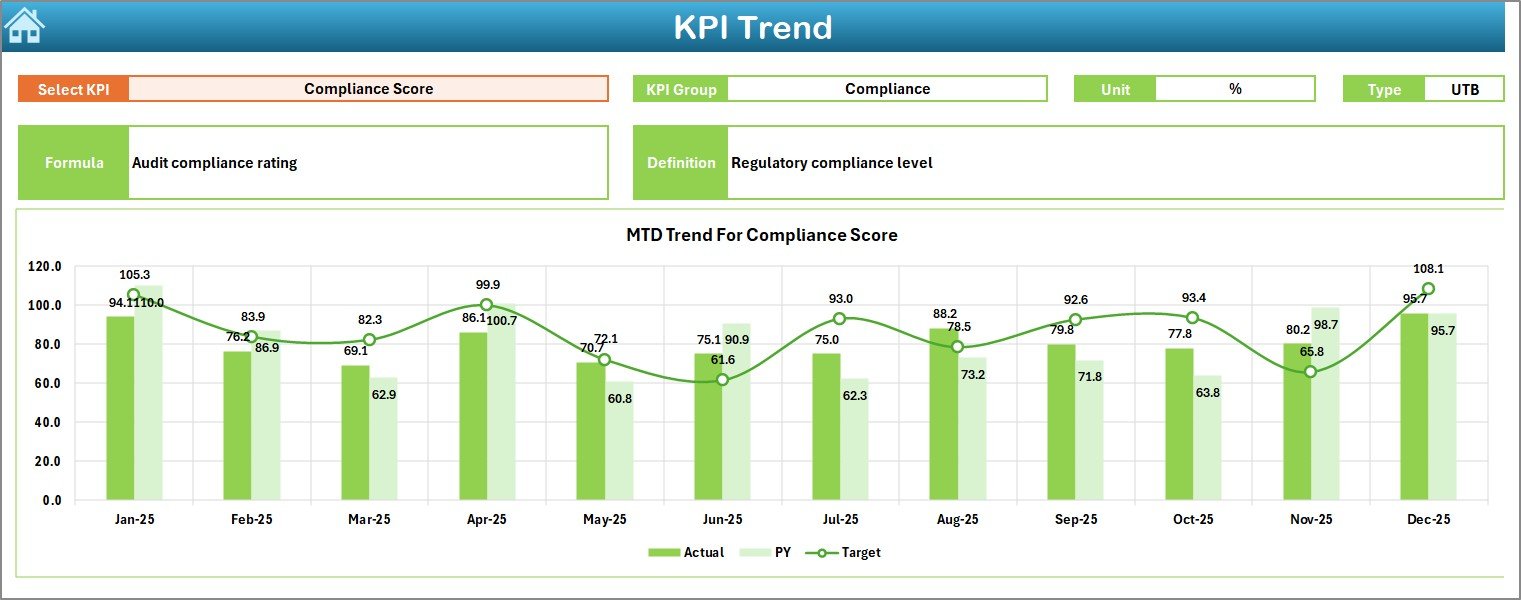
📈 KPI Trend Sheet – Visual trend monitoring (MTD & YTD)
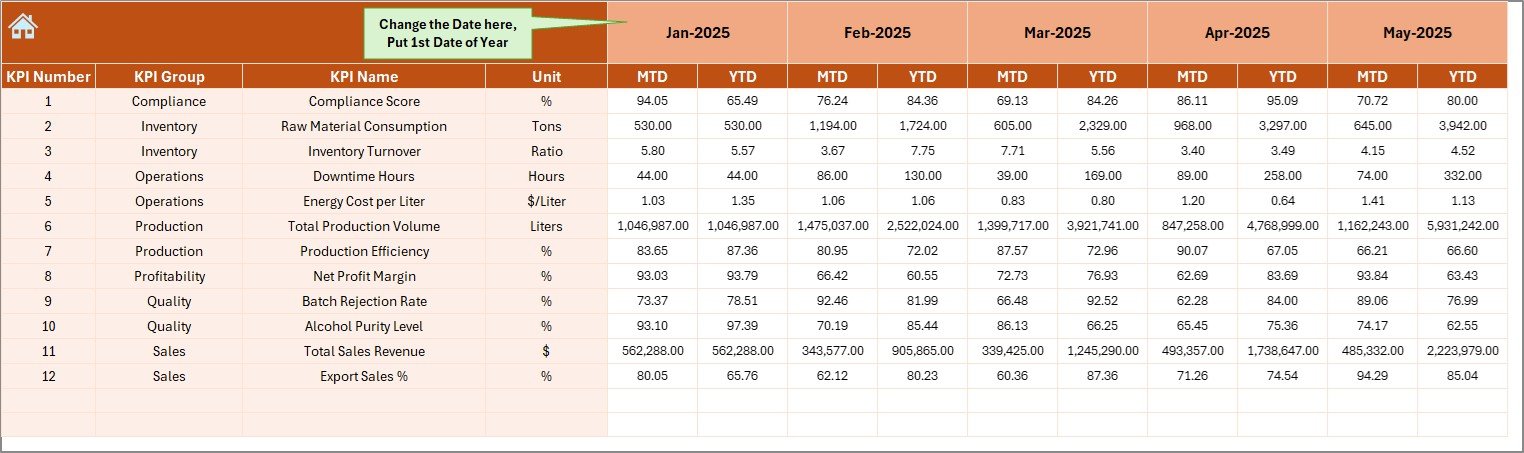
📥 Actual Numbers Input Sheet – Enter real performance data
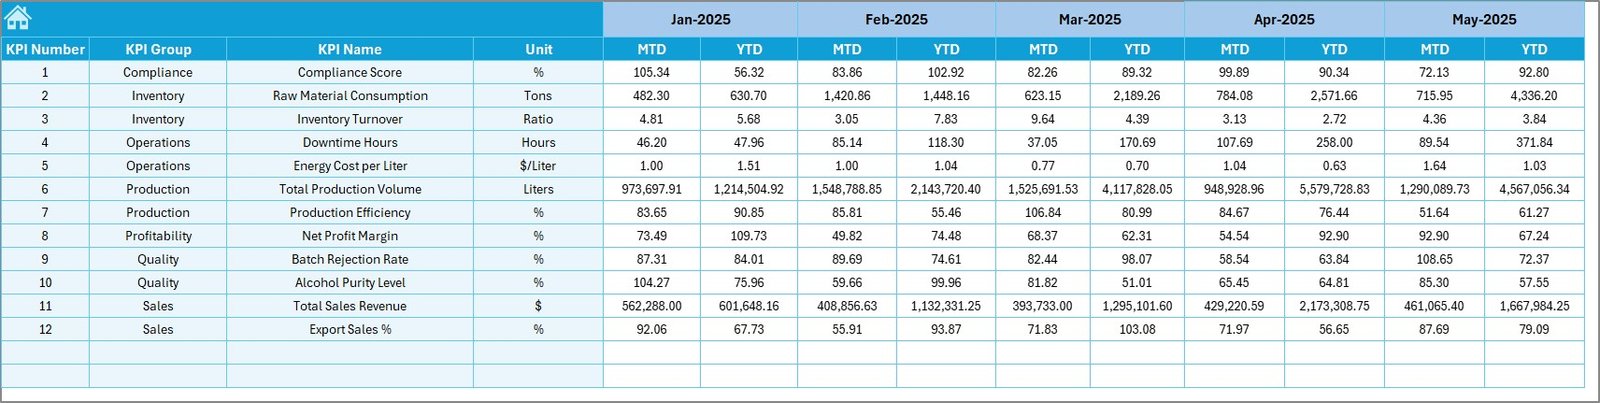
🎯 Target Sheet – Define monthly and yearly goals
📅 Previous Year Sheet – Historical benchmarking
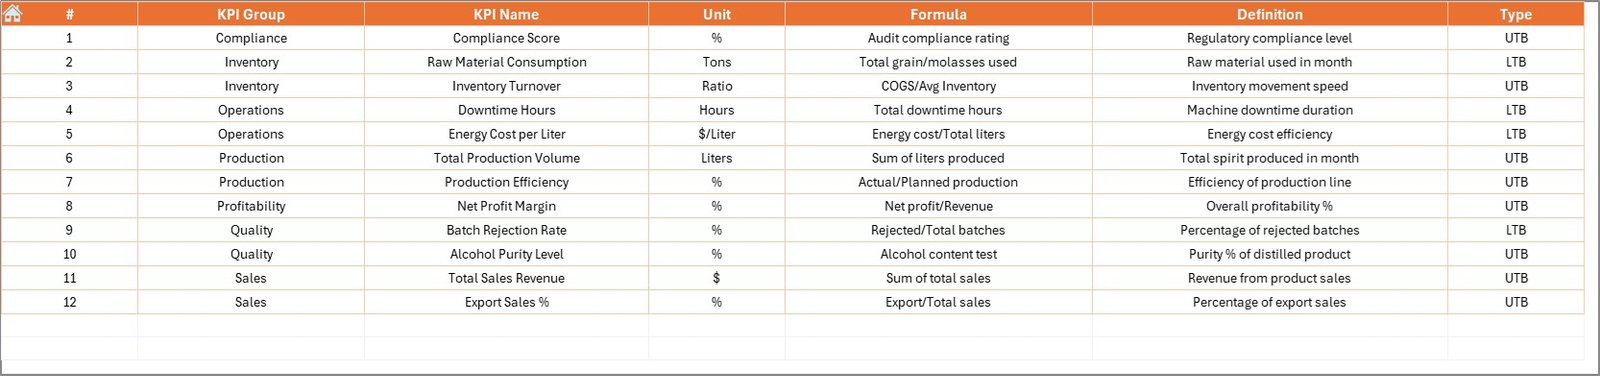
📘 KPI Definition Sheet – Structured KPI logic
🏠 Home Sheet – Easy navigation hub
✨ Powerful Highlights:
Month Selection Drop-Down (Cell D3)
Automatic MTD & YTD Updates
Target vs Actual Comparison
Previous Year Benchmarking
Conditional Formatting with Up/Down Arrows
Fully Customizable KPI Structure
Clean and Professional Layout
Because everything runs inside Excel, implementation is simple and cost-effective.
📦 What’s Inside the Distilleries KPI Dashboard in Excel
This ready-to-use template includes:
✔ 7 Structured Worksheets
✔ MTD (Month-to-Date) Tracking
✔ YTD (Year-to-Date) Tracking
✔ Previous Year Comparisons
✔ Up & Down Performance Indicators
✔ Trend Charts for Each KPI
✔ Structured Data Entry Sheets
✔ Clear KPI Definitions (LTB & UTB)
✔ Fully Editable and Customizable Format
You simply enter actual numbers, set targets, and select a month. The dashboard updates instantly.
🛠 How to Use the Distilleries KPI Dashboard in Excel
Using the dashboard is straightforward:
1️⃣ Define KPIs in the KPI Definition Sheet (Name, Unit, Formula, Type).
2️⃣ Enter Previous Year numbers.
3️⃣ Set Monthly & Yearly Targets.
4️⃣ Input Actual MTD & YTD data.
5️⃣ Select the month from Cell D3.
6️⃣ Review Dashboard and Trend sheets.
7️⃣ Take corrective action based on insights.
For example:
If Yield % drops below target, review fermentation efficiency.
If Cost per Liter rises, analyze raw material usage.
If Sales Volume declines compared to last year, adjust distribution strategy.
Because performance indicators update automatically, decision-making becomes faster and smarter.
👥 Who Can Benefit from This Distilleries KPI Dashboard?
This dashboard is ideal for:
🥃 Distillery Owners
🏭 Production Managers
🧪 Quality Control Teams
💰 Finance Managers
📦 Inventory Managers
📊 Sales & Distribution Heads
Whether you run a small craft distillery or a large-scale production plant, this tool supports structured performance monitoring.
📊 What KPIs Can You Track?
You can monitor critical distillery metrics such as:
Production KPIs
Total Production Volume
Yield %
Distillation Efficiency
Batch Completion Rate
Quality KPIs
Alcohol Purity Level
Rejection Rate (LTB)
Compliance Score
Financial KPIs
Cost per Liter
Revenue per Batch
Gross Margin
Inventory KPIs
Raw Material Usage
Finished Goods Inventory
Inventory Turnover
Sales KPIs
Monthly Sales Volume
Sales Growth %
Distributor Dispatch Rate
By tracking these KPIs consistently, you improve operational control and profitability.
💡 How This Dashboard Improves Decision-Making
When you use this dashboard regularly:
You detect underperforming KPIs quickly
You reduce production losses
You control cost overruns
You optimize yield and efficiency
You improve margin planning
You eliminate guesswork
Instead of reacting late, you respond early — backed by structured data.
Click here to read the Detailed blog post
Visit our YouTube channel to learn step-by-step video tutorials