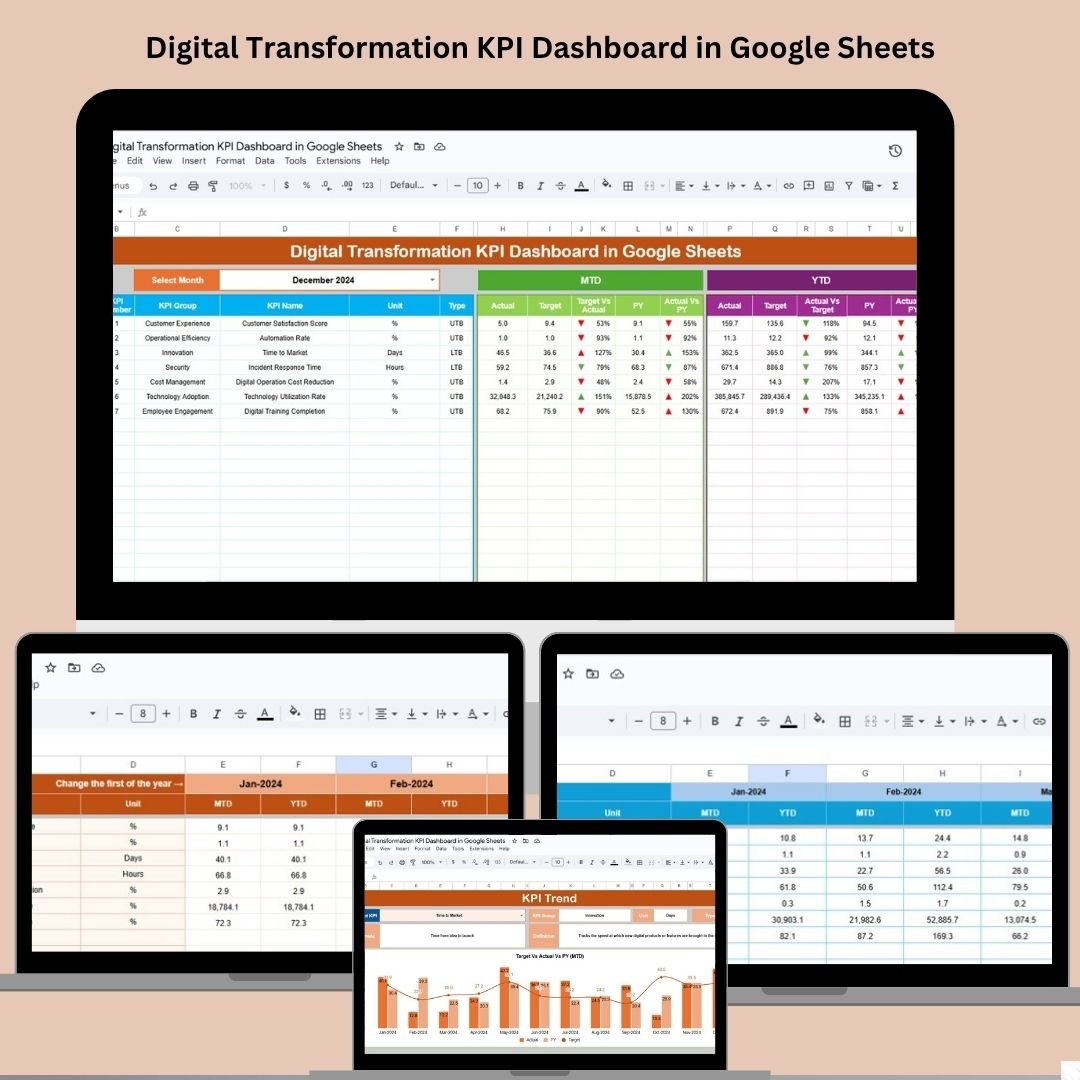
In a world driven by technology, digital transformation is no longer optional—it’s essential. To ensure that your initiatives are on track and delivering value, you need real-time insights into performance. That’s where the Digital Transformation KPI Dashboard in Google Sheets steps in. This fully interactive, ready-to-use dashboard helps you monitor, measure, and manage the key metrics driving your digital success.
Whether you’re a digital strategy lead, IT director, or operations head, this dashboard gives you a centralized view of all the KPIs you need—ranging from system adoption rates to customer satisfaction, digital sales, and operational efficiency.

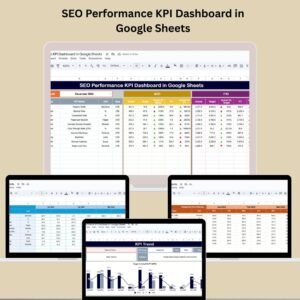
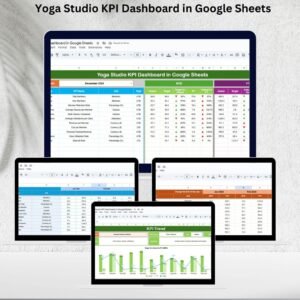
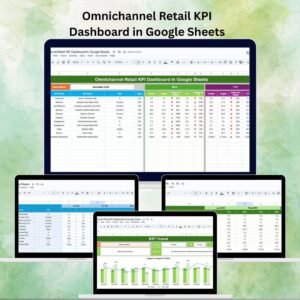
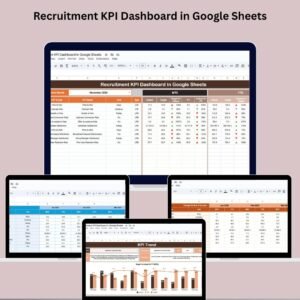
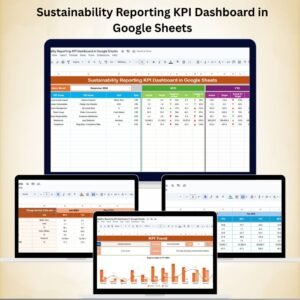
📊 Key Features of the Digital Transformation KPI Dashboard
📍 Dashboard Sheet
-
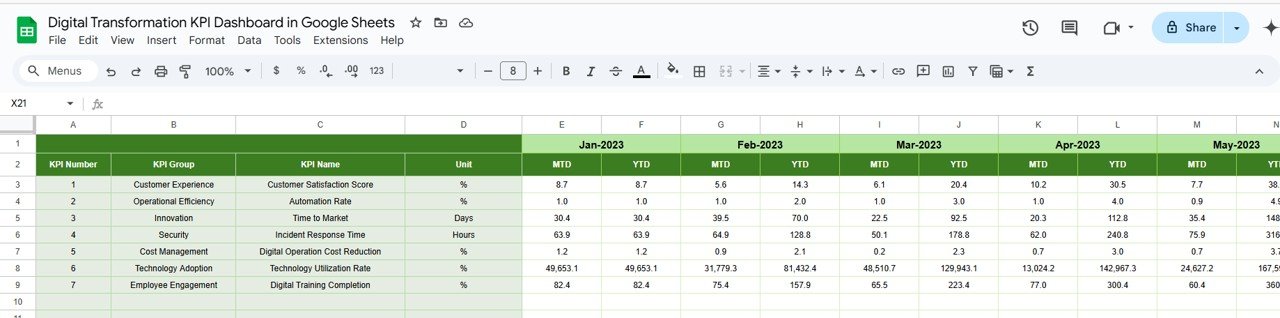
Month Selector (Cell D3): Easily switch between months
-
KPI Cards: MTD Actual, Target, and Previous Year data; YTD Actual, Target, and PY
-
Trend Arrows: Instantly see if KPIs are improving or declining with up/down conditional formatting
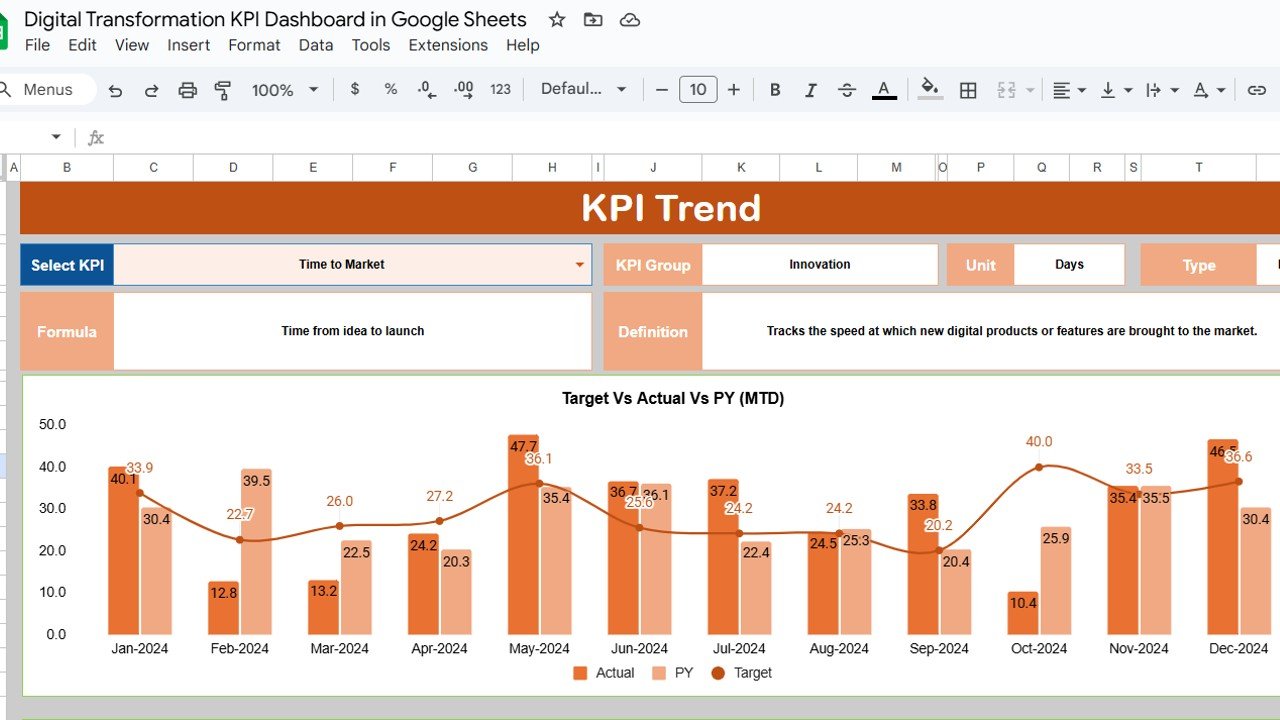
📈 KPI Trend Sheet
-
Dropdown (C3): Select the KPI you want to analyze
-
Trend Line Chart: See how the selected KPI is trending over time
-
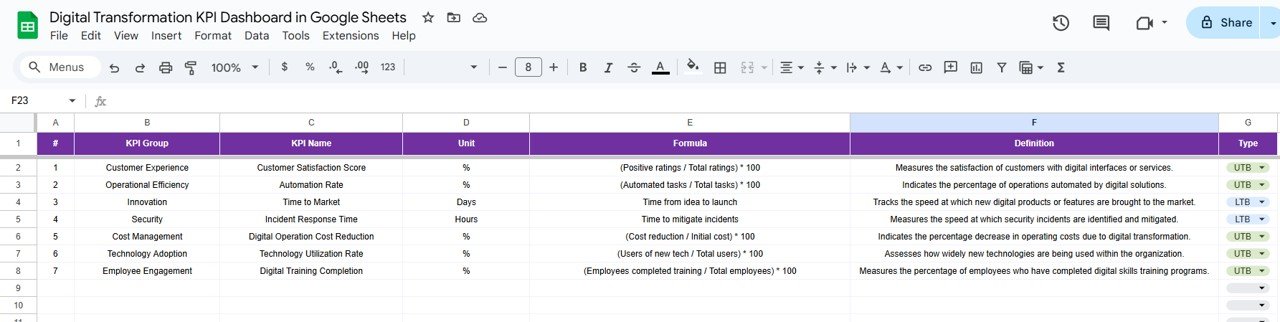
KPI Group, Unit & Type: Understand whether the metric is LTB (Lower the Better) or UTB (Upper the Better)
-
Formula & Definition: Built-in reference to clarify calculation logic
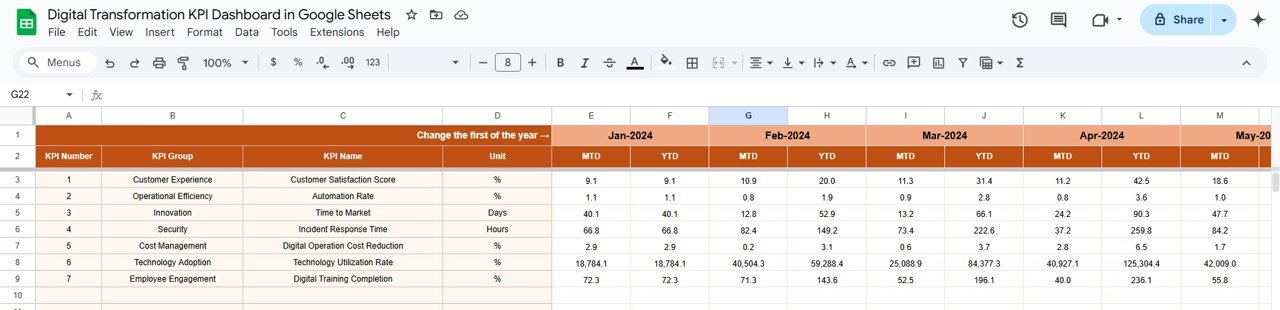
📥 Actual Numbers Sheet
-
Input MTD & YTD Values: Enter current month’s data for each KPI
-
Auto-Refresh Dashboard: Once values are updated, all sheets refresh dynamically
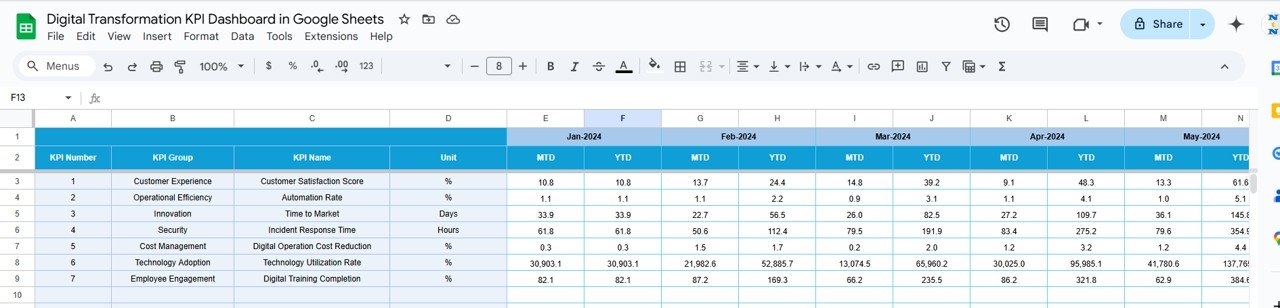
🎯 Target Sheet
-
Set Goals: Enter monthly and YTD targets for each KPI to benchmark performance
🕰️ Previous Year Numbers
-
Historical Tracking: Record previous year’s performance to compare and measure growth
🧾 KPI Definition Sheet
-
Structured KPI List: Includes KPI Name, Group, Unit, Type (LTB/UTB), Formula, and Definition for full transparency
🎯 Advantages of This Dashboard
✅ Comprehensive View: Centralized platform to monitor all digital KPIs
✅ Data-Driven Insights: Helps you make informed strategic decisions
✅ Customizable Layout: Add or remove KPIs as per your digital goals
✅ Interactive Charts: Visual storytelling through trend lines and performance cards
✅ No Coding Required: 100% formula-based – no need for macros or scripts
✅ Collaborative Friendly: Easily share with teams on Google Workspace
✅ Ideal for Any Team: IT, Marketing, HR, and Leadership can all benefit
🔍 Common KPIs Tracked in the Dashboard
-
System Adoption Rate
-
Digital Sales Growth
-
Operational Efficiency Index
-
Customer Satisfaction Score (CSAT)
-
Automation Utilization
-
Digital Process Completion Time
-
Online Engagement Rate
-
Cost Reduction through Digitization
-
Support Ticket Resolution Time
-
Employee Digital Training Completion %
Each KPI includes its type—UTB (Upper the Better) or LTB (Lower the Better)—so your team knows where to focus.
🧠 Who Can Use This Dashboard?
-
🏢 Digital Transformation Teams: Track strategy execution
-
💻 IT Departments: Monitor adoption and tech usage
-
🧑💼 Operations Managers: Evaluate efficiency improvements
-
📊 Executives & CXOs: Make data-driven decisions on digital spend
📌 Best Practices for Using the Dashboard
-
Update Monthly: Keep your data fresh with timely MTD & YTD updates
-
Set Realistic Targets: Align KPIs with business goals
-
Monitor Trends: Use the KPI Trend sheet to identify success/failure patterns
-
Share Across Teams: Encourage transparency in digital performance
-
Customize as Needed: Add new KPIs or modify definitions to suit your organization
🔄 Opportunities for Improvement
-
🔗 Integrate with tools like CRM, ERP, or Finance systems for automated updates
-
📱 Develop a mobile version for leadership on-the-go
-
📉 Add forecasting models to anticipate future performance
-
🌐 Extend cross-department views for 360° tracking
📺 Learn how to use the dashboard on our YouTube Channel:
YouTube.com/@NeotechNavigators


Reviews
There are no reviews yet.