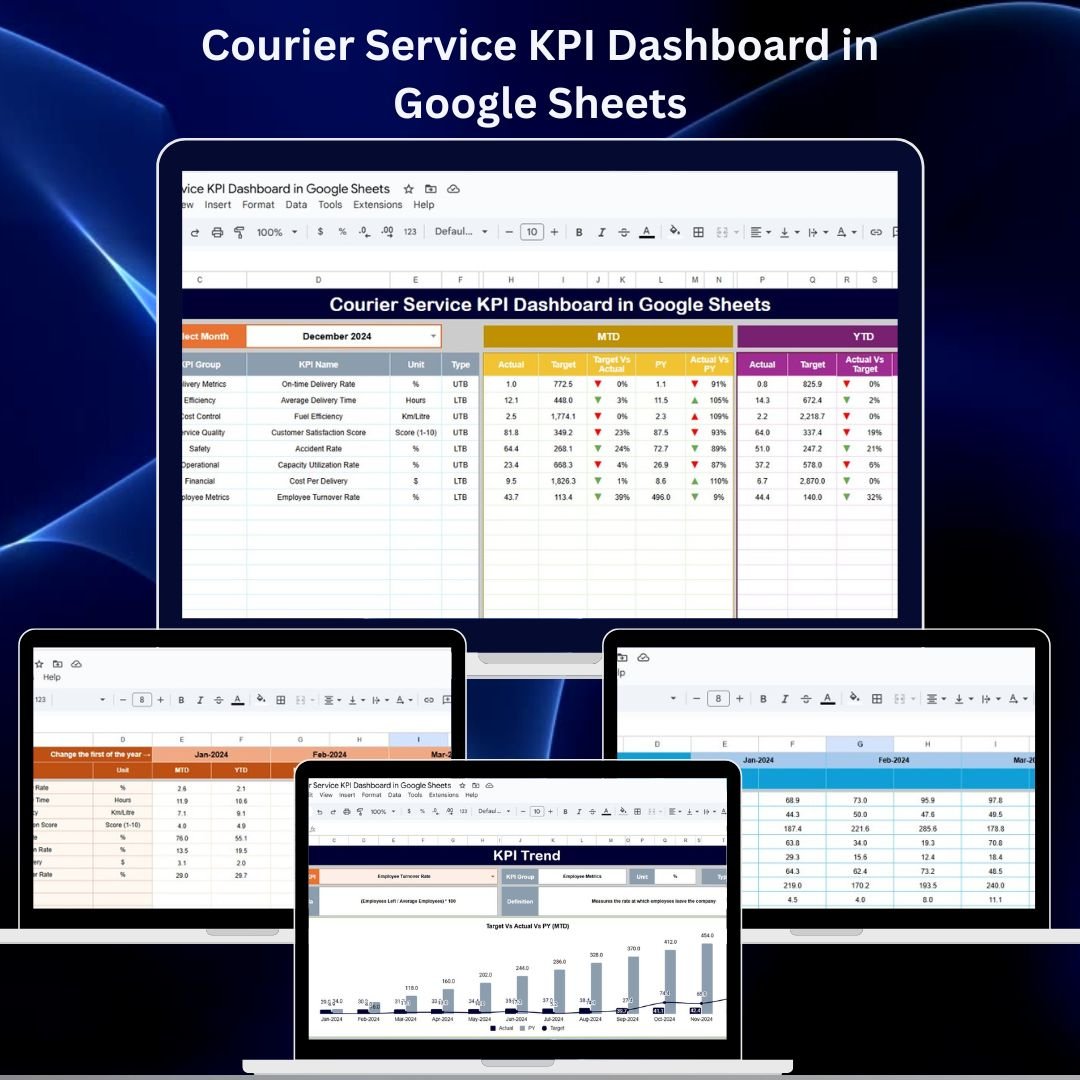
Managing courier operations requires real-time visibility into delivery performance, operational efficiency, and service quality. The Courier Service KPI Dashboard in Google Sheets is a ready-to-use and fully interactive template designed to help logistics teams and delivery managers track all key performance indicators (KPIs) in one centralized place.
From on-time delivery rates to delivery cost per order, this dashboard provides a complete overview of your courier performance through dynamic charts and automated comparisons. With Month-to-Date (MTD) and Year-to-Date (YTD) metrics, managers can easily monitor trends, compare actuals against targets, and make faster, data-driven decisions.
Whether you manage a regional delivery team or a full-scale courier company, this dashboard offers the insights you need to improve operational efficiency and enhance customer satisfaction.
🔑 Key Features of the Courier Service KPI Dashboard
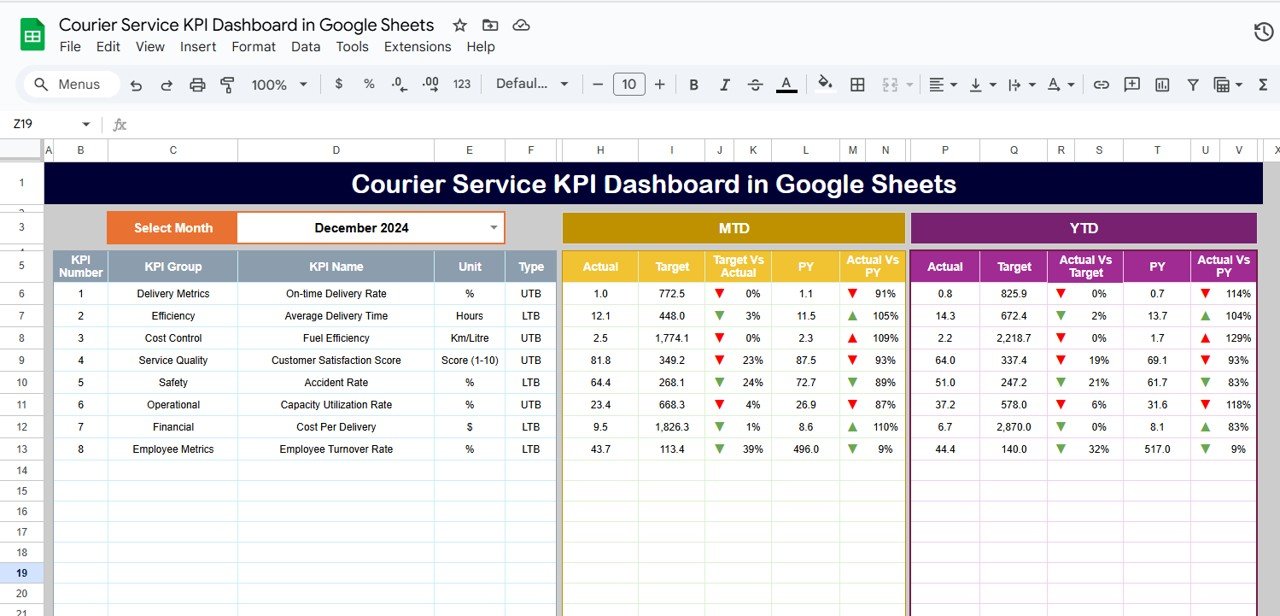
📌 Dashboard Sheet Tab – Real-Time Performance Overview
-
Month Selection (Range D3) for dynamic dashboard update
-
MTD & YTD Metrics – view Actuals, Targets, and Previous Year values
-
Comparisons – Target vs Actual and PY vs Actual with conditional arrows
Quickly identify areas performing above or below expectations.
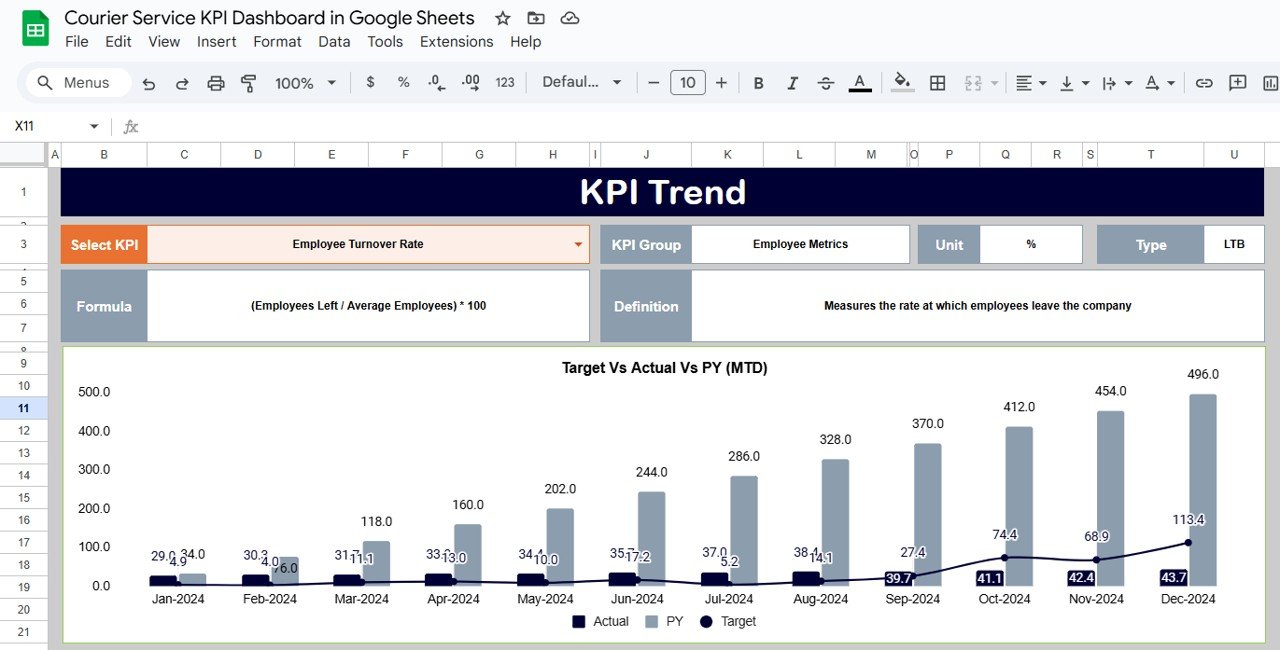
📌 KPI Trend Sheet Tab – Trend and KPI Insight
-
Select any KPI from a dropdown (Range C3)
-
Displays KPI Group, Unit, Formula, and Definition
-
Shows whether the KPI is Lower the Better (LTB) or Upper the Better (UTB)
Ideal for performance trend analysis and KPI understanding.
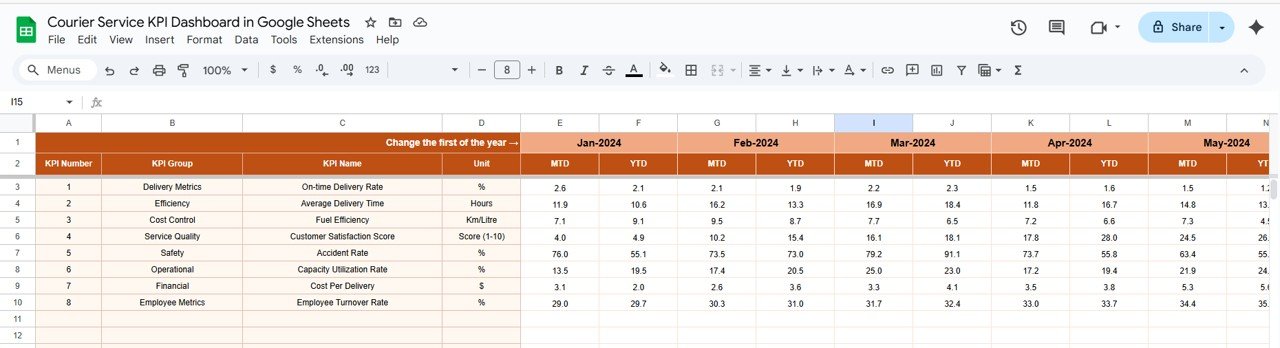
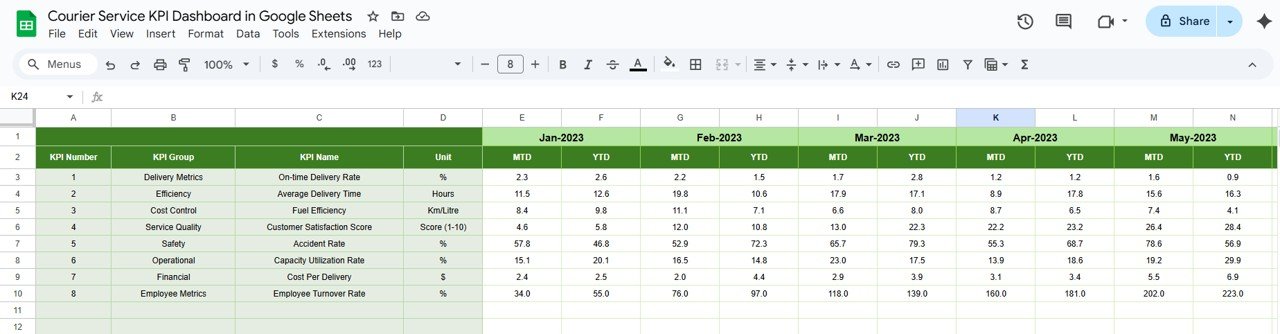
📌 Actual Numbers Sheet Tab – Operational Data Input
-
Enter monthly data for MTD and YTD
-
Automatically feeds into the dashboard
-
Supports fiscal year start month customization (Range E1)
📌 Target Sheet Tab – Goal Tracking
-
Enter monthly and yearly targets per KPI
-
Compare targets versus actuals instantly in the dashboard
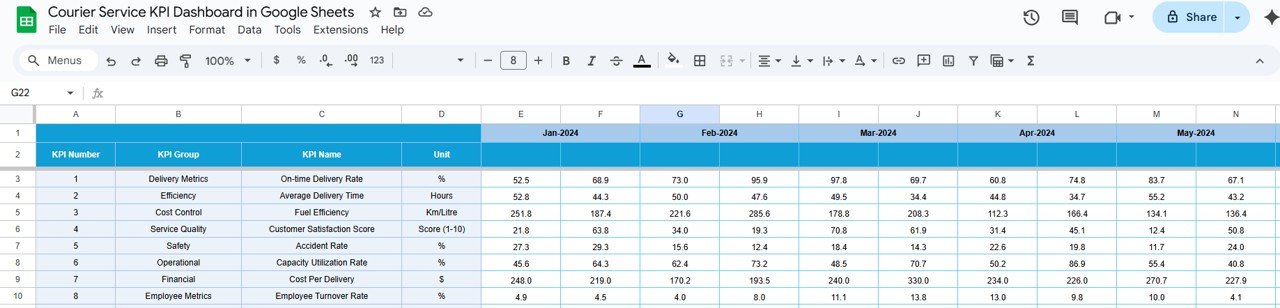
📌 Previous Year Numbers Sheet Tab – Historical Comparison
-
Store last year’s KPI values for monthly comparison
-
Enables effective year-over-year (YoY) performance monitoring
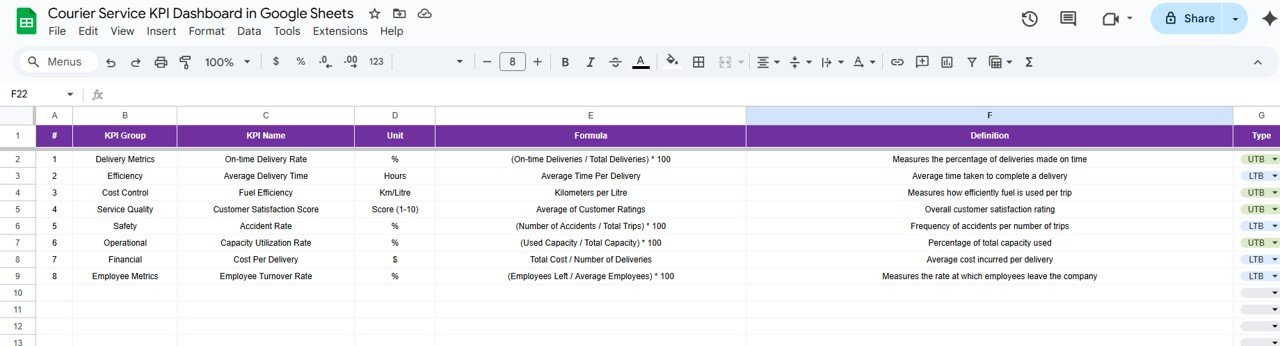
📌 KPI Definition Sheet Tab – Standardized KPI Reference
-
List of all KPI Names, Groups, Units, and Formulas
-
Provides clear KPI definitions
-
Ensures consistent understanding across the team
📦 What’s Inside the Courier Service KPI Dashboard?
✅ Dashboard Sheet – All KPIs in one view
✅ KPI Trend Sheet – Drill-down performance review
✅ Actual Numbers Sheet – Monthly performance data input
✅ Target Sheet – KPI target definitions
✅ Previous Year Sheet – Historical KPI values
✅ KPI Definition Sheet – KPI reference guide
✅ Pre-Formatted Charts & Logic – No setup required
🧠 How to Use the Dashboard
-
Copy the file to your Google Drive
-
Enter current performance data under Actual Numbers
-
Set goals in the Target Sheet
-
Add last year’s data to the Previous Year Sheet
-
Select a month on the Dashboard Sheet to view results
-
Use the KPI Trend Sheet for deeper performance analysis
👥 Who Can Benefit from This Dashboard?
-
🚚 Courier Service Managers – Monitor key KPIs in real time
-
📦 Logistics Professionals – Identify operational bottlenecks
-
📈 Business Analysts – Evaluate trends and performance variances
-
🏢 Executives – Track high-level delivery and service KPIs


Reviews
There are no reviews yet.