


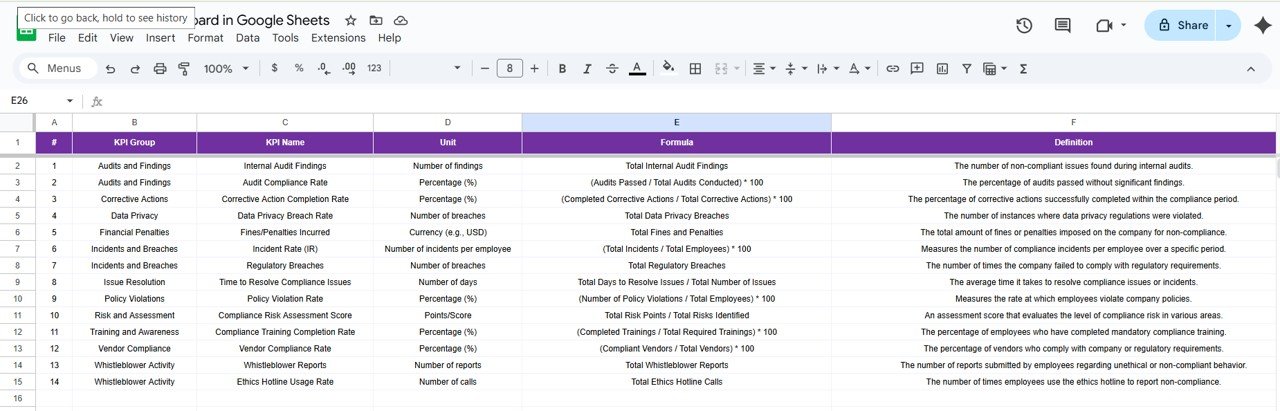

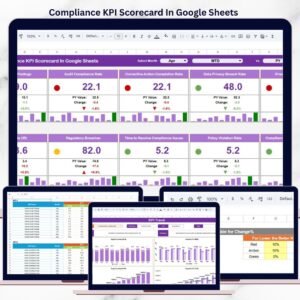
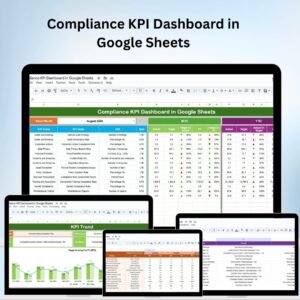
The Compliance KPI Dashboard in Google Sheets is an essential tool for organizations looking to monitor and analyze key performance indicators (KPIs) related to their compliance activities. This dashboard provides a centralized location to track compliance with regulatory standards, internal policies, and industry requirements. By using this tool, businesses can gain valuable insights into their compliance performance, identify areas for improvement, and ensure they meet all necessary compliance standards.
With real-time data updates, interactive visualizations, and customizable features, this dashboard is designed to simplify the compliance monitoring process and enhance decision-making.

Key Features of the Compliance KPI Dashboard in Google Sheets
📊 Comprehensive Compliance Tracking
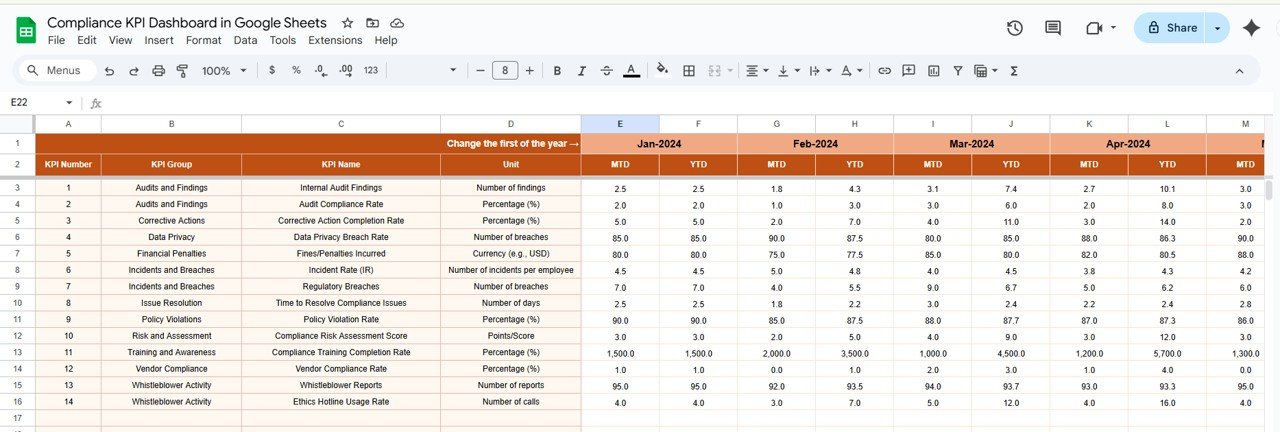
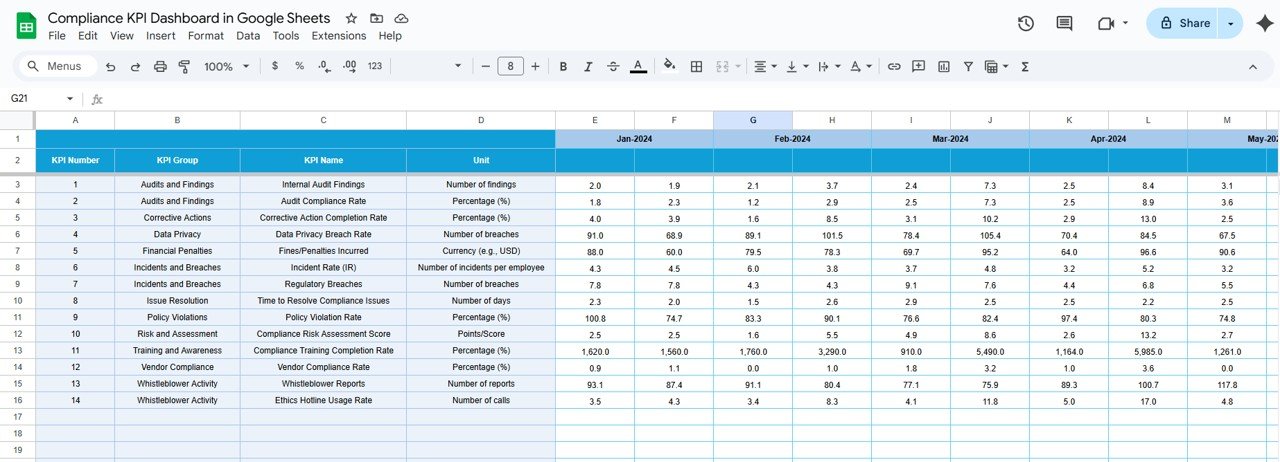
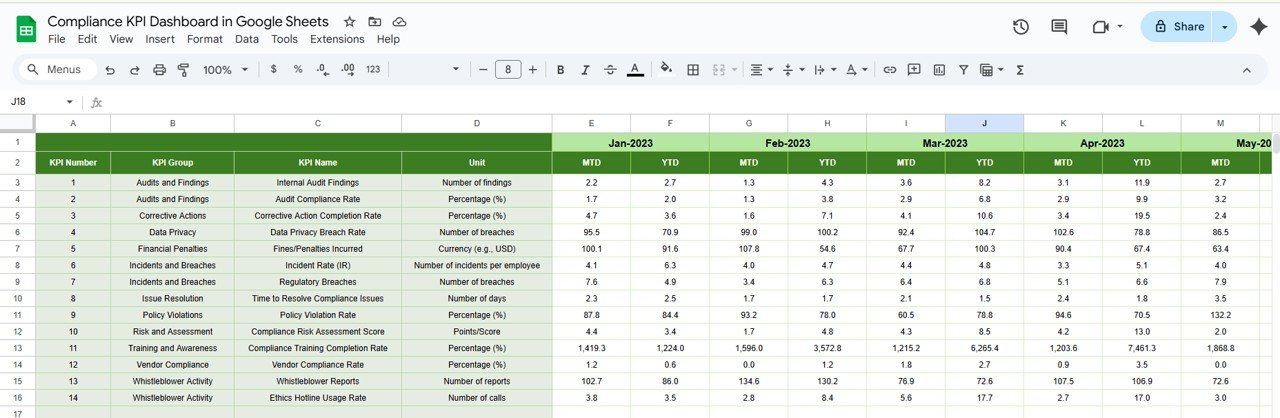
Customizable KPIs: Tailor the dashboard to track the compliance metrics that are most relevant to your organization’s needs, such as regulatory adherence, audit results, or risk management.
Real-Time Data Updates: Keep your compliance data current, allowing you to make informed decisions quickly and address any compliance issues promptly.
📈 Interactive Data Visualization
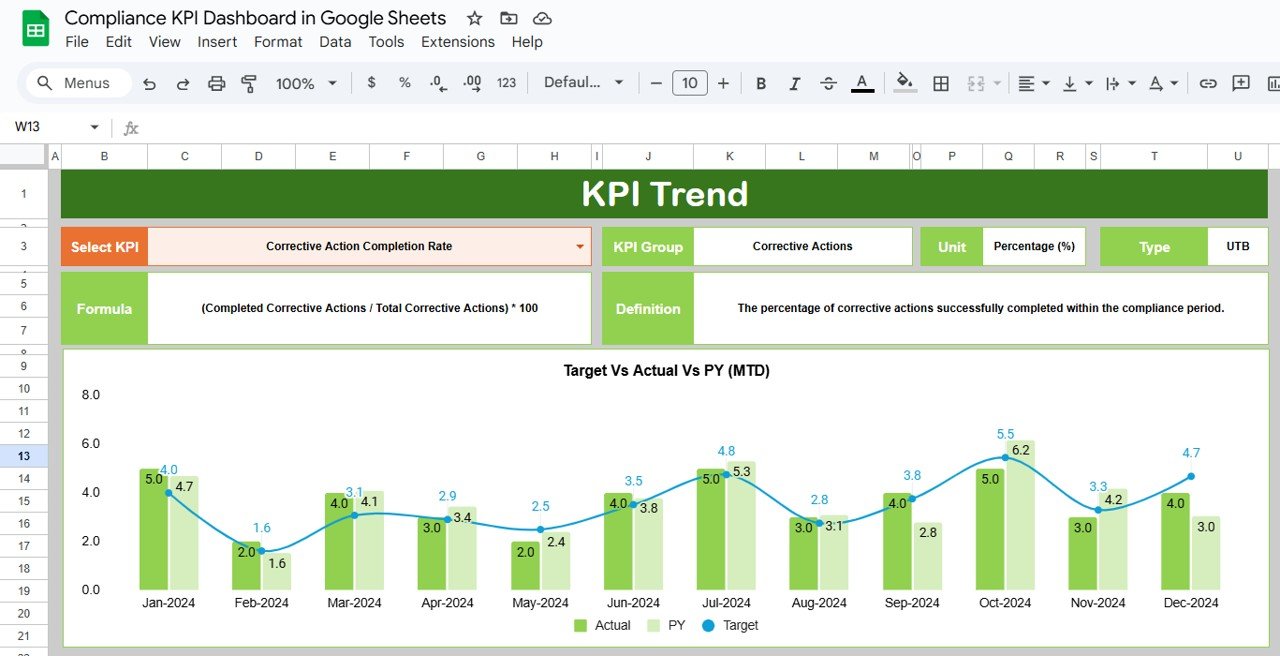
Dynamic Charts and Graphs: Use customizable charts, such as bar charts, line graphs, and pie charts, to visually represent compliance data. This makes it easy to identify trends and highlight areas that need attention.
Conditional Formatting: Apply conditional formatting to highlight critical compliance issues and draw attention to areas requiring immediate action.
🖥 User-Friendly Interface
Intuitive Design: The dashboard is designed to be user-friendly, making it easy for users with varying levels of expertise to navigate and interpret the data.
Collaborative Features: Share the dashboard with team members and stakeholders to foster transparency, ensuring that everyone is on the same page when it comes to compliance efforts.
🔒 Data Integrity and Security
Access Controls: Set permissions to restrict access to sensitive compliance data, ensuring that only authorized personnel can view or modify certain information.
Audit Trails: Keep track of any changes made to the dashboard to ensure accountability and traceability of compliance activities.
Benefits of Implementing the Compliance KPI Dashboard
✅ Enhanced Compliance Monitoring
Monitor key compliance metrics continuously to ensure that your organization remains aligned with regulatory requirements and internal policies.
✅ Improved Decision-Making
Leverage real-time data and visualizations to make informed decisions about compliance strategies, reducing the risk of non-compliance.
✅ Increased Transparency
Foster a culture of transparency by sharing compliance data with stakeholders, promoting trust, and ensuring all team members are aligned on compliance objectives.
✅ Efficient Reporting
Generate compliance reports quickly and easily by automating the data aggregation process, reducing the time and effort required to compile and distribute information.
Getting Started with the Compliance KPI Dashboard in Google Sheets
Identify Compliance Metrics: Determine which KPIs are most relevant to your organization’s compliance objectives and industry regulations.
Customize the Dashboard: Adjust the dashboard to focus on the selected compliance metrics, tailoring the layout and design to suit your needs.
Integrate Data Sources: Link the dashboard to your data sources to ensure seamless updates and accurate reporting.
Set Up Access Controls: Define user roles and permissions to protect sensitive compliance data.
Monitor and Review: Regularly review the dashboard to assess your compliance performance, identify areas of concern, and implement corrective actions as needed.
By using the Compliance KPI Dashboard in Google Sheets, organizations can streamline their compliance monitoring, ensure timely adherence to regulatory standards, and make data-driven decisions to improve overall performance.
Click here to read the Detailed blog post
Compliance KPI Dashboard in Google Sheets
Watch the step-by-step video Demo:
Visit our YouTube channel to learn step-by-step video tutorials
YouTube.com/@PKAnExcelExpert
Compatibility and Requirements
- Works in Google Sheets. You need a free Google account and a web browser.
- The dashboard uses charts to show compliance data. Google explains how to build them in Add and edit a chart or graph.
Frequently Asked Questions
What can I track with this dashboard?
You can track compliance KPIs such as regulatory adherence, audit results and risk management. The KPIs are customizable, so you can focus on the metrics that matter to your organization.
What kinds of charts does it use?
It uses customizable bar charts, line graphs and pie charts. Conditional formatting highlights critical compliance issues so they stand out.
Can I share the dashboard with my team?
Yes. You can share it with team members and stakeholders. Access controls let you limit who can view or change sensitive compliance data.
Can I see who changed the data?
The dashboard includes audit trails that keep track of changes made to it, so compliance activities stay traceable.
Is there an Excel or Power BI version?
There is a Legal Compliance KPI Dashboard in Power BI and a Legal Compliance KPI Dashboard in Excel. They cover legal compliance rather than general compliance.
Related Compliance Templates
- Safety and Compliance Dashboard in Google Sheets: a dashboard for safety and compliance in Google Sheets
- Compliance Audit Tracker in Google Sheets: a tracker for compliance audits
- Compliance Dashboard in Excel: a compliance dashboard for Excel users
- Legal Compliance KPI Dashboard in Excel: legal compliance KPIs in Excel
- Google Sheets Business Pack (Pro): 14 business templates for Google Sheets in one download
Browse all Google Sheets KPI dashboards.












Reviews
There are no reviews yet.