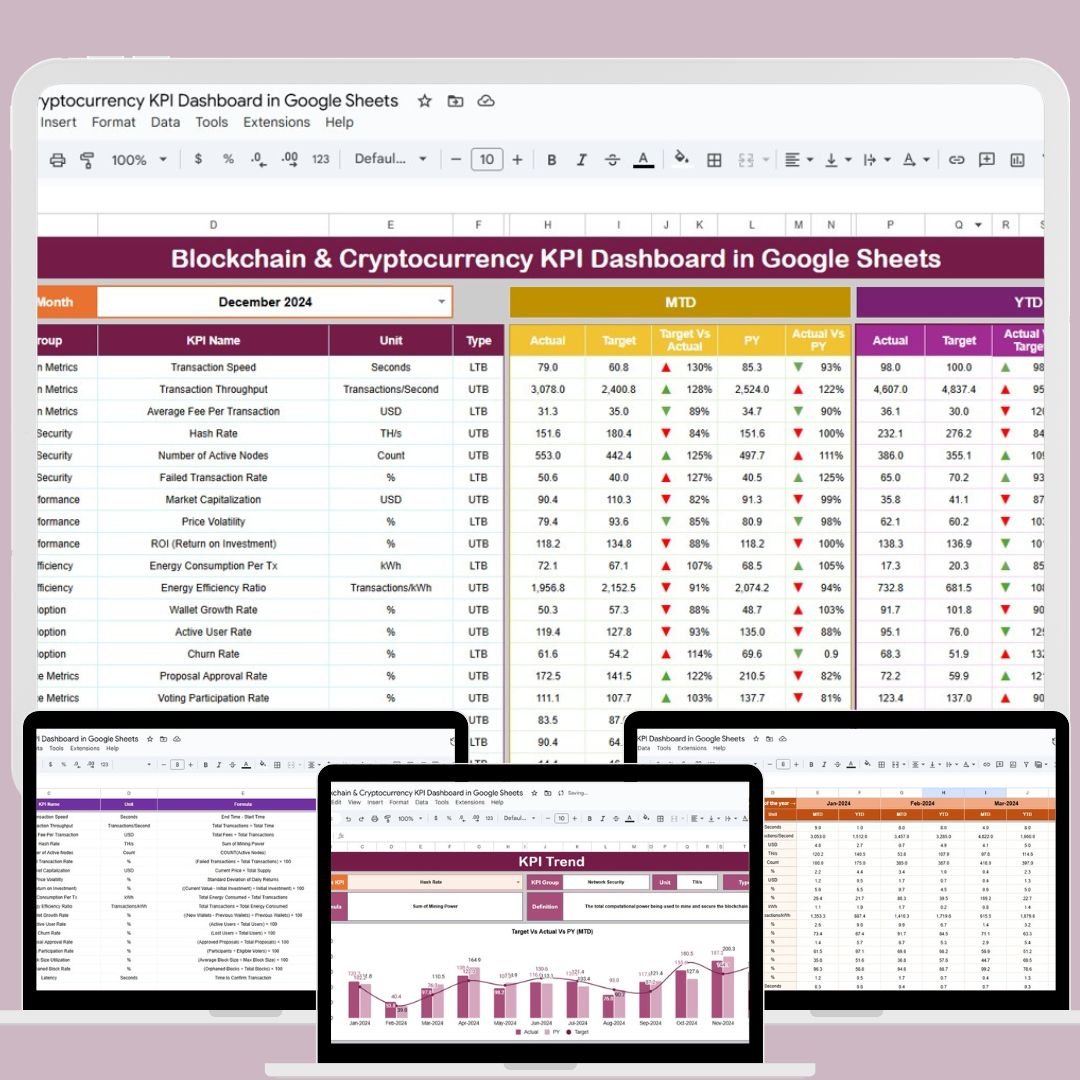

Blockchain & Cryptocurrency KPI Dashboard in Google Sheets
In the fast-paced world of blockchain and cryptocurrency, tracking performance metrics is critical to ensuring profitability and managing risks. The Blockchain & Cryptocurrency KPI Dashboard in Google Sheets is your go-to tool for analyzing trends, optimizing strategies, and improving your crypto investments. Whether you’re an investor, a business, or an enthusiast looking to track your portfolio’s performance, this dashboard provides an easy-to-use platform to keep all your important data in one place.

Key Features of the Blockchain & Cryptocurrency KPI Dashboard
🔑 Real-Time Tracking
Stay updated with real-time data on key metrics like transaction volume, coin value, and market cap. With MTD and YTD comparisons, you can track your performance with ease.
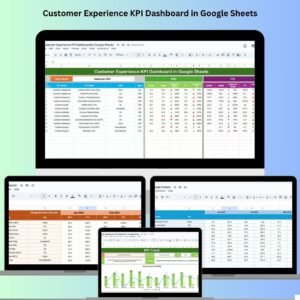
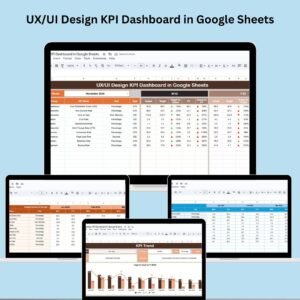
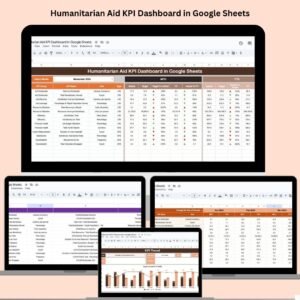
📊 Comprehensive Data Visualization
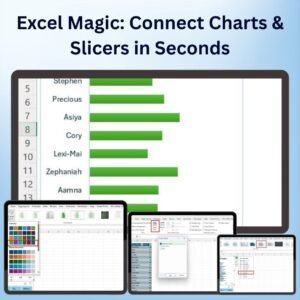
Easily visualize your data through interactive charts and graphs. The dashboard uses conditional formatting with up and down arrows, making it simple to see whether you’re hitting your targets.
📅 Customizable Date Selection
Select the month you wish to track, and instantly update the entire dashboard with the latest data for MTD and YTD comparisons. This feature ensures you’re always working with the most current metrics.
💼 Multiple Worksheets for Detailed Analysis
The dashboard consists of six key sheets designed to streamline data entry and tracking:
-
Dashboard Sheet: Main hub displaying all KPIs
-
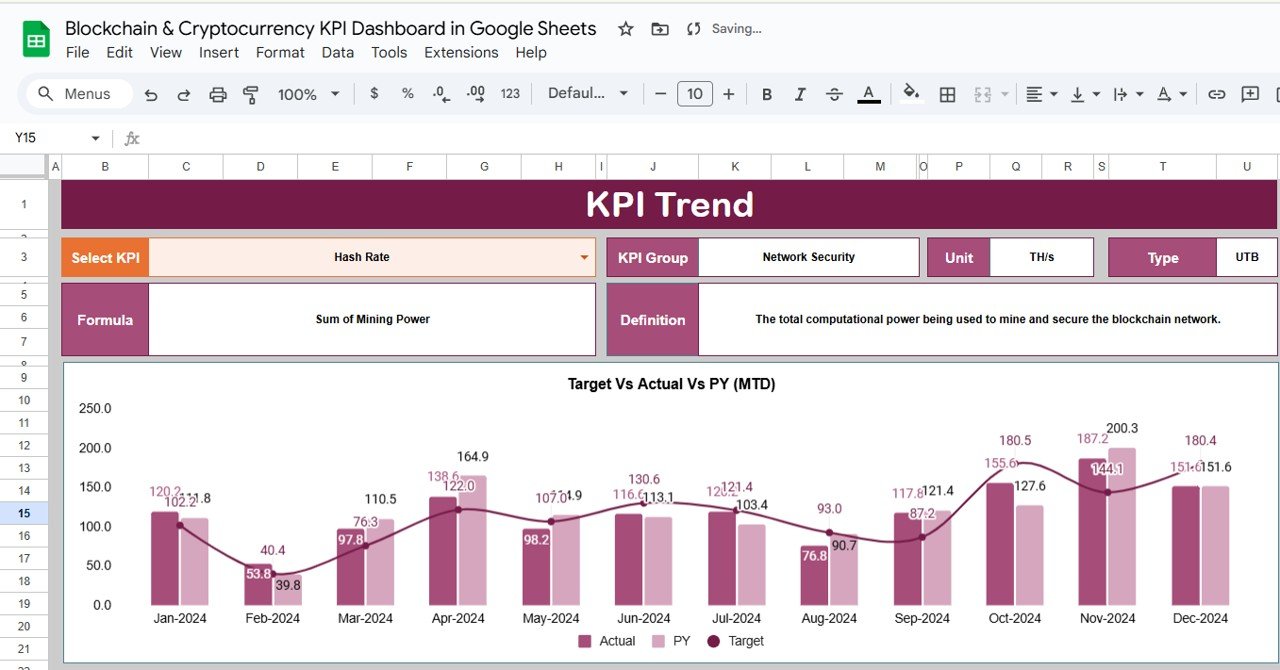
KPI Trend Sheet: Visualize historical trends over time
-
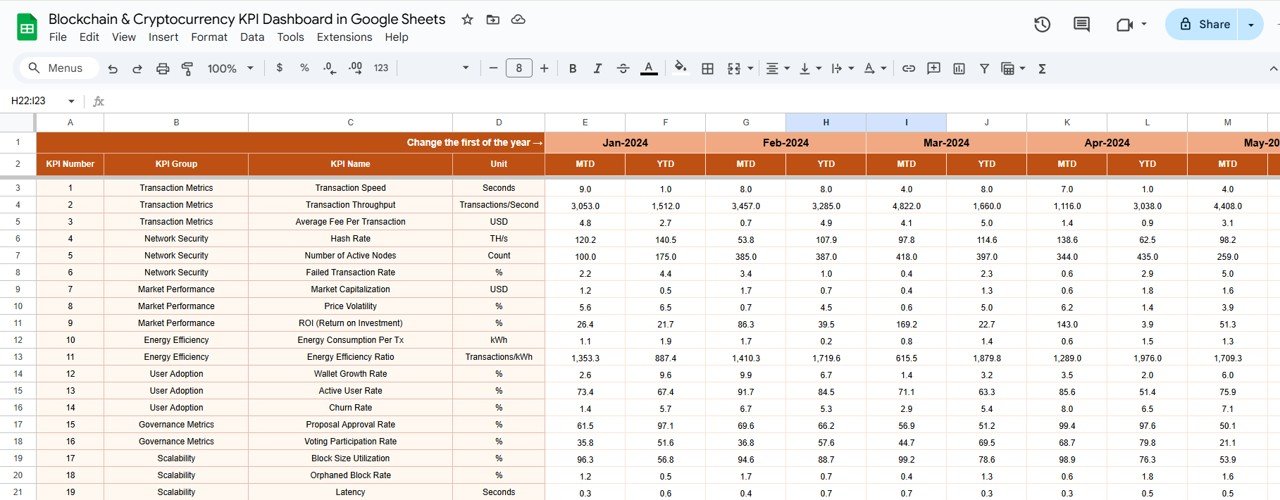
Actual Numbers Sheet: Input your actual data for MTD and YTD
-
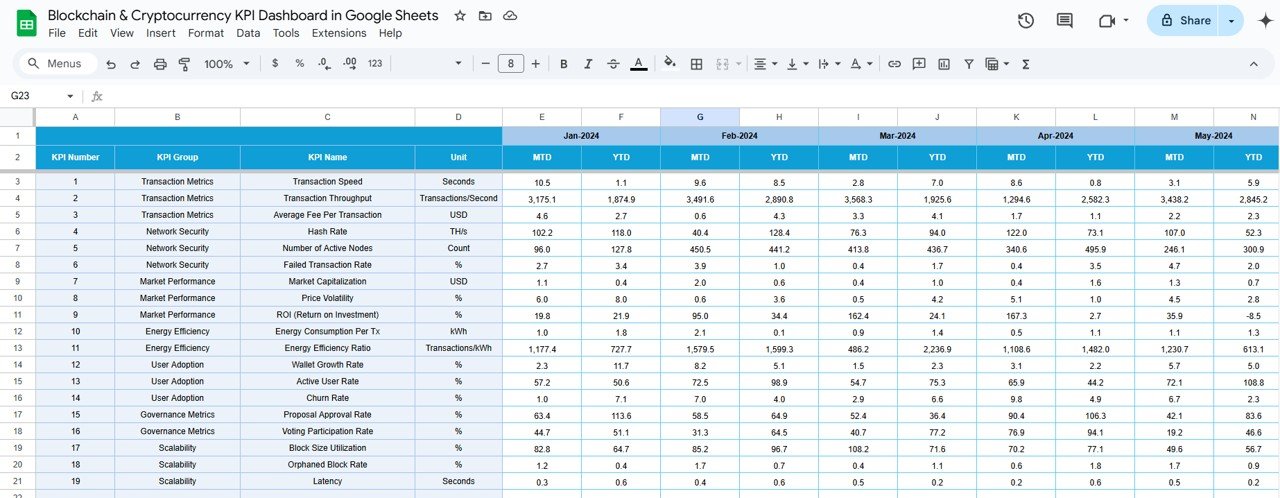
Target Sheet: Set and track your targets
-
Previous Year Sheet: Compare current performance with historical data
-
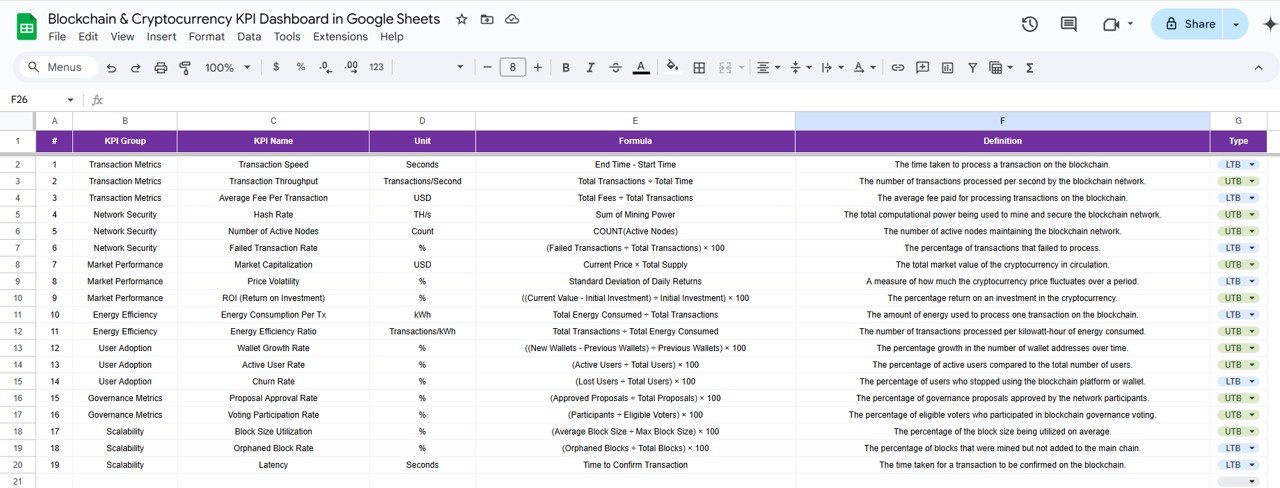
KPI Definition Sheet: Clarify each metric with detailed explanations
What’s Inside the Blockchain & Cryptocurrency KPI Dashboard
💻 6 Functional Worksheets
The dashboard features six distinct sheets, each dedicated to different aspects of blockchain and cryptocurrency KPI tracking. These sheets provide a structured space for entering, analyzing, and comparing data from various sources.
📉 KPI Performance Tracking
Track KPIs such as Transaction Volume, Coin Price, Market Capitalization, and Wallet Growth to evaluate the performance of your cryptocurrency assets.
📅 Dynamic & Customizable Interface
With features like month selection dropdowns and the ability to compare year-over-year data, the dashboard provides flexibility in how you track and analyze your crypto assets.
How to Use the Blockchain & Cryptocurrency KPI Dashboard
1️⃣ Download and Open the Template
Download the Blockchain & Cryptocurrency KPI Dashboard and open it in Google Sheets.
2️⃣ Input Actual Data
Enter your MTD and YTD data into the Actual Numbers Sheet. Use the Target Sheet to input your performance targets for each KPI.
3️⃣ Analyze Trends Over Time
Use the KPI Trend Sheet to monitor the performance of selected KPIs over time. You can compare historical data with current metrics to spot trends and adjust strategies.
4️⃣ Set Targets and Track Performance
Set monthly and yearly targets in the Target Sheet and monitor how your actual performance stacks up against those goals.
5️⃣ Share with Your Team
Easily share the dashboard with other team members or investors to keep everyone aligned with your blockchain and cryptocurrency goals.
Who Can Benefit from This Blockchain & Cryptocurrency KPI Dashboard
💼 Crypto Investors
If you’re an investor looking to track the performance of your portfolio, this dashboard allows you to easily monitor market cap, transaction volume, and wallet growth.
📊 Data Analysts
Track the performance of various cryptocurrencies, visualize trends, and forecast future performance using this comprehensive tool.
🔧 Blockchain Developers
Developers working on blockchain projects can use this dashboard to track performance metrics like mining hash rates and transaction volume to optimize their blockchain solutions.
💡 Businesses in Crypto
Whether you’re managing a crypto exchange or a decentralized platform, this dashboard helps you assess your crypto operations and make strategic decisions.
Click here to read the Detailed blog post
Watch the step-by-step video Demo:


Reviews
There are no reviews yet.