

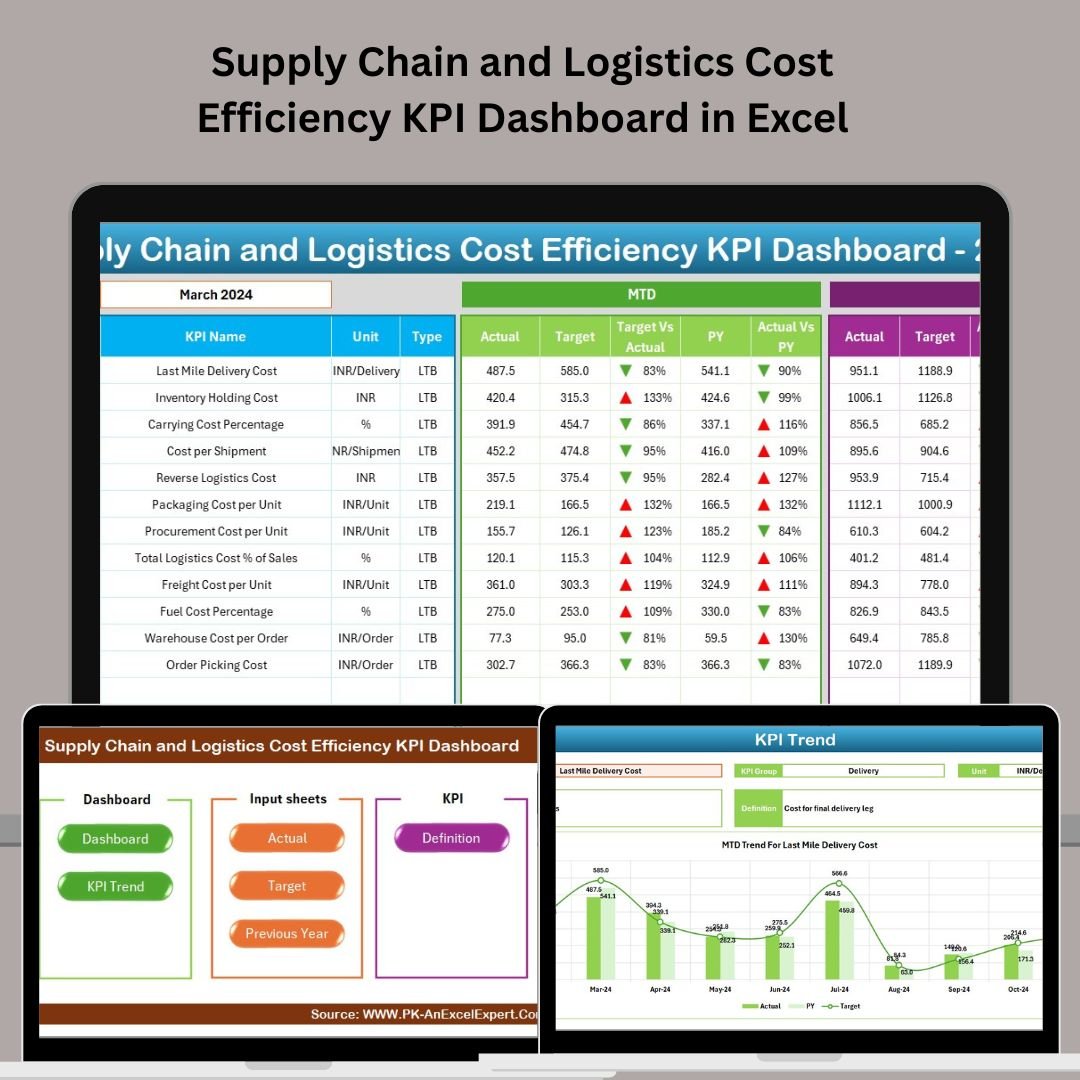


Controlling supply chain and logistics costs isn’t just about reducing expenses — it’s about improving operational efficiency, profitability, and strategic decision-making. The Supply Chain and Logistics Cost Efficiency KPI Dashboard in Excel empowers logistics professionals to track every dollar, benchmark performance, and take data-driven actions using one dynamic tool.
Whether you’re managing warehouses, transportation, procurement, or full-chain operations, this dashboard provides clear, visual, and actionable insights — without the need for complicated software.
✨ Key Features of the Cost Efficiency KPI Dashboard
🖥️ 7 Well-Organized Worksheet Tabs
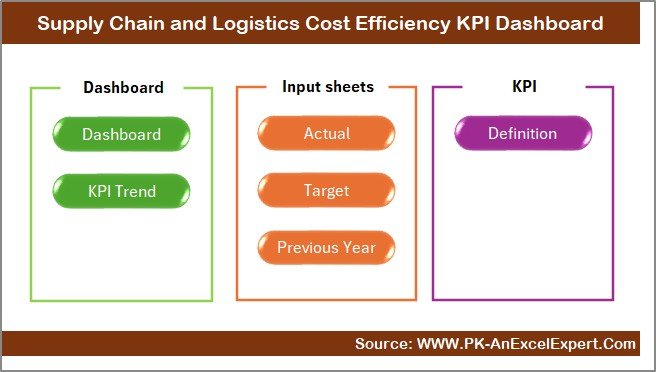
Home Sheet – Easy navigation via clickable buttons
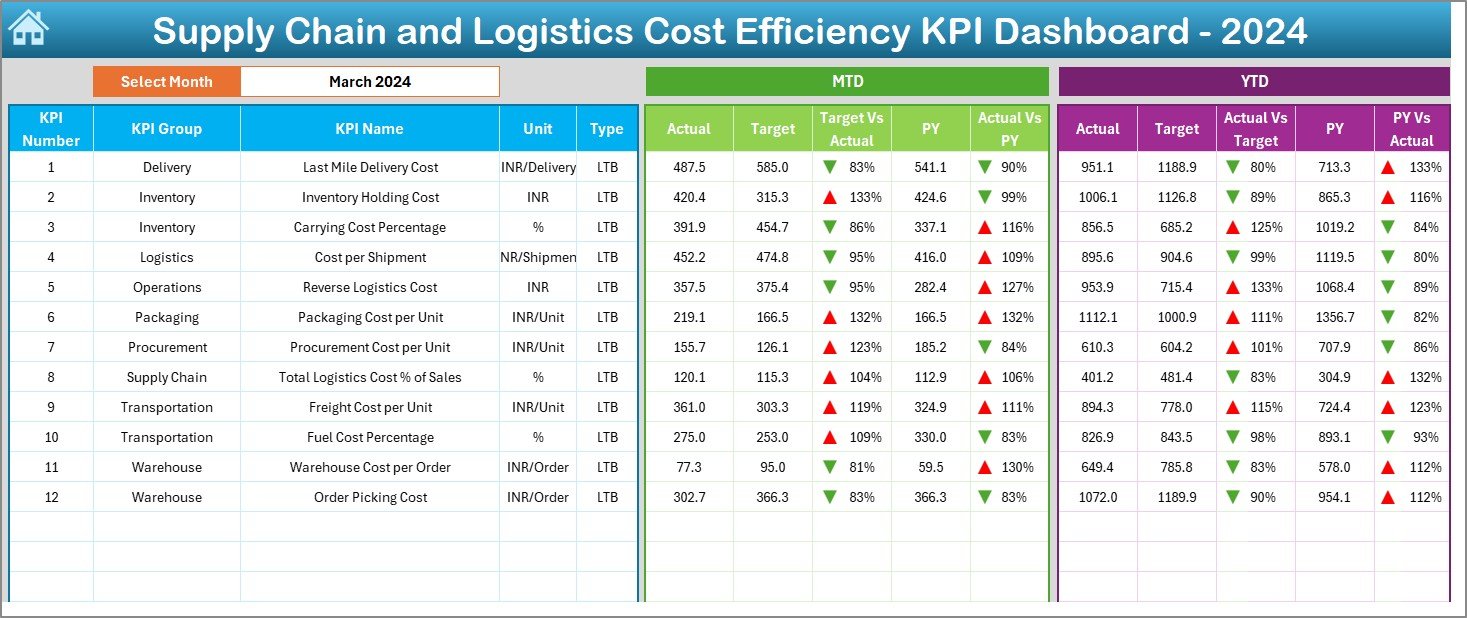
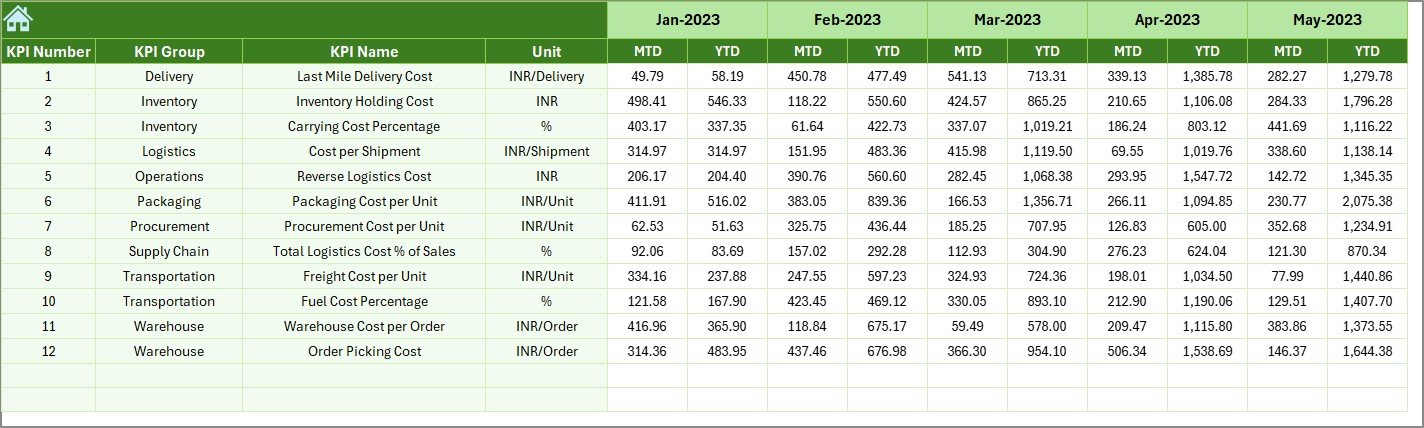
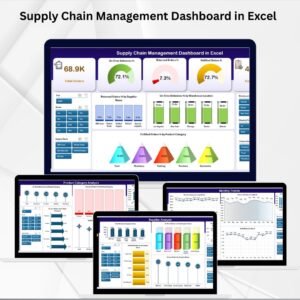
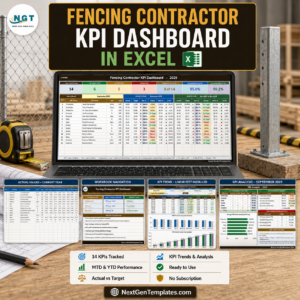
Dashboard Sheet – Visual summary of MTD and YTD KPIs
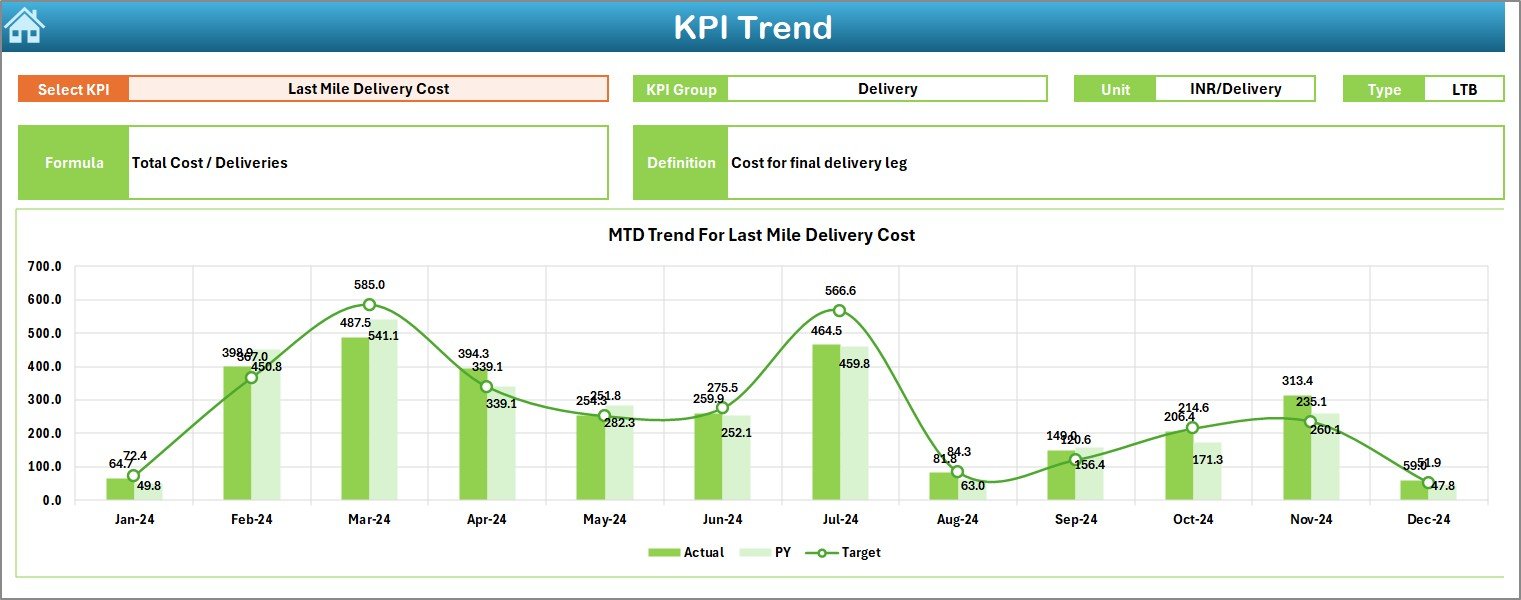
KPI Trend Sheet – Drill down into specific KPI trends
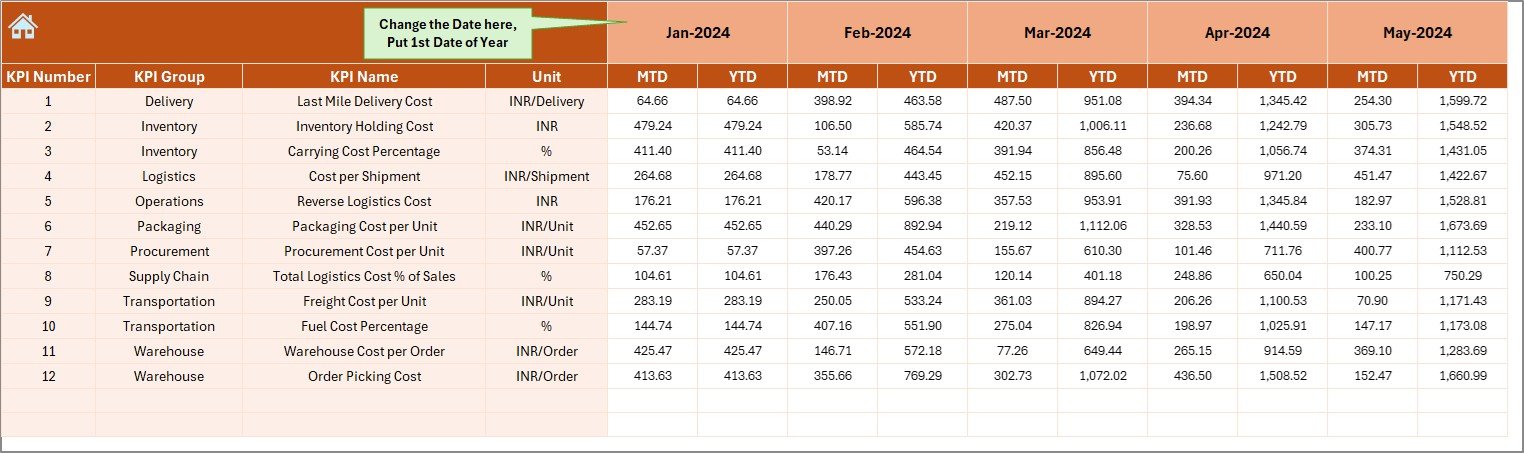
Actual Numbers Input Sheet – Monthly actuals in a clean format
Target Sheet – Enter MTD and YTD performance targets
Previous Year Sheet – Store last year’s actuals for YoY comparison
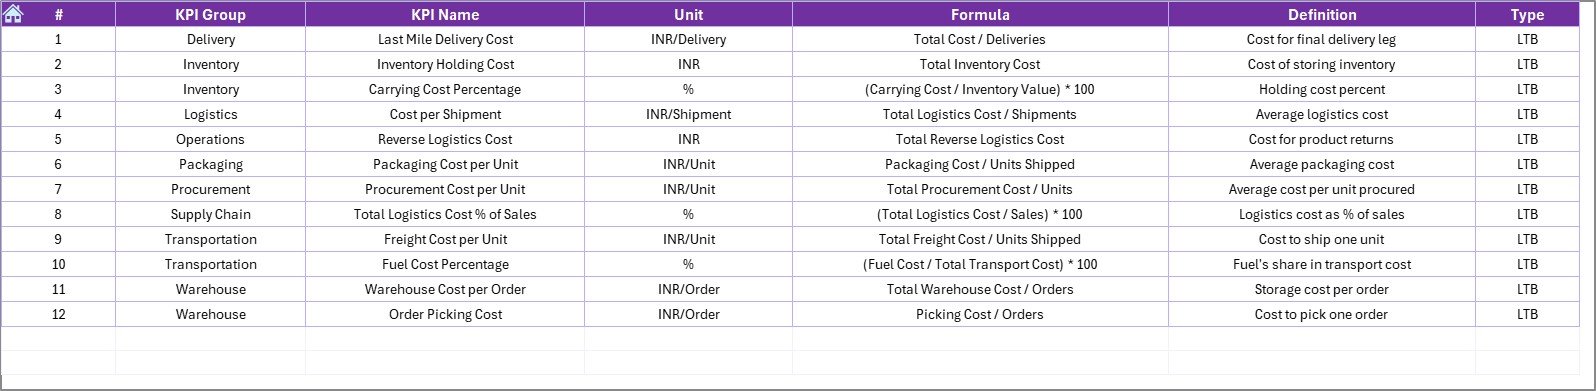
KPI Definition Sheet – Maintain formulas, units, and definitions
📊 Interactive Dashboard with Monthly Selection
Choose any month from a dropdown in cell D3
View comparisons of:
MTD Actual vs Target vs Previous Year
YTD Actual vs Target vs Previous Year
Trend arrows (↑↓) and color formatting highlight performance
📈 KPI Trend Analysis Sheet
Select any KPI from a dropdown
See MTD/YTD trends with side-by-side actual, target, and PY charts
View detailed KPI info like:
Group, Unit, Formula, Type (UTB/LTB), and Definition
📝 Data Entry Made Easy
Update actuals and targets monthly
Change your fiscal start month instantly in cell E1
All sheets and charts auto-refresh — no formulas needed
📦 What’s Inside the Excel Template?
🔹 One-Click Navigation from Home Tab
🔹 MTD & YTD Trend Comparison Views
🔹 Fully Editable KPI Definition Sheet
🔹 Pre-Built Visuals for Quick Insight
🔹 Scalable Design for Any Business Size
🔹 Built-in Automation (No Macros Needed)
🛠 How to Use the Dashboard
✅ Open the Excel file and go to the Actual Numbers Input Sheet
📥 Enter KPI data monthly — figures auto-sync with charts
🎯 Set your targets in the Target Sheet
🗃️ Enter previous year’s data for historical comparison
📊 Navigate to Dashboard & Trend Sheets to visualize insights
🧠 Use the KPI Definition Sheet to ensure metric consistency
Everything updates automatically — no need to touch the formulas.
👥 Who Should Use This Dashboard?
Perfect for:
📦 Logistics Managers – Track freight, warehouse, and distribution costs
🚚 Supply Chain Analysts – Monitor transportation, handling, and turnover KPIs
🏭 Procurement & Operations Teams – Measure efficiency and cost performance
🏢 SMEs and Enterprises – Scalable for all business sizes and industries
🚀 Advantages of This KPI Dashboard
📉 Reduce Operational Waste – Spot overspending and delays
📊 Make Smart Decisions Faster – Visual cues speed up reporting
📅 Track MTD & YTD – All metrics auto-update with every data entry
🔧 Customizable & Flexible – Add or edit KPIs, formulas, and targets
🧾 Performance Benchmarking – Compare actuals with targets and past performance
📤 Excel-Based – No subscriptions, plugins, or learning curve
🧠 Beginner-Friendly – Prebuilt sheets with dropdowns and visuals
💡 Best Practices for Using the Dashboard
🔁 Update Data Monthly – Keep your actuals and targets current
📊 Review Trends Weekly or Monthly – Use the trend sheet to monitor KPI health
🎨 Use Conditional Formatting – Pay attention to arrows and colors for red flags
👥 Collaborate Across Teams – Align procurement, logistics, and finance goals
💾 Backup Regularly – Maintain historical versions for long-term analysis
🔁 Click here to read the Detailed blog post
📺 Visit our YouTube channel to learn step-by-step video tutorials
Watch the step-by-step video tutorial:
Compatibility and Requirements
- Works in Microsoft Excel desktop (Excel 2016 or later, or Microsoft 365).
- You pick the month from a dropdown on the Dashboard sheet and the KPI from a dropdown on the KPI Trend sheet. Microsoft explains dropdowns in Create a drop-down list.
Frequently Asked Questions
Which sheets are included?
Seven sheets: Home, Dashboard, KPI Trend, Actual Numbers Input, Target, Previous Year and KPI Definition.
How do I update the dashboard?
Enter your monthly figures on the Actual Numbers Input sheet and your MTD and YTD goals on the Target sheet. Then choose a month on the Dashboard sheet and the charts and figures update.
Can I compare this year with last year?
Yes. Add last year’s figures to the Previous Year sheet. The Dashboard then shows MTD and YTD actuals next to the targets and the previous year.
Can I change the fiscal year start month?
Yes. Change the start month in cell E1 and the sheets update.
Where can I see the formula and unit for each KPI?
Open the KPI Trend sheet and pick a KPI from the dropdown. It shows the group, unit, formula, type (UTB or LTB) and definition. You can also edit these on the KPI Definition sheet.
Is there a Google Sheets or Power BI version?
There is a Supply Chain Logistics KPI Dashboard in Google Sheets and a Supply Chain Logistics KPI Dashboard in Power BI.
Related Supply Chain Templates
- Supply Chain and Logistics Performance KPI Dashboard in Excel: performance KPIs for the same operation
- Supply Chain and Logistics Inventory Management KPI Dashboard in Excel: inventory metrics
- Supply Chain and Logistics Financial Health KPI Dashboard in Excel: a finance view of logistics
- Supply Chain Logistics KPI Dashboard in Google Sheets: the Google Sheets edition
- Logistics Manager Toolkit: 8 templates for logistics managers in one download
Browse all Excel KPI dashboards.






















Reviews
There are no reviews yet.