
Are you still struggling to turn your raw data into meaningful insights? In today’s data-driven world, making fast and accurate decisions is no longer optional—it’s essential.
👉 Introducing the Augmented Analytics Dashboard in Excel — a powerful, ready-to-use solution that transforms complex data into clear, actionable insights within minutes.
This dashboard combines automation, intelligent analytics, and interactive visualizations—all inside Excel. As a result, you can analyze data faster, reduce manual effort, and make smarter business decisions without needing advanced technical skills.
Whether you are a business owner, analyst, or manager, this dashboard helps you unlock the true power of your data effortlessly.
🚀 Key Features of Augmented Analytics Dashboard in Excel
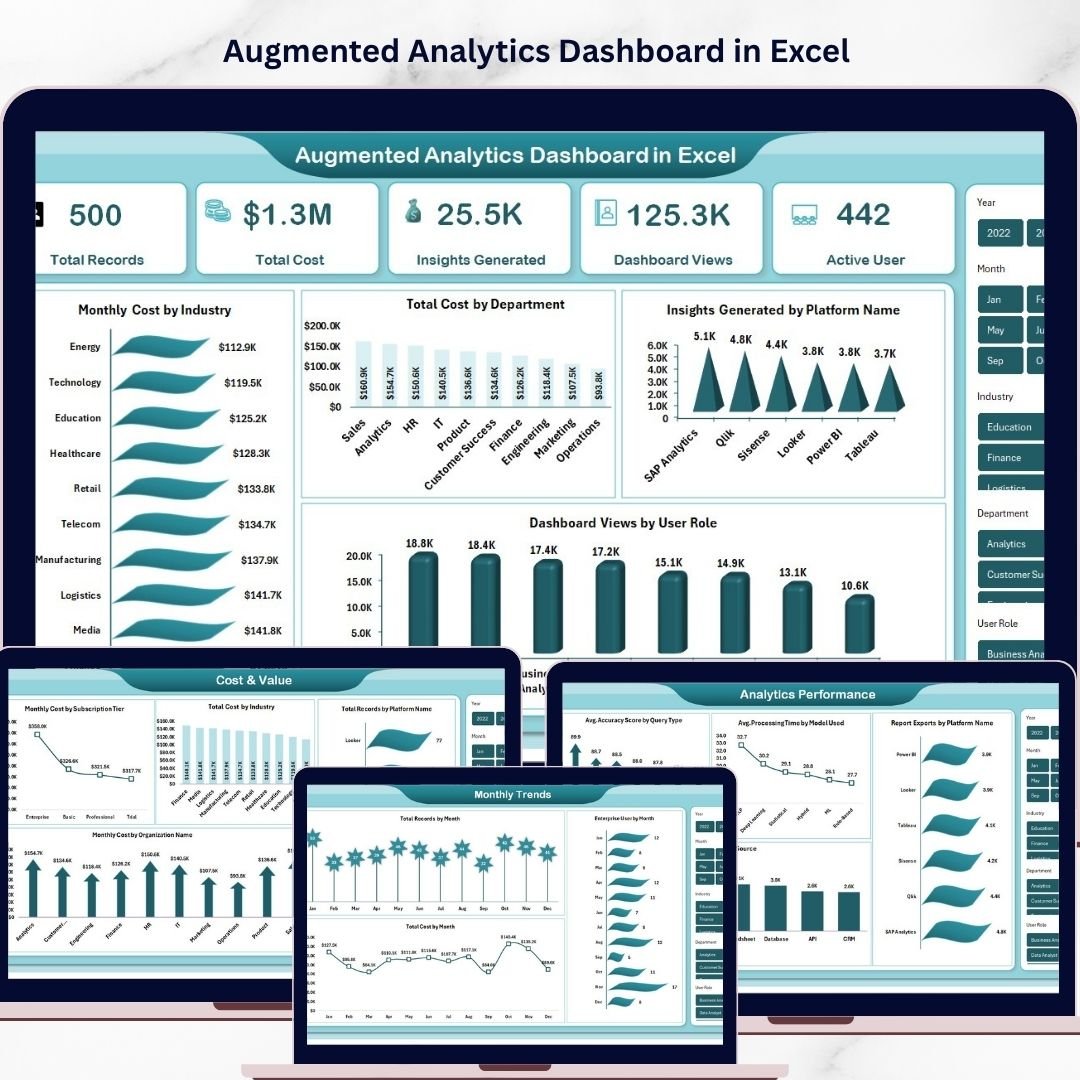
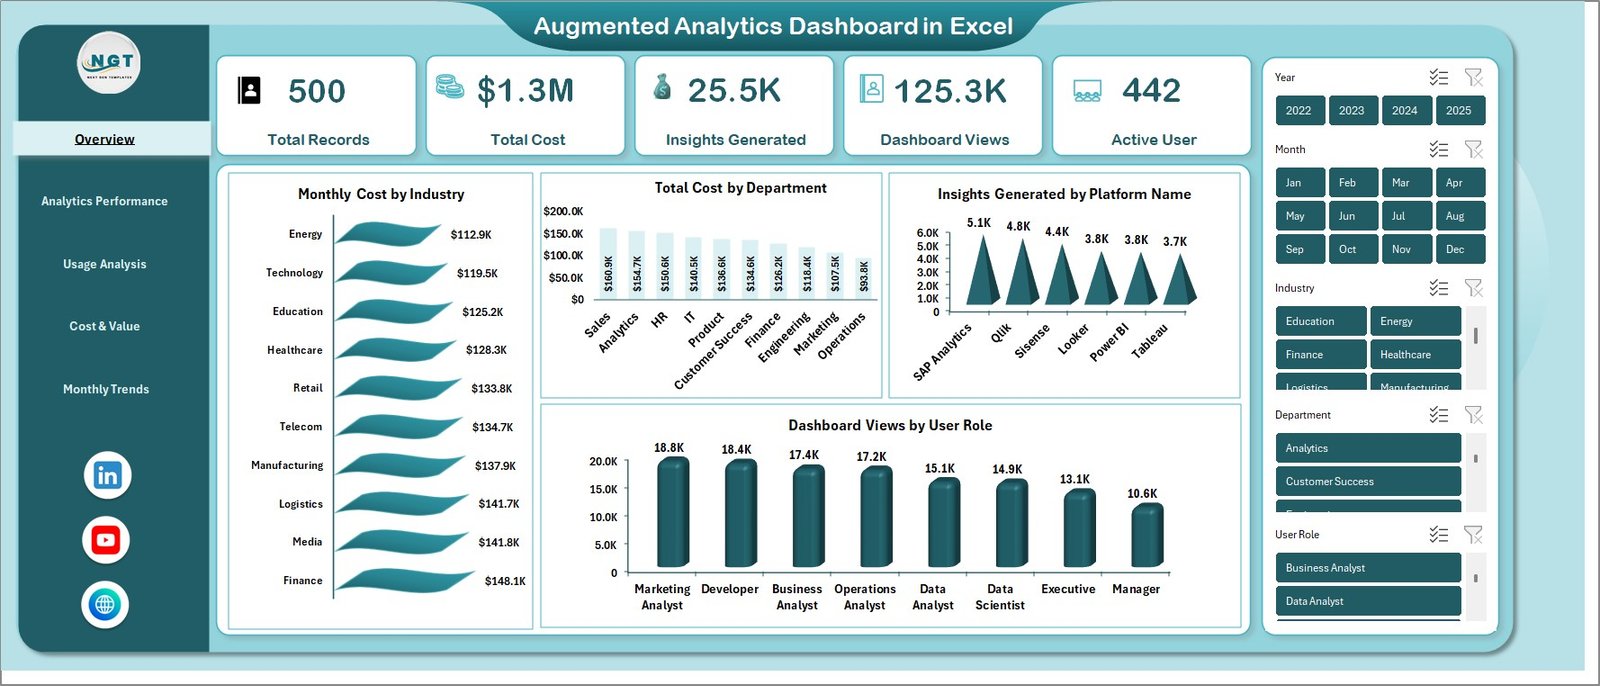
✨ Smart Overview Dashboard – Instantly view key KPIs like Total Records, Total Cost, Insights Generated, Dashboard Views, and Active Users.
📊 Interactive Visualizations – Analyze data using dynamic charts such as Monthly Cost by Industry, Cost by Department, and User Role insights.
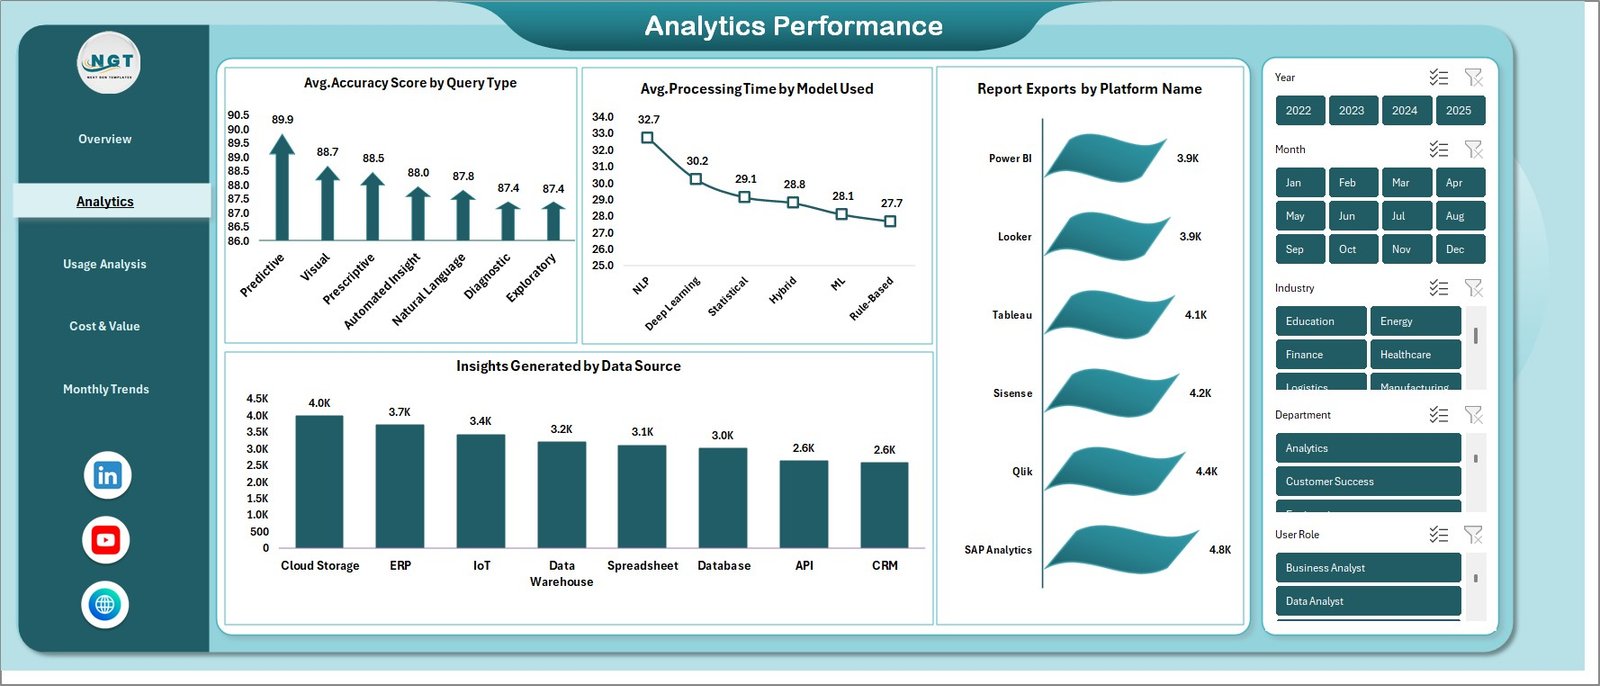
⚡ Analytics Performance Tracking – Measure system efficiency with metrics like Accuracy Score, Processing Time, and Data Source insights.
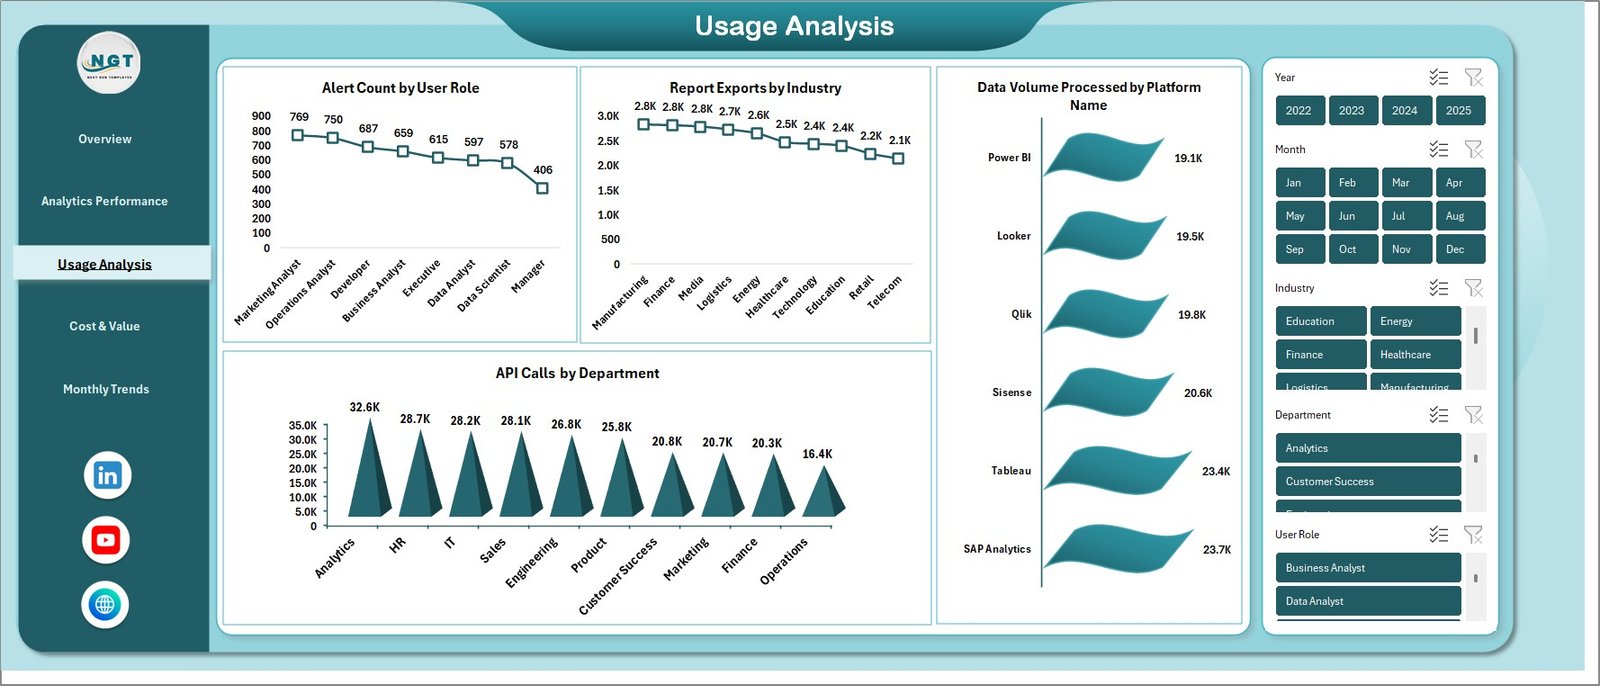
👥 User Behavior Analysis – Understand user engagement with API calls, alerts, and report usage across industries.
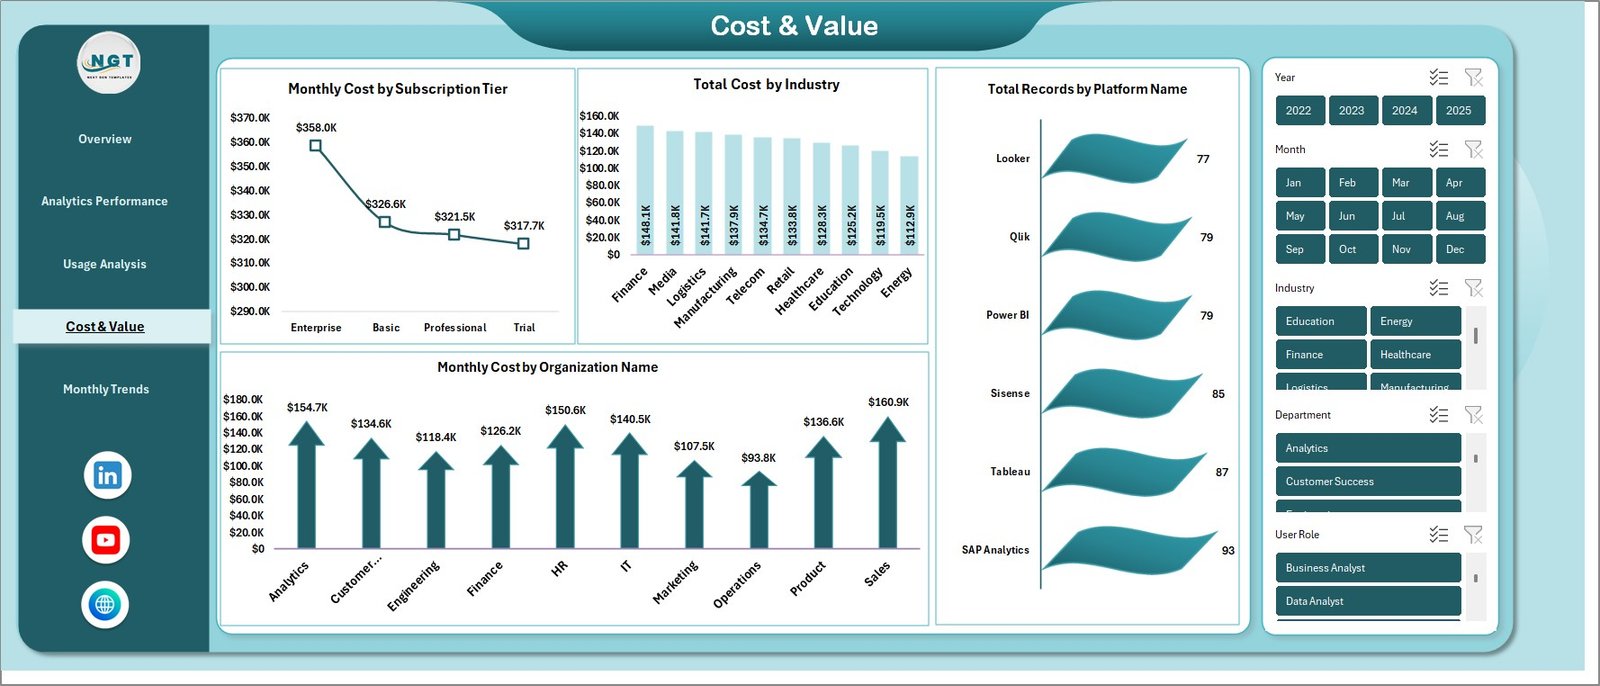
💰 Cost & Value Monitoring – Track subscription costs, industry expenses, and organizational spending to improve ROI.
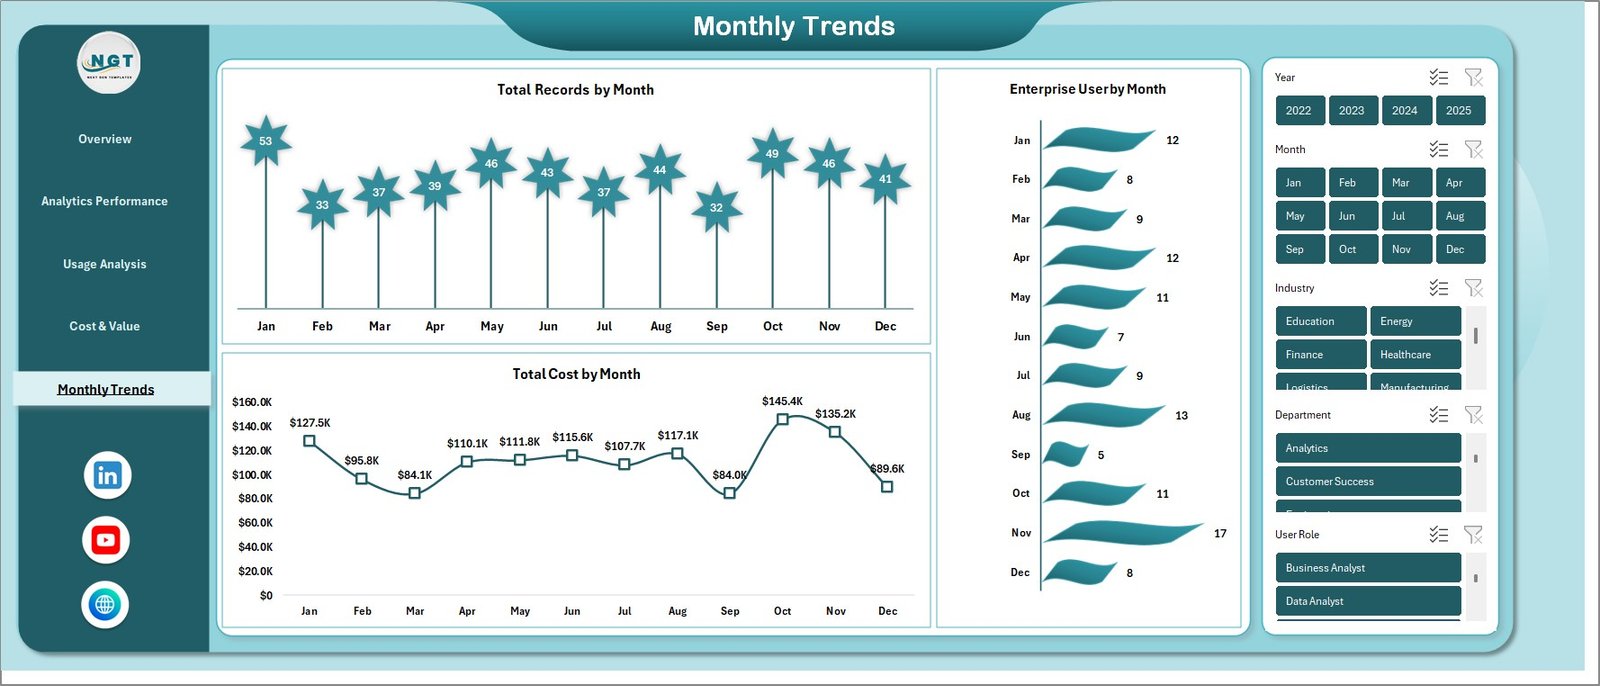
📈 Monthly Trend Analysis – Identify growth patterns using monthly records, cost trends, and enterprise user data.
🤖 Automated Insights Generation – Reduce manual work with automated calculations and intelligent data processing.
🎯 Decision-Ready Reporting – Get clear, actionable insights to support faster and smarter decision-making.
📦 What’s Inside the Augmented Analytics Dashboard in Excel
📁 Overview Sheet – A central control panel with KPI cards and summary charts for quick insights.
📊 Analytics Performance Sheet – Tracks system efficiency with accuracy scores, processing time, and export metrics.
📈 Usage Analysis Sheet – Provides deep insights into user behavior and system interaction.
💵 Cost & Value Sheet – Helps monitor expenses and evaluate financial performance effectively.
📅 Monthly Trends Sheet – Displays data growth trends over time for better forecasting and planning.
All sheets are fully interactive and connected, ensuring a seamless data analysis experience.
🛠️ How to Use the Augmented Analytics Dashboard in Excel
Using this dashboard is simple and beginner-friendly:
1️⃣ Download the dashboard file
2️⃣ Enter your data into the source sheets
3️⃣ Use slicers and filters for dynamic analysis
4️⃣ Review KPIs and charts instantly
5️⃣ Generate insights and make informed decisions
Within minutes, you can transform raw data into meaningful business intelligence.
👨💼 Who Can Benefit from This Augmented Analytics Dashboard?
📊 Business Analysts – Analyze trends quickly and generate insights efficiently
📈 Data Analysts – Reduce manual reporting and improve productivity
🏢 Enterprises – Monitor large datasets and track cross-department performance
👔 Managers & Executives – Make faster, data-driven strategic decisions
💡 Startups & SMEs – Get powerful analytics without investing in expensive BI tools
This dashboard is not just a reporting tool—it’s a complete data intelligence solution. It helps you save time, reduce errors, and gain deeper insights into your business performance.
👉 If you want to simplify data analysis and make smarter decisions, this dashboard is your perfect companion.
Click here to read the Detailed blog post
Visit our YouTube channel to learn step-by-step video tutorials
👉 https://www.youtube.com/@PKAnExcelExpert
Watch the step-by-step video tutorial:
Compatibility and Requirements
- Works in Microsoft Excel desktop (Excel 2016 or later, or Microsoft 365).
- The pages are filtered with slicers. Microsoft explains how they work in Use slicers to filter data.
Frequently Asked Questions
What sheets are in the Augmented Analytics Dashboard in Excel?
Five sheets: Overview, Analytics Performance, Usage Analysis, Cost and Value, and Monthly Trends.
Which KPIs are on the Overview sheet?
Total records, total cost, insights generated, dashboard views and active users, with charts such as monthly cost by industry and cost by department.
What does the Analytics Performance sheet measure?
Accuracy score, processing time, export metrics and data source insights.
How do I use it with my own data?
Enter your data in the source sheets, then use the slicers and filters to analyze it. The KPIs and charts update from that data.
Is there a Power BI version?
Yes, see the Augmented Analytics Dashboard in Power BI.
Related Analytics Templates
- Augmented Analytics Dashboard in Power BI: the same dashboard in Power BI.
- Business Intelligence (BI) Dashboard in Excel: a general BI dashboard in Excel.
- Data Analytics KPI Dashboard in Excel: KPIs for an analytics team.
- Data Analytics Dashboard in Google Sheets: an analytics dashboard for Google Sheets.
- Data Analyst’s Chart & Visualization Pack: 10 Excel and Google Sheets chart templates.
Browse all Excel dashboards or the Excel chart templates.