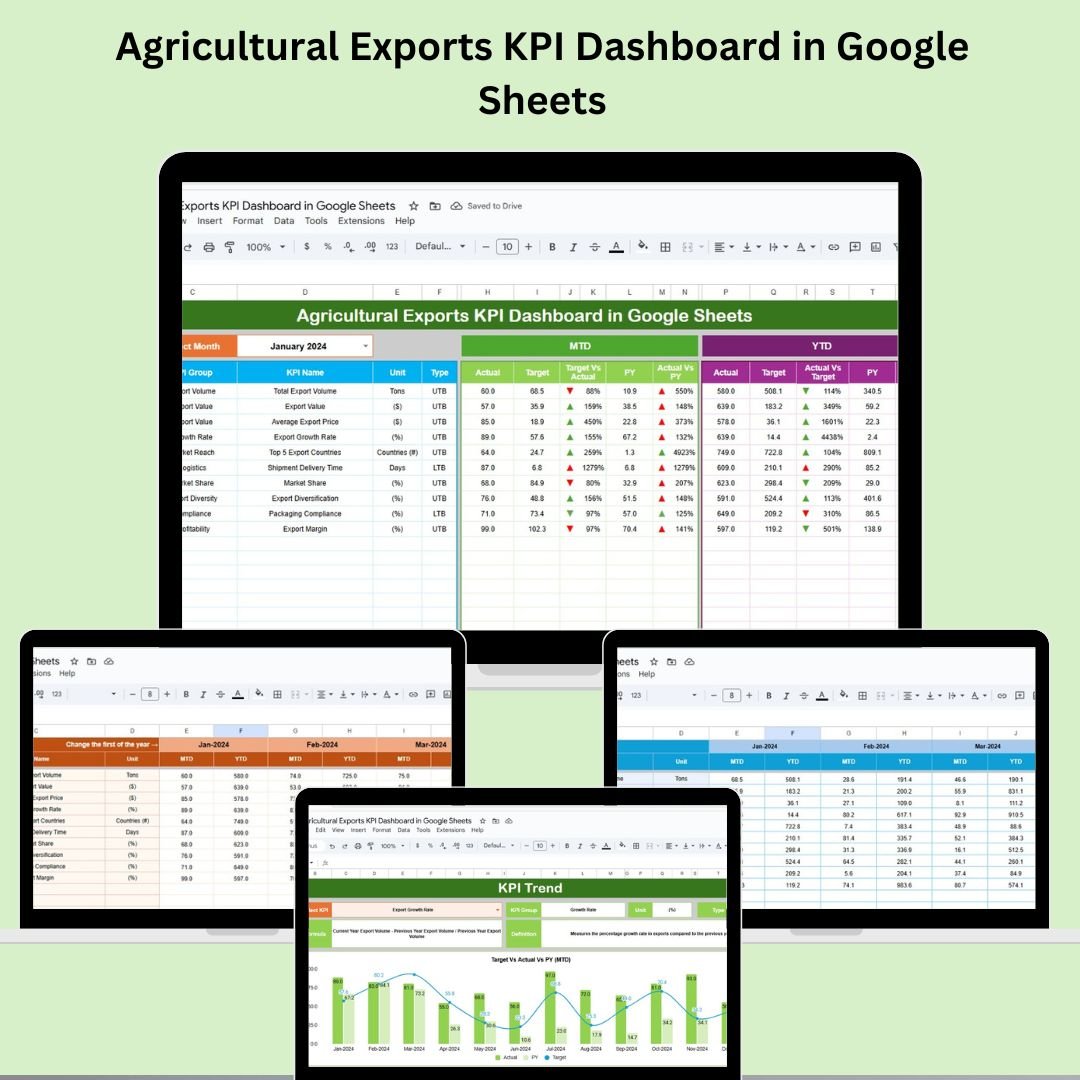
Managing agricultural exports is more than moving products—it’s about driving results. The Agricultural Exports KPI Dashboard in Google Sheets is your all-in-one solution to monitor performance, track export goals, and make strategic decisions backed by real-time data.
Designed for producers, exporters, cooperatives, and agribusiness stakeholders, this dashboard empowers you to visualize trends, optimize efficiency, and boost profitability—without needing any technical skills.
📊 Key Features of Agricultural Exports KPI Dashboard
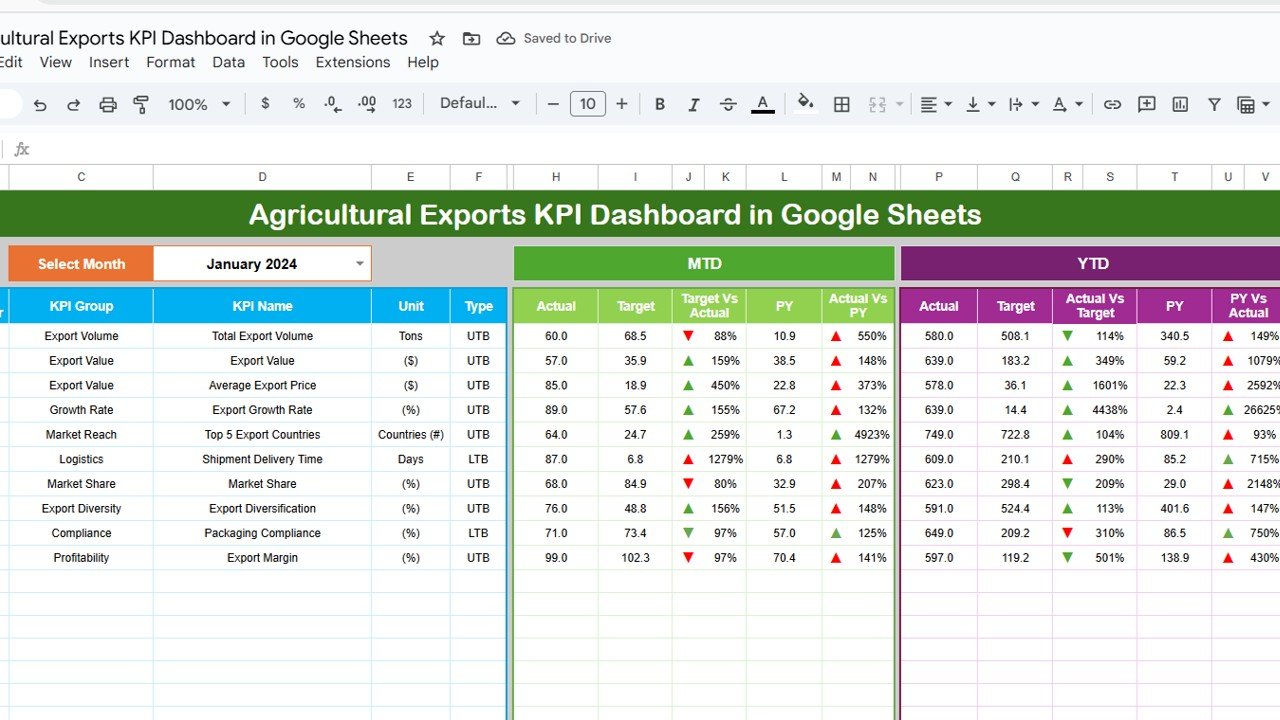
📌 MTD & YTD Performance Tracking
Easily compare Month-to-Date and Year-to-Date figures with:
-
Actual vs Target Values
-
Actual vs Previous Year
-
Automatic up/down arrows for performance clarity
📉 Dynamic Charts for Insightful Visualization
Gain instant clarity with charts like:
-
Total Export Volume by Product Type
-
Export Revenue vs Target
-
Export Growth by Region
-
Total Exports by Month
🔁 Auto-Update Functionality
Change the month in one click (Cell E1), and watch all KPIs update across the dashboard instantly.
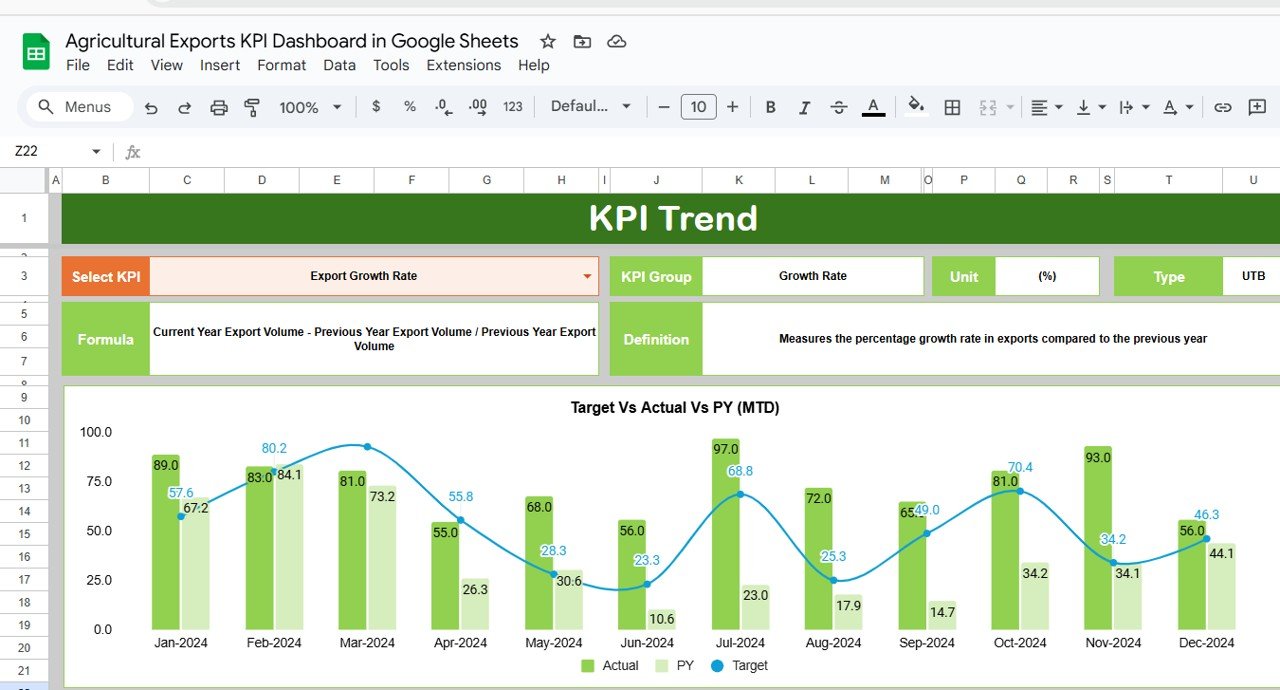
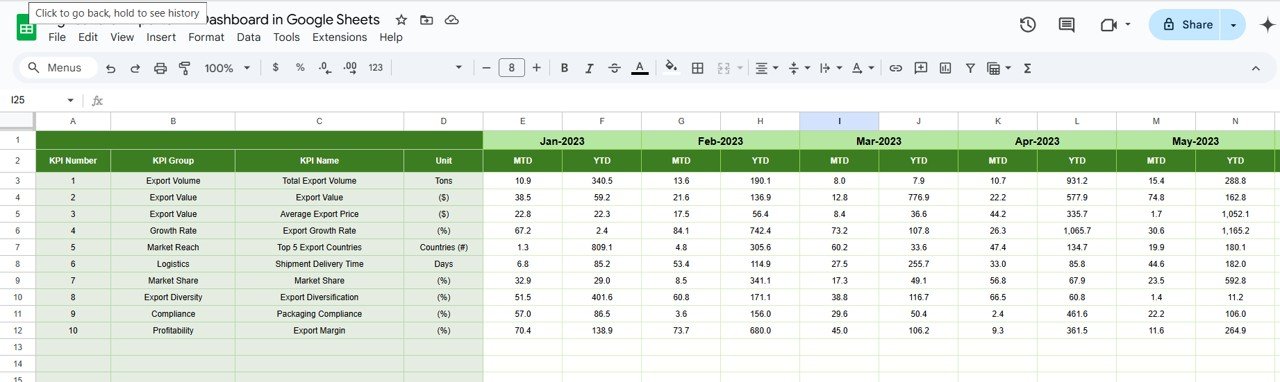
📊 KPI Trend Sheet
Select individual KPIs and monitor their movement over time. Each KPI includes:
-
Group, Unit, Type (UTB/LTB)
-
Formula and Definition for transparency
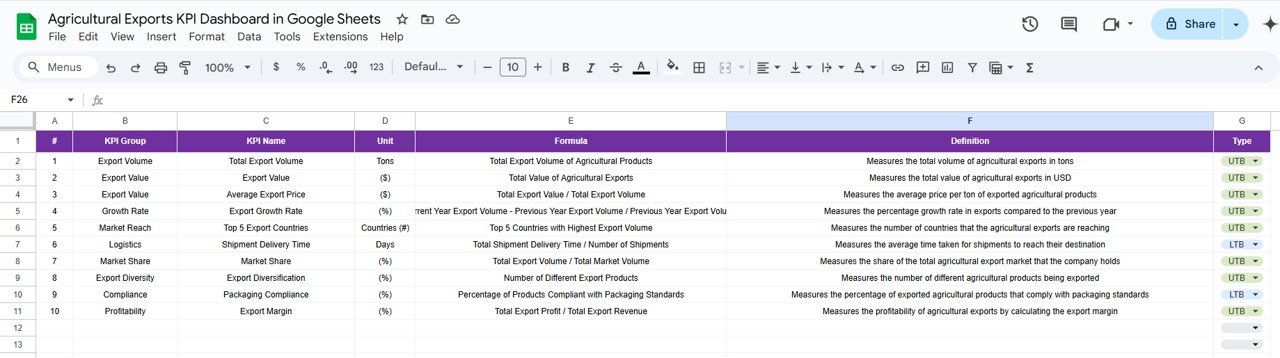
📋 KPI Definition Sheet
Stay consistent with a dedicated definition tab—your one-stop guide for KPI structure and tracking logic.
📦 What’s Inside the Dashboard?
This Google Sheets dashboard includes 6 professionally structured worksheets:
-
Dashboard Sheet – Real-time KPIs, goal comparison & charts
-
KPI Trend Sheet – Track performance history by KPI
-
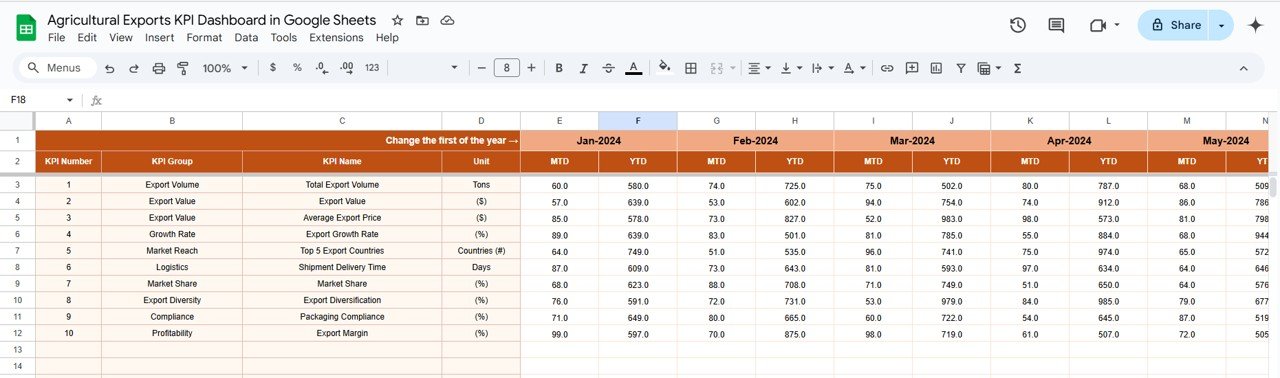
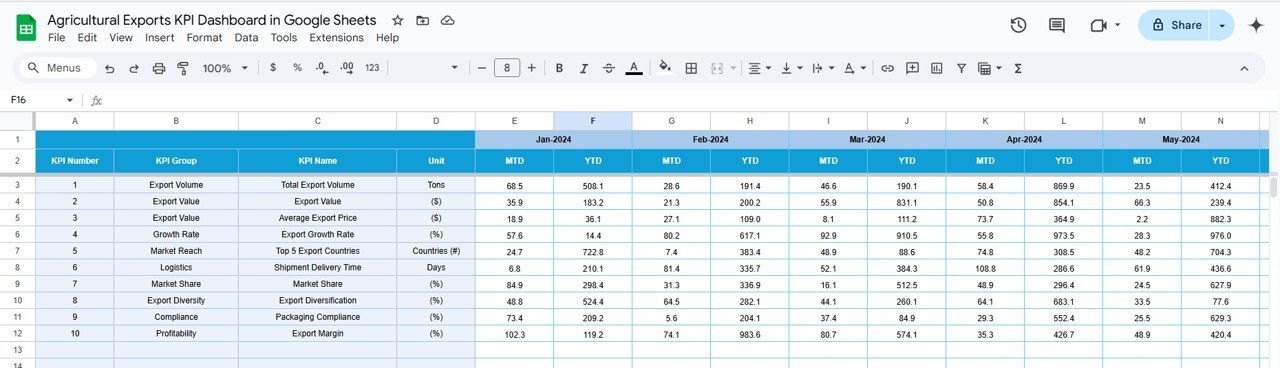
Actual Number Sheet – Enter current data by month
-
Target Sheet – Input KPI targets for better comparison
-
Previous Year Sheet – Add historical data for trend analysis
-
KPI Definition Sheet – Maintain formula transparency and uniformity
💡 Built-in dropdowns, formatting, and slicers make interaction smooth—even for non-tech users!
🚀 How to Use the Dashboard
🖊️ Step 1: Input export data in the Actual Number Sheet
🎯 Step 2: Set monthly and yearly targets in the Target Sheet
📈 Step 3: Add last year’s data for benchmark comparisons
📊 Step 4: Use the Dashboard and Trend tabs to analyze and plan
🔁 Step 5: Update regularly to keep performance metrics accurate
No coding required. No complex tools. Just smart data tracking in Google Sheets.
👩🌾 Who Can Benefit from This Dashboard?
🌍 Exporters & Trade Companies – Monitor volumes and revenue by region
📦 Agricultural Producers – Track product-wise export efficiency
🏢 Agri-Business Analysts – Analyze trends and optimize reporting
📊 Cooperative Societies – Align KPIs with growth goals
📈 Government & Policy Bodies – Support data-backed agricultural policies
💼 Logistics Teams – Track performance against time-sensitive targets
Whether you’re exporting rice, wheat, fruits, or vegetables, this dashboard keeps your data fresh and your decisions sharp.
🎯 Why You Need This Dashboard
✅ Built in Google Sheets – No special software required
✅ Fully Editable – Add KPIs, adjust formulas, or redesign views
✅ Real-Time Collaboration – Team members can edit live
✅ Monthly Controls – Easily switch month and view instant insights
✅ Zero Learning Curve – Designed for anyone to use
✅ Visually Clear – Arrows, charts, and highlights make insights obvious
🔍 Click here to read the Detailed blog post
Click here to read the Detailed blog post


Reviews
There are no reviews yet.