



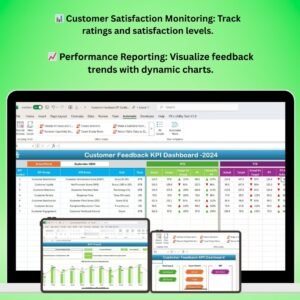
The Customer Feedback KPI Dashboard in Excel is a powerful tool designed for businesses looking to track and analyze customer feedback. With real-time insights into customer satisfaction, complaints, ratings, and overall sentiment, this dashboard helps businesses enhance their customer service and make data-driven decisions.
This Excel-based dashboard provides a comprehensive view of customer feedback, enabling businesses to assess the quality of their products, services, and customer interactions. It is perfect for teams focused on customer experience, quality assurance, and performance improvement, providing key insights that help in optimizing customer satisfaction and loyalty.
Key Features of the Customer Feedback KPI Dashboard in Excel
📊 Customer Satisfaction Tracking
Monitor customer satisfaction levels across various touchpoints. Track and visualize customer ratings, feedback, and overall satisfaction scores to assess service quality.
💬 Feedback Categorization
Categorize customer feedback by type, such as positive feedback, complaints, suggestions, and requests. This helps businesses prioritize areas for improvement and recognize strengths.
📅 Time-Based Performance Monitoring
Track customer feedback performance over time (weekly, monthly, quarterly). Analyze trends and identify patterns that can help in fine-tuning customer service strategies.
📈 Visual Reporting & Analysis
Use charts, graphs, and tables to visualize key performance metrics (KPIs). Track customer sentiment and satisfaction trends to understand how different factors impact overall customer experience.
⚙️ Customizable KPIs & Metrics
Tailor the dashboard to suit your business needs. Customize KPIs such as response time, issue resolution rate, and overall feedback volume to track what matters most for your organization.
🔄 Complaint & Issue Tracking
Track customer complaints and service issues through every stage, from identification to resolution. Ensure that issues are addressed promptly to improve customer experience.
Why You’ll Love the Customer Feedback KPI Dashboard in Excel

✅ Enhance Customer Experience
Track customer feedback across various channels to improve your products, services, and customer support. Use insights to optimize customer satisfaction and resolve issues quickly.
✅ Monitor Performance & Trends
Analyze customer feedback performance over time. Track KPIs and trends to understand how your team’s efforts impact customer experience and identify areas for improvement.
✅ Actionable Insights for Improvement
Categorize and analyze feedback to uncover insights that can drive business decisions. Prioritize key areas of improvement and take action to enhance customer service.
✅ Improve Issue Resolution Efficiency
Track complaints and service issues from start to finish. Ensure that all customer concerns are addressed promptly and effectively.
✅ Fully Customizable for Your Needs
Customize the dashboard to fit your unique customer feedback goals. Track specific KPIs, adjust categories, and measure the metrics that matter most to your business.
What’s Inside the Customer Feedback KPI Dashboard in Excel?
- Customer Satisfaction Tracking: Monitor satisfaction levels and customer ratings.
- Feedback Categorization: Track feedback by positive, negative, and neutral categories.
- Time-Based Monitoring: Analyze feedback trends over different time periods.
- Complaint & Issue Tracking: Track complaints, issues, and resolutions.
- Visual Reporting: Use graphs and charts to visualize feedback trends and KPIs.
- Customizable Metrics: Adjust the dashboard to fit your business’s unique feedback tracking needs.
How to Use the Customer Feedback KPI Dashboard in Excel
1️⃣ Download the Template: Get immediate access to the Customer Feedback KPI Dashboard in Excel.
2️⃣ Input Customer Feedback Data: Add customer ratings, feedback, and complaints to the dashboard.
3️⃣ Customize KPIs & Categories: Set up KPIs such as satisfaction scores, complaint resolution rates, and feedback volume.
4️⃣ Track Performance & Analyze Trends: Monitor customer satisfaction and performance trends over time.
5️⃣ Take Action Based on Insights: Use the data to identify areas for improvement and optimize customer service strategies.
Who Can Benefit from the Customer Feedback KPI Dashboard in Excel?
🔹 Customer Experience Teams & Managers
🔹 Customer Service & Support Teams
🔹 Marketing & Product Teams
🔹 Business Owners & Entrepreneurs
🔹 Quality Assurance Teams
🔹 E-commerce & Retail Businesses
Optimize your customer experience efforts and stay aligned with customer expectations using the Customer Feedback KPI Dashboard in Excel. Track key performance metrics, analyze feedback trends, and improve customer satisfaction by acting on real-time data.
Click here to read the Detailed blog post
Visit our YouTube channel to learn step-by-step video tutorials
Youtube.com/@PKAnExcelExpert
Compatibility and Requirements
- Works in Microsoft Excel desktop (Excel 2016 or later, or Microsoft 365).
- Charts, graphs and tables are built into the workbook, so there is nothing else to install.
- New to Excel charts? Microsoft explains the basics in Create a chart from start to finish.
Frequently Asked Questions
What does the Customer Feedback KPI Dashboard track?
Customer satisfaction, ratings, feedback by category, complaints and issue resolution, shown in charts, graphs and tables.
Can I see trends over time?
Yes. Feedback can be reviewed by weekly, monthly and quarterly periods.
Can I change the KPIs?
Yes. You can customize KPIs such as response time, issue resolution rate and feedback volume.
Are there related feedback templates?
Yes. The Customer Feedback Analysis Dashboard in Excel and the Customer Feedback Tracker in Excel cover analysis and day to day logging.
Related Customer Feedback Templates
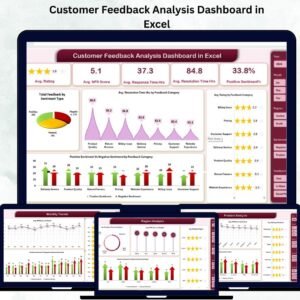
- Customer Feedback Analysis Dashboard in Excel: deeper feedback analysis
- Customer Feedback Analysis Dashboard in Google Sheets: for teams that work online
- Customer Feedback Tracker in Excel: log feedback as it comes in
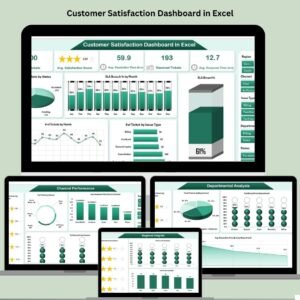
- Customer Satisfaction Dashboard in Excel: satisfaction scores in one view
- KPI Dashboard Library (Excel): 15 Excel KPI dashboards in one bundle
Browse all Excel KPI dashboards or the Excel sales and marketing templates.





























Reviews
There are no reviews yet.