

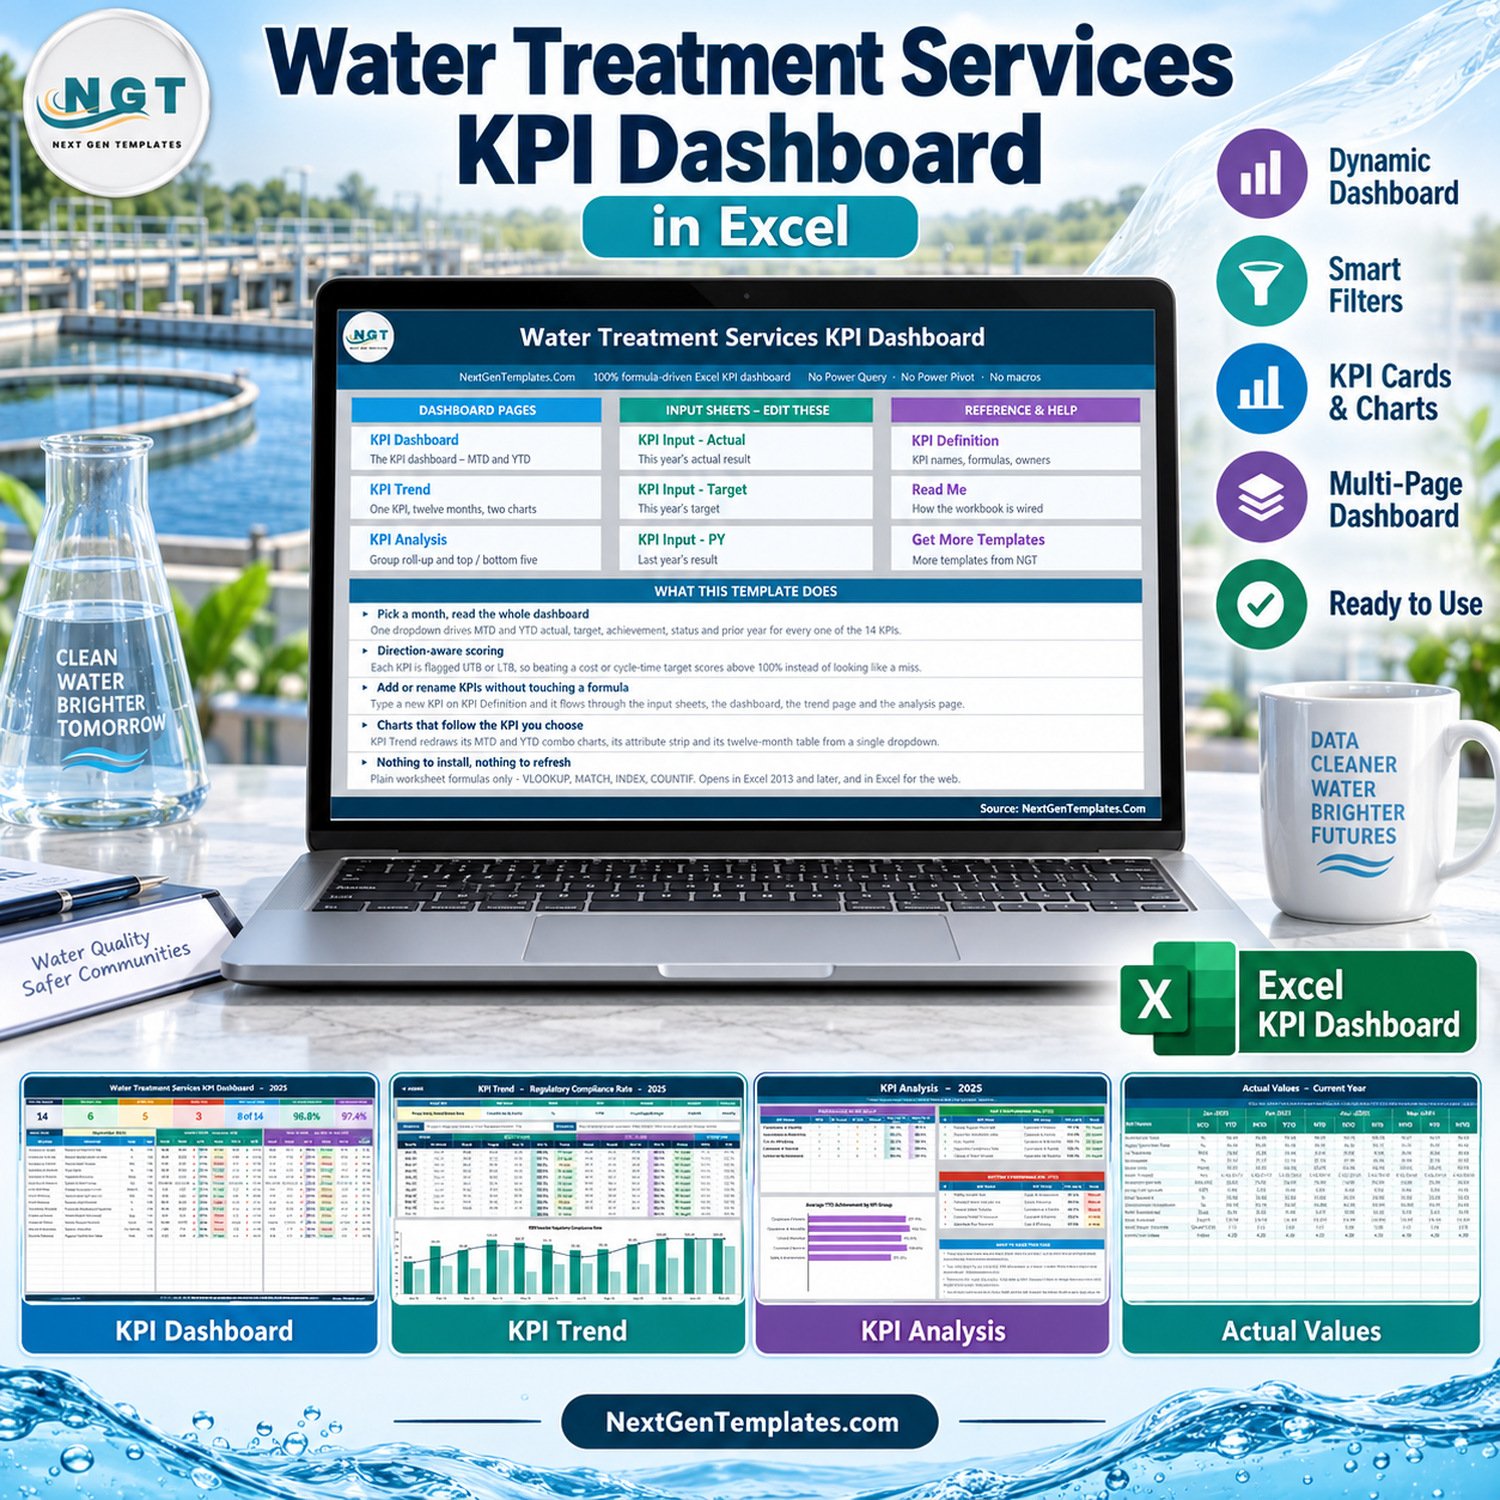
Water Treatment Services KPI Dashboard in Excel gives operations and compliance teams one workbook for 14 defined KPIs across four groups: Compliance & Quality, Operations & Reliability, Cost & Efficiency, and Safety & Environment/Customer & Service. It combines month-to-date and year-to-date actuals, targets, prior-year values, achievement, and status in one formula-driven view. You receive the editable Excel workbook plus a user manual, with no macros, Power Query, or Power Pivot required. Review the screenshots and definitions before purchase; the template supports structured performance tracking but does not replace laboratory, regulatory, engineering, or safety systems.
Key Features of Water Treatment Services KPI Dashboard in Excel
- 14 water-treatment KPIs: Track regulatory compliance, effluent sample pass rate, treated-water turbidity, plant uptime, downtime, water volume, energy and chemical cost efficiency, maintenance, safety, and service measures.
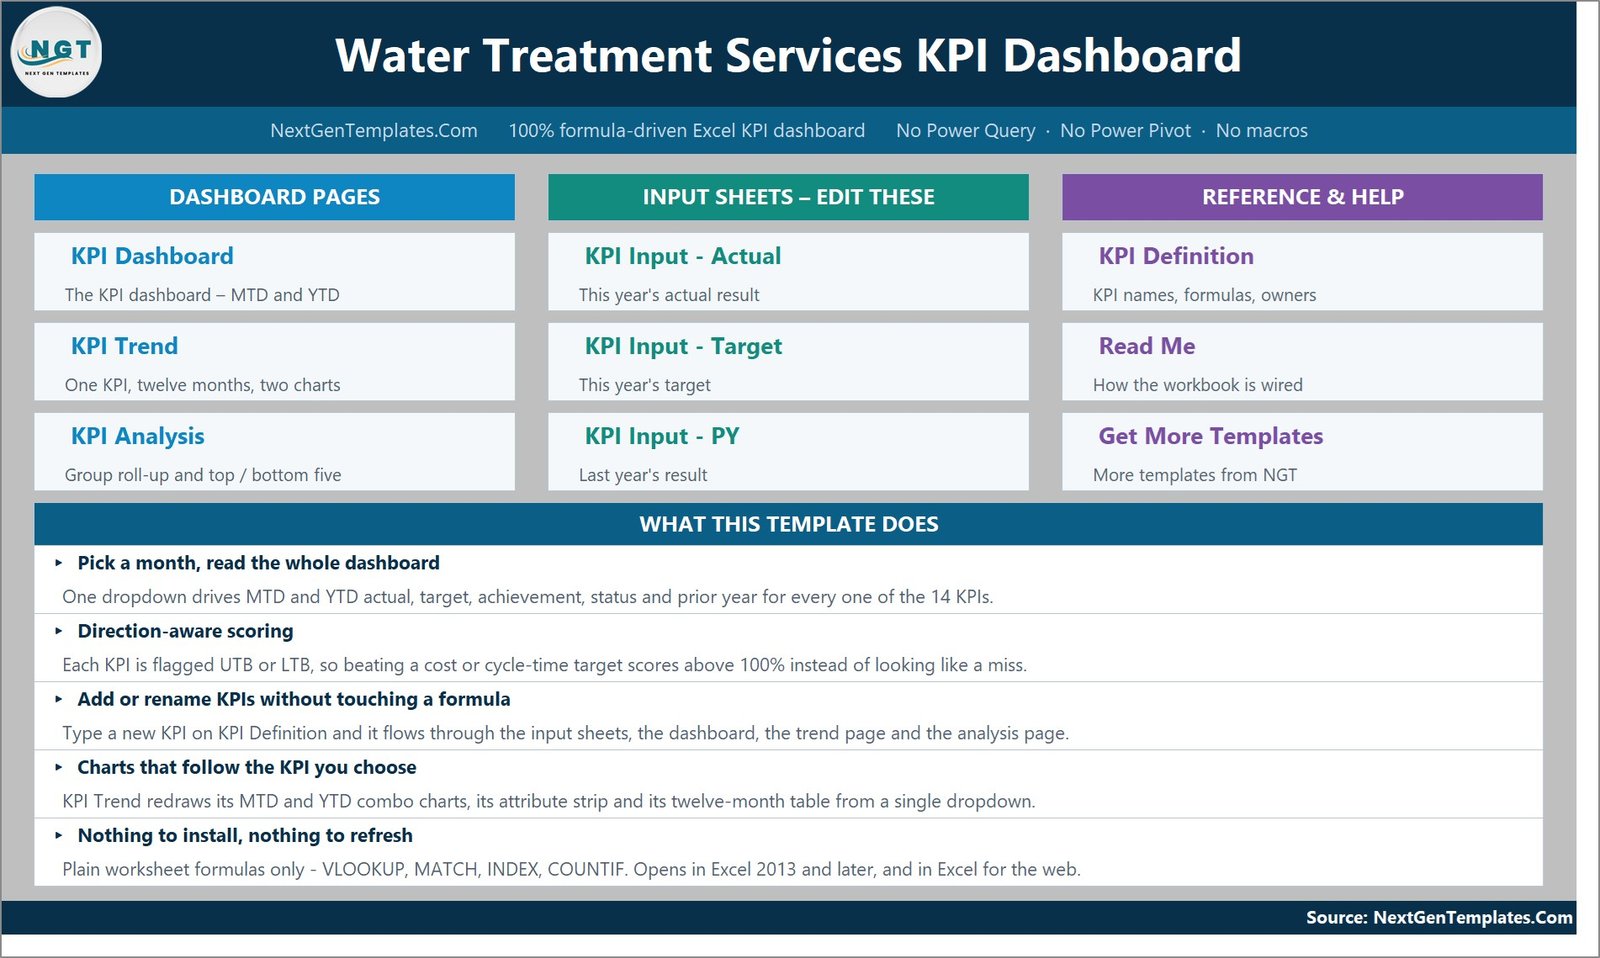
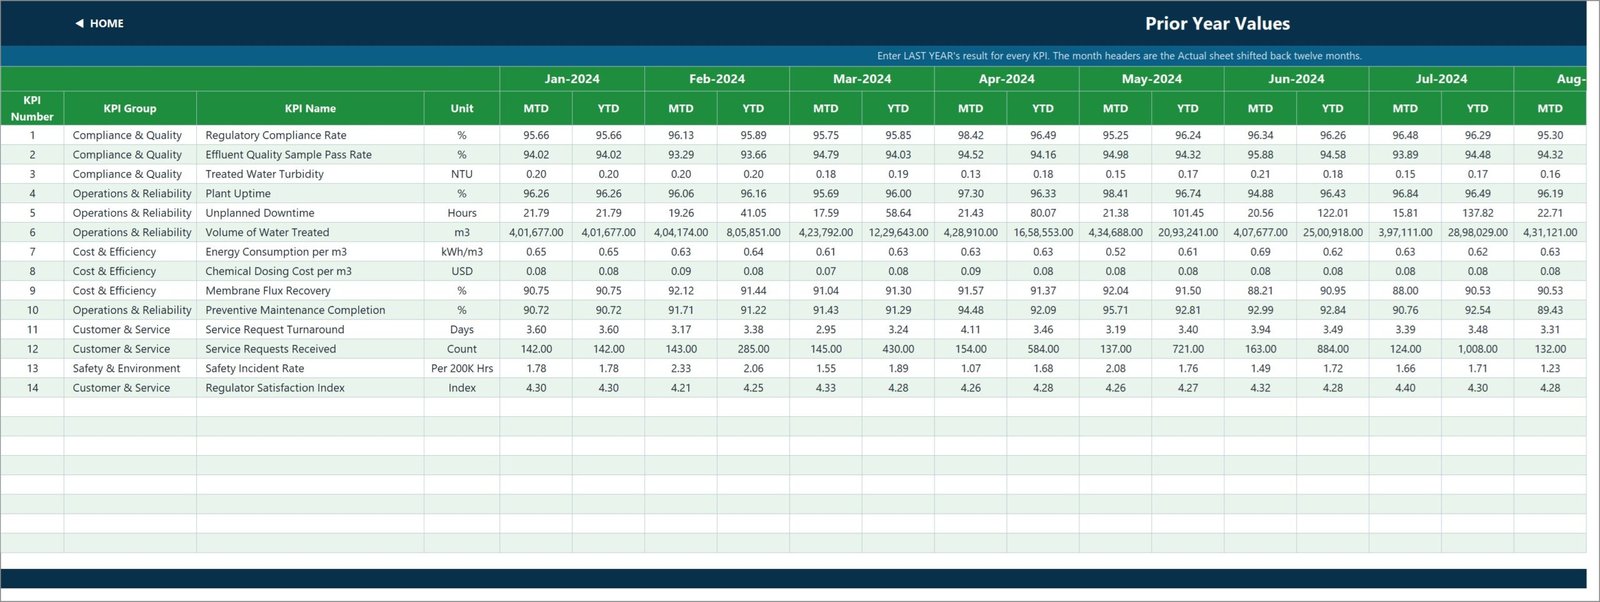
- MTD and YTD views: Compare actual, target, prior-year, achievement percentage, and status for the selected reporting month.
- Direction-aware scoring: Upper-the-better and lower-the-better logic makes cost, incident, and cycle-time KPIs score correctly.
- Traffic-light status: On Target, At Risk, and Missed classifications make exceptions easy to spot.
- KPI trend analysis: Select one KPI to review monthly MTD and YTD movement with two charts and a twelve-month table.
- Group and rank analysis: Review KPI-group performance plus the top five and bottom five KPIs.
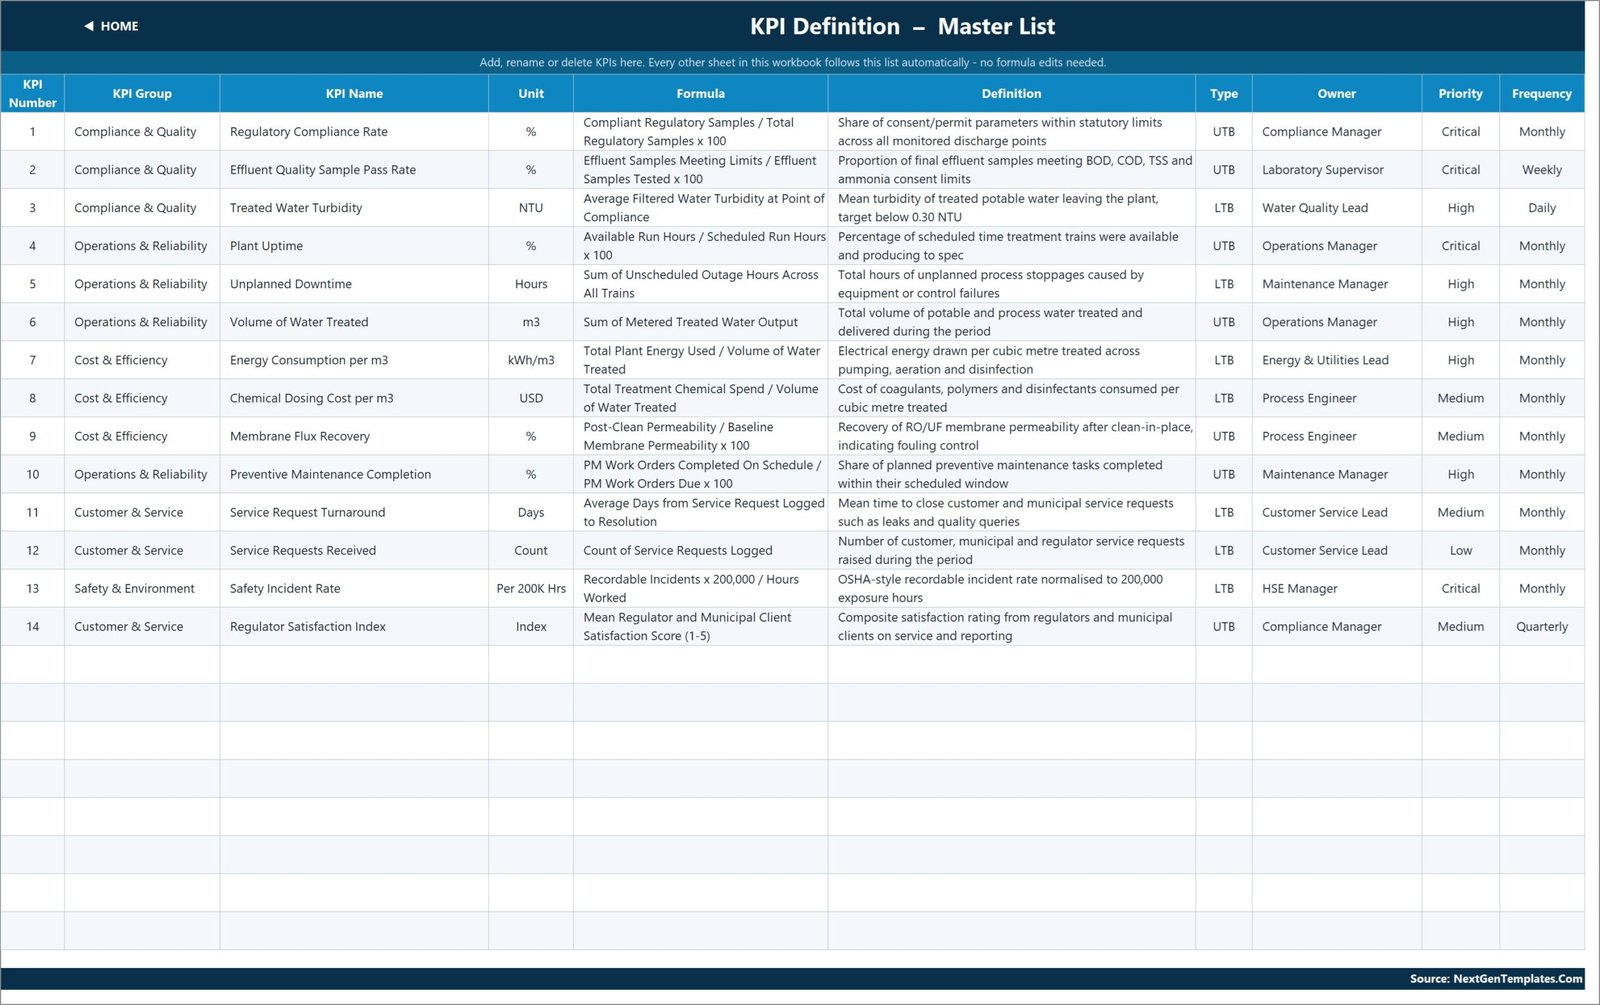
- Editable definitions: Change KPI names, formulas, units, owners, priorities, frequency, and UTB/LTB type without rebuilding dashboard formulas.
- Plain Excel workflow: Formula-driven design works without macros and is ready for your monthly data.
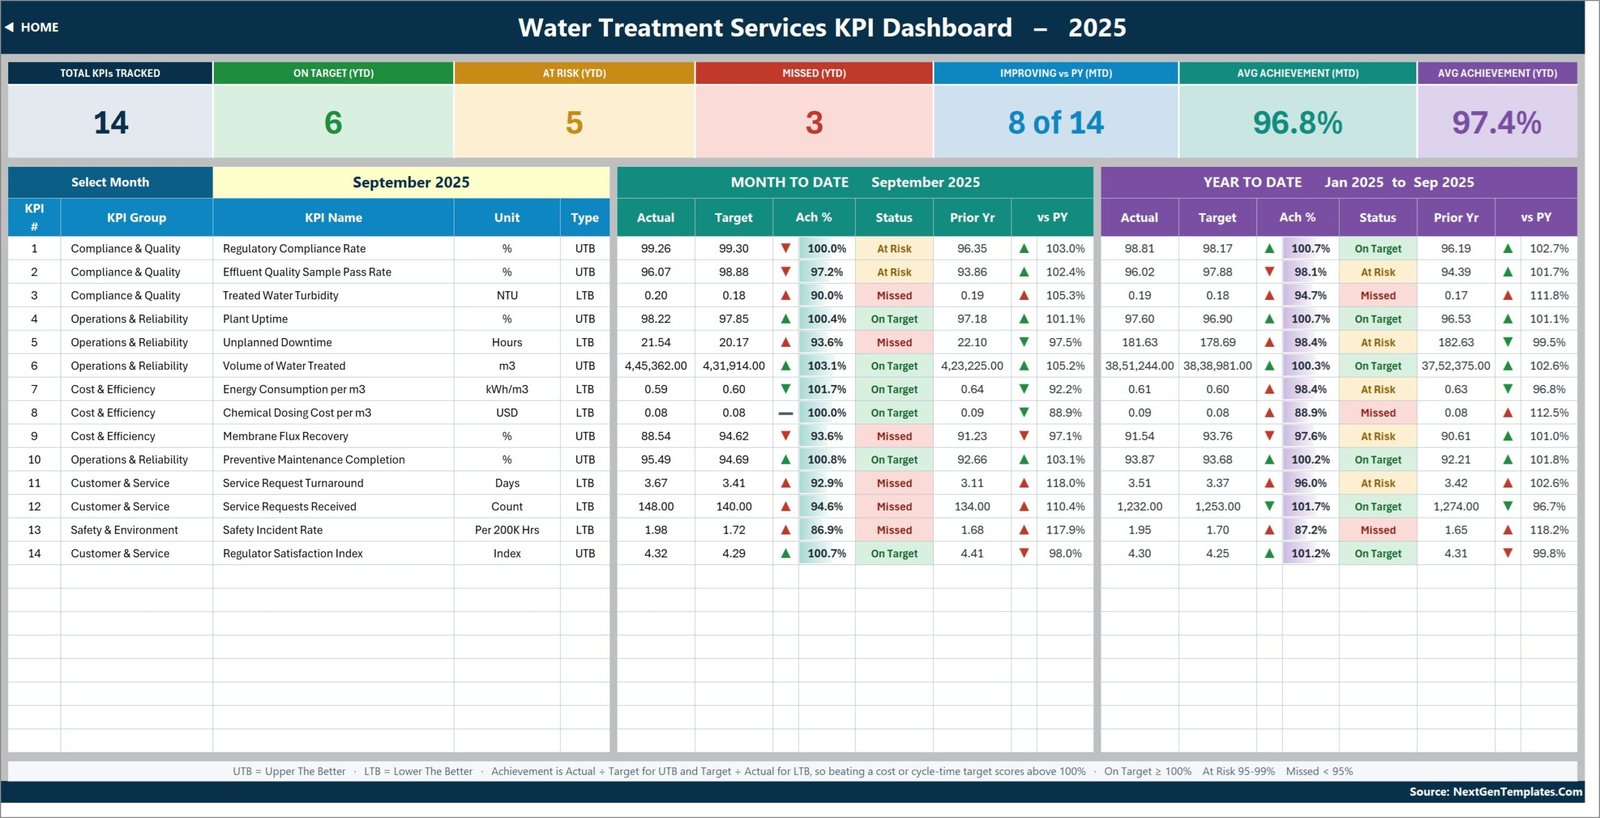
Dashboard view with selected-month MTD and YTD performance.
What’s Inside the Water Treatment Services KPI Dashboard in Excel
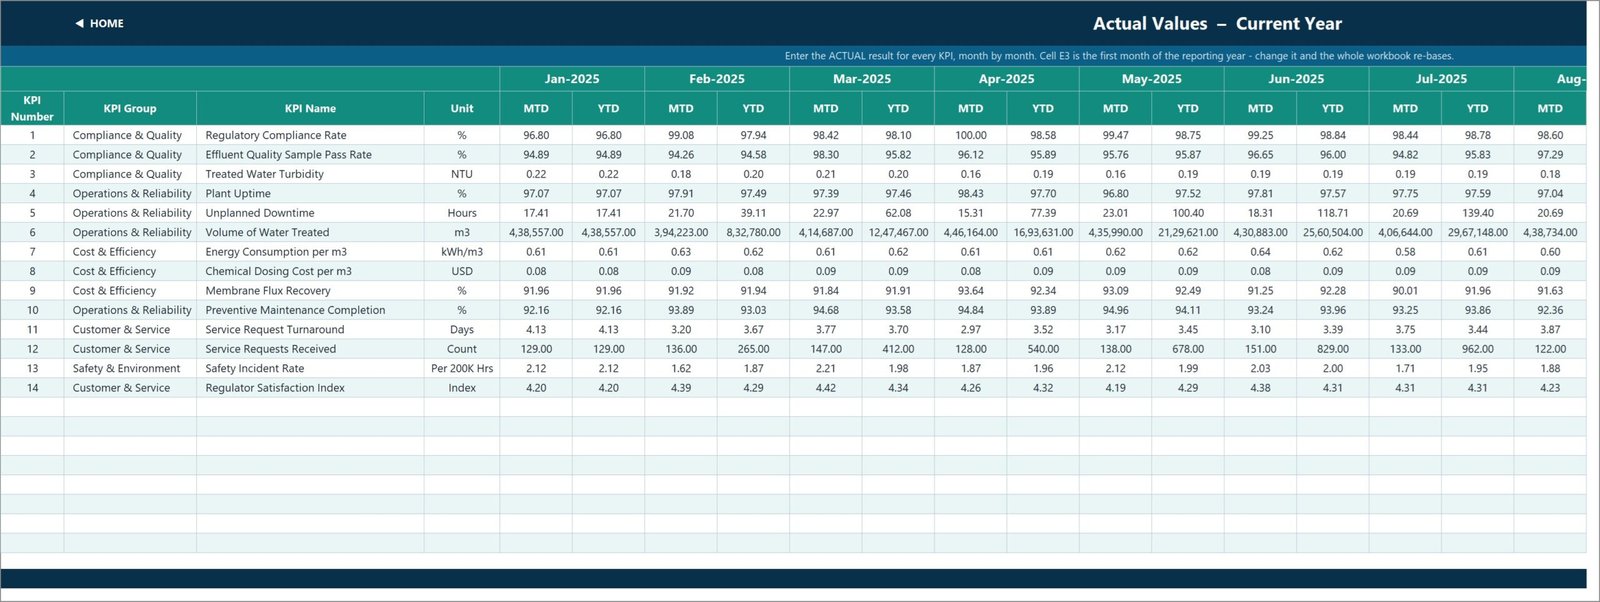
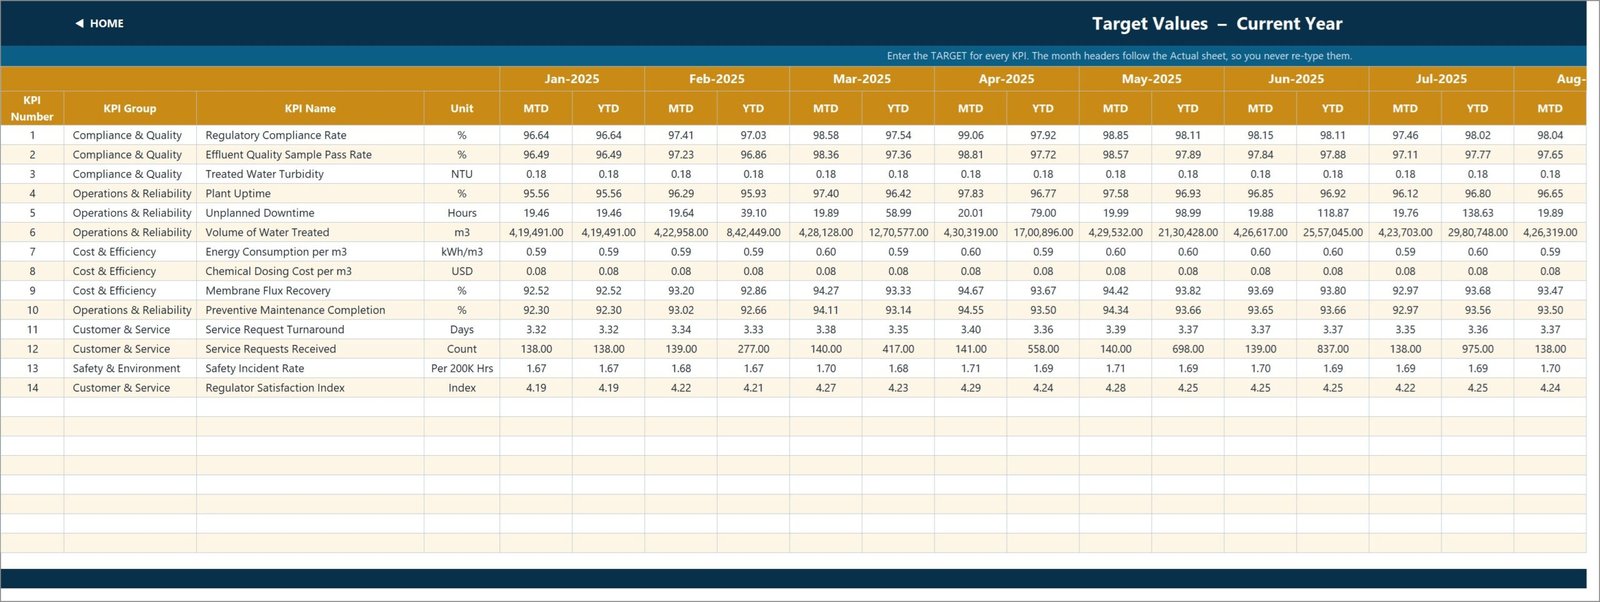
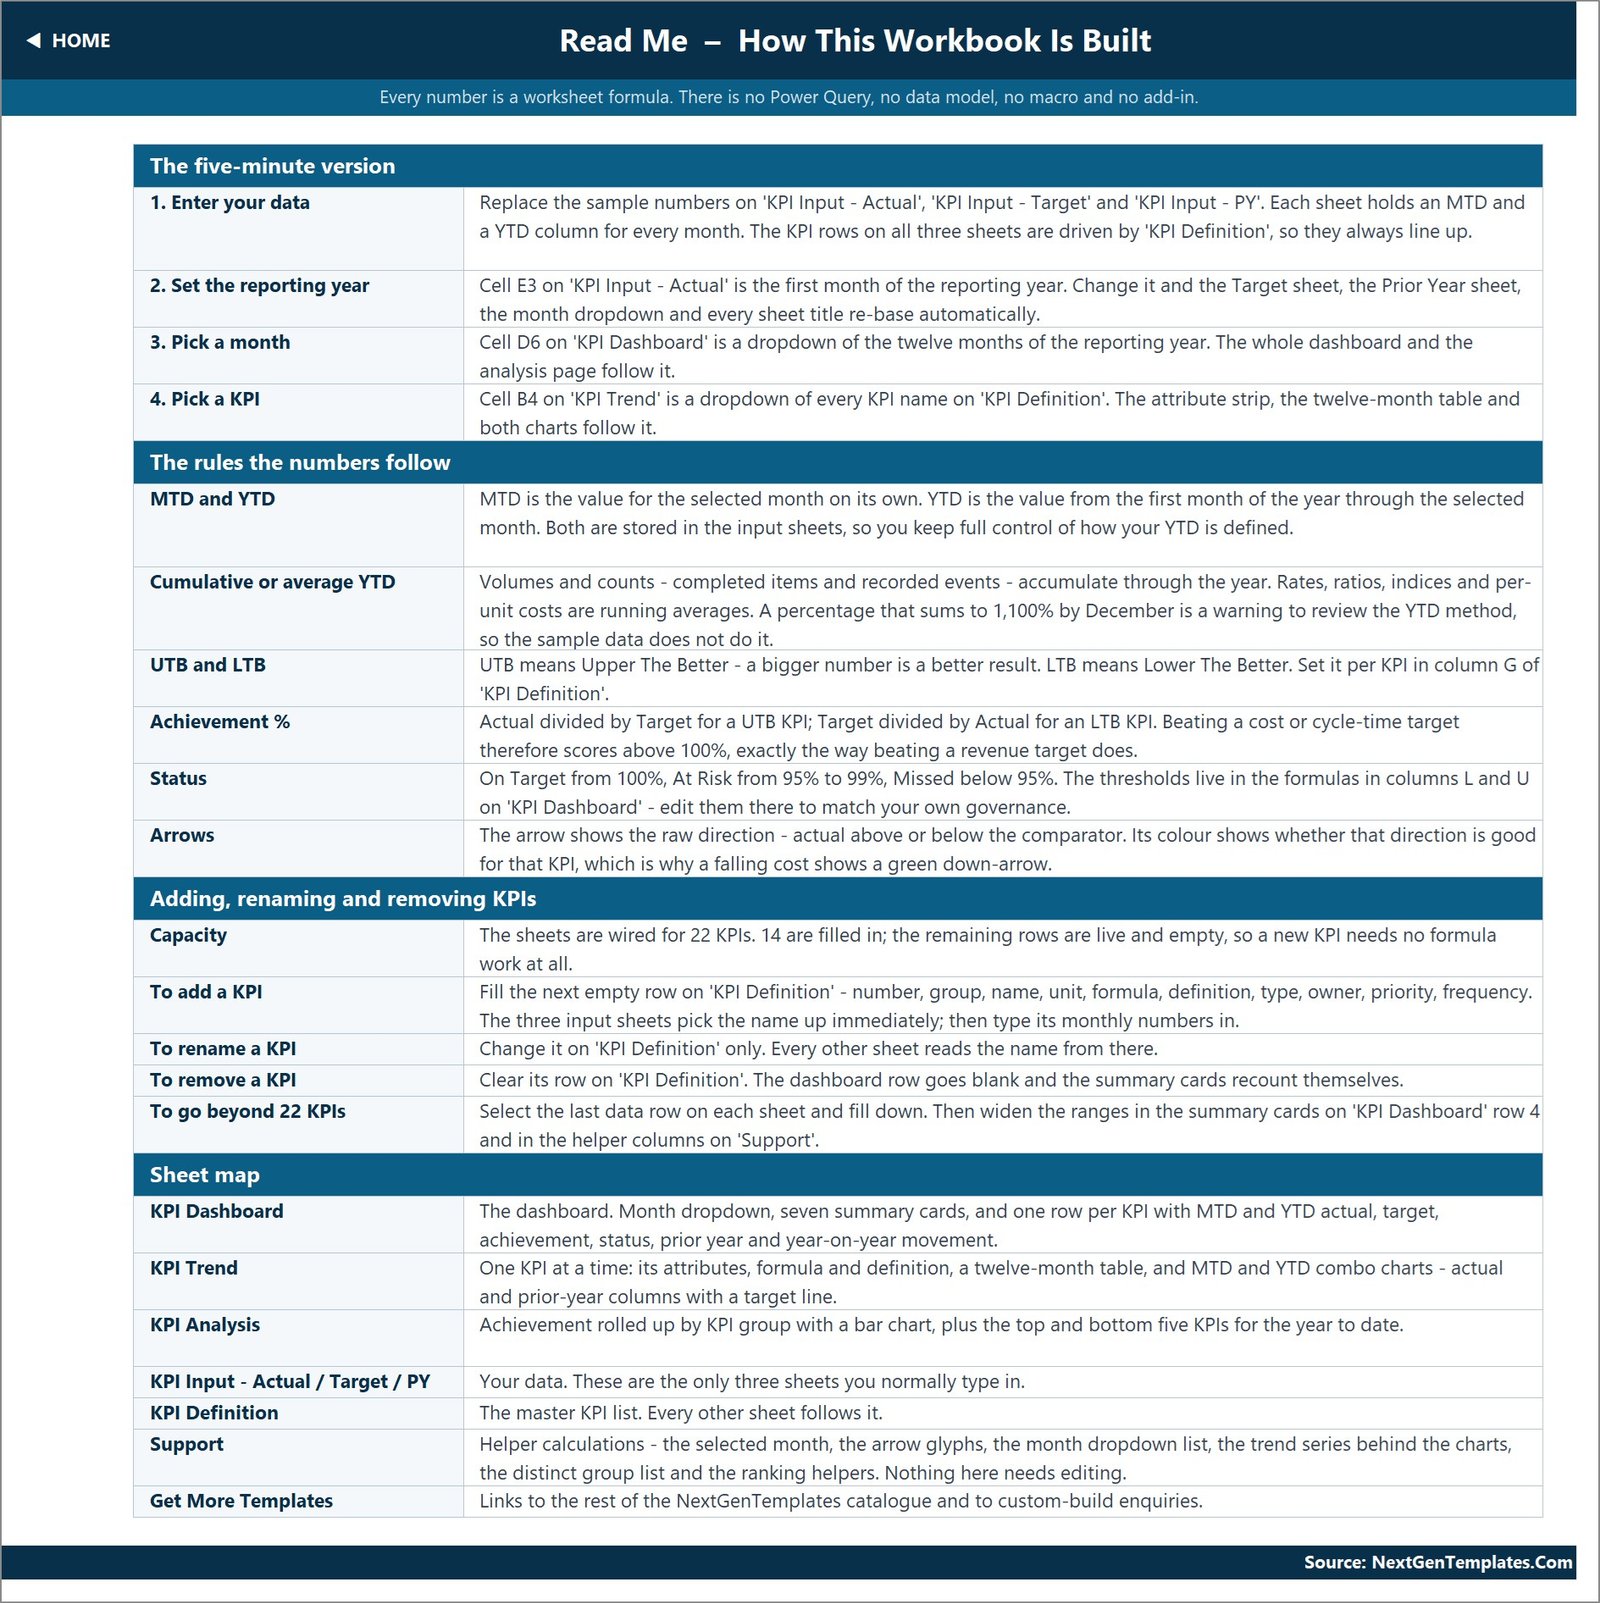
The workbook contains a Home page, KPI Dashboard, KPI Trend, KPI Analysis, three editable input sheets for actual, target, and prior-year values, a KPI Definition master list, a Support sheet, Read Me guidance, and a templates reference page. This water treatment operations dashboard currently includes sample data so you can understand the flow before replacing it with your own figures.
The Excel KPI dashboard for water treatment includes practical measures such as Regulatory Compliance Rate, Effluent Quality Sample Pass Rate, Treated Water Turbidity, Plant Uptime, Unplanned Downtime, Volume of Water Treated, Energy Consumption per m3, Chemical Dosing Cost per m3, Membrane Flux Recovery, Preventive Maintenance Completion, Service Request Turnaround, Service Requests Received, Safety Incident Rate, and Regulator Satisfaction Index.
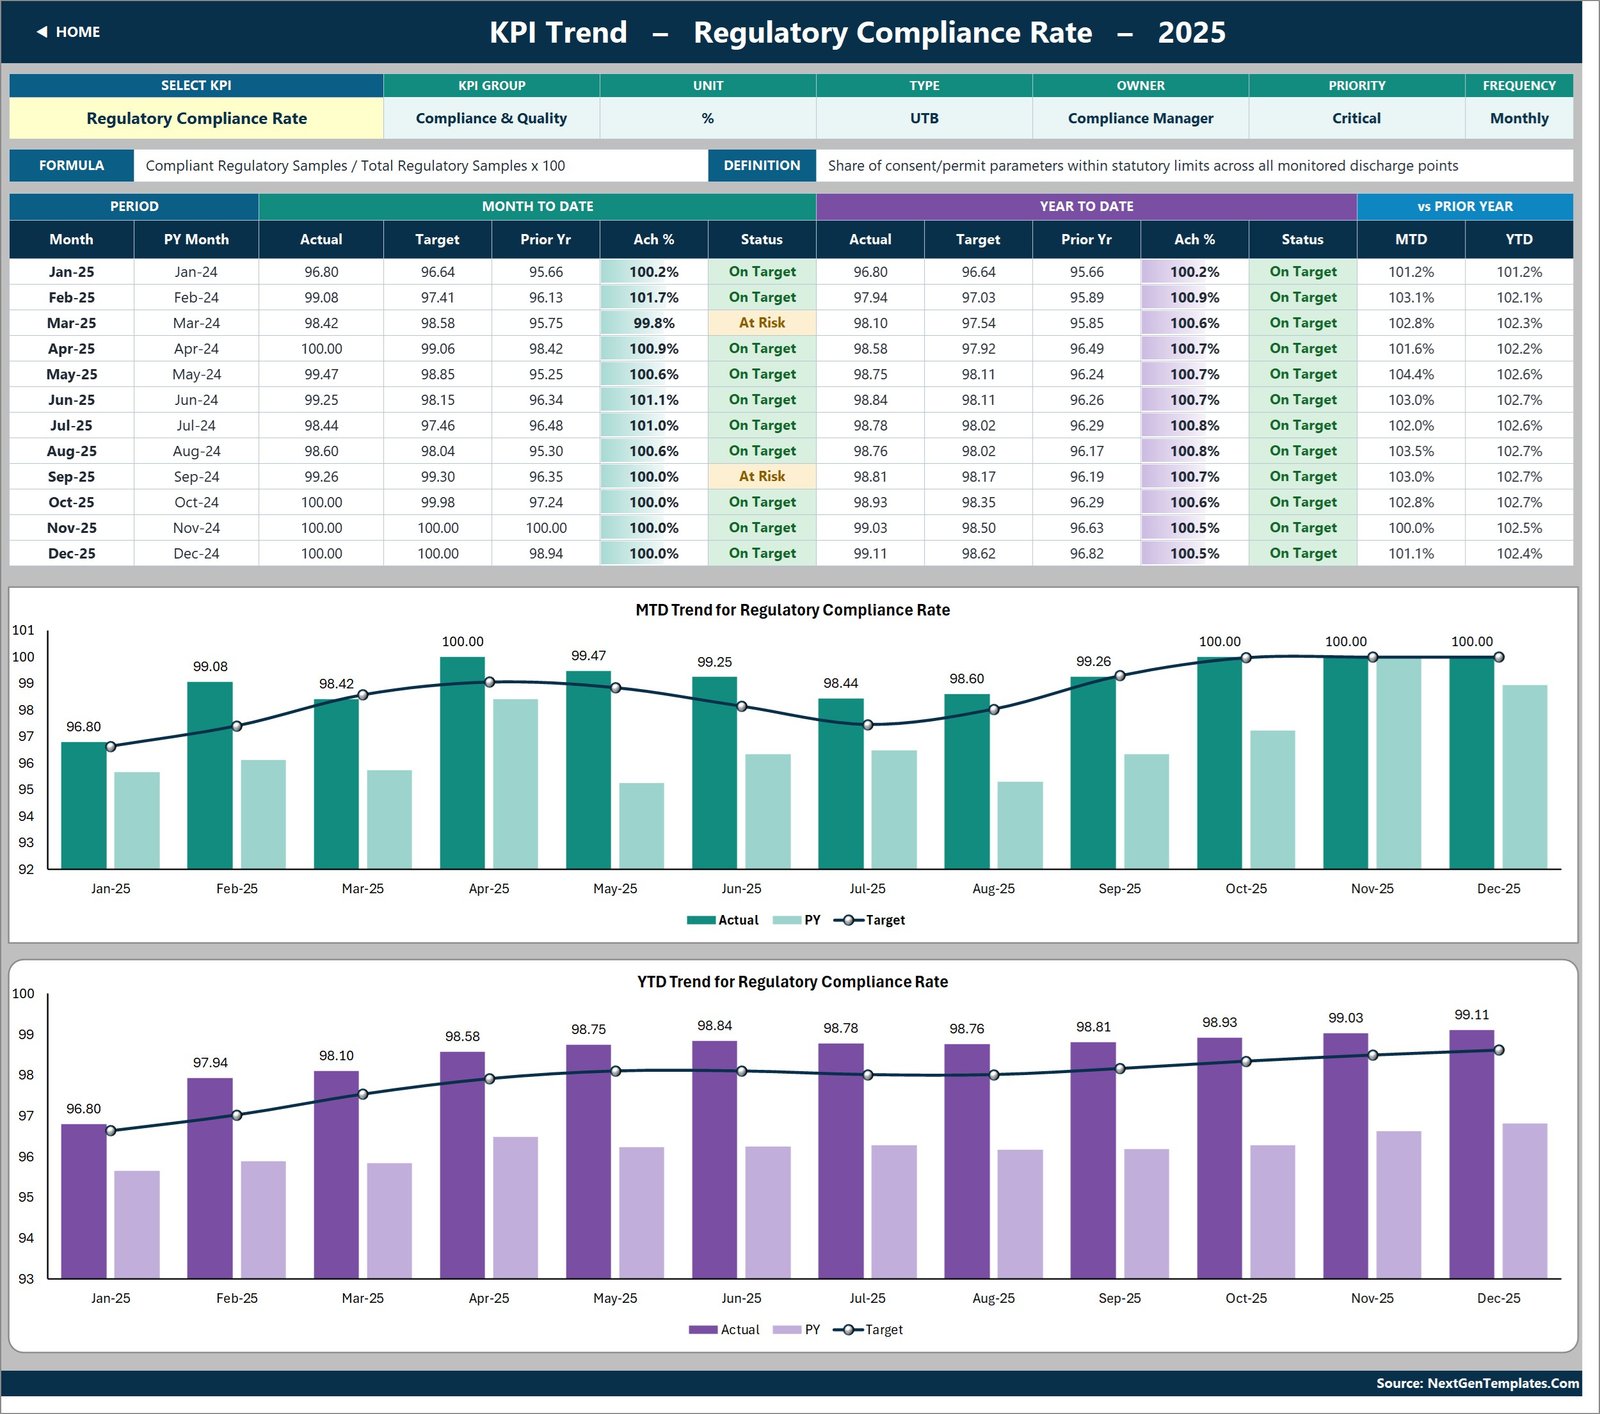
KPI Trend page for a selected measure.
Water Treatment Services KPI Dashboard in Excel vs. Google Sheets vs. Paid CMMS/SaaS – Where This Fits
| Factor | This Excel template | Google Sheets alternative | Paid CMMS/SaaS |
|---|---|---|---|
| Cost | One-time template purchase | Template or setup cost | Usually recurring subscription |
| Platform | Microsoft Excel | Browser-based Google Sheets | Vendor platform |
| Setup | Replace sample monthly inputs | Copy and configure a sheet | Implementation and user setup |
| Collaboration | File-based or shared via Microsoft 365 | Native simultaneous editing | Role-based multi-user access |
| Custom fields | Editable KPI master list | Editable cells and formulas | Depends on plan and permissions |
| Water-treatment focus | 14 included operational KPIs | Depends on the chosen template | May require configuration |
| Automation | Worksheet formulas; no macros | Sheet formulas/scripts vary | Integrations may be available |
Who This Template Is For – and Who It’s Not For
This water treatment KPI template is designed for plant managers, operations leads, compliance teams, laboratory supervisors, maintenance managers, process engineers, HSE teams, and municipal or contract water-service managers who already collect monthly performance figures. It is especially useful when reporting is spread across separate worksheets and teams need a consistent review page.
It is not a SCADA, LIMS, CMMS, sampling, billing, telemetry, or regulatory-submission system. It does not automatically import readings or certify compliance. Organisations needing live sensor integration, audit workflows, access controls, or controlled records should use their approved operational systems and treat this workbook as a management-reporting layer.
How to Use the Water Treatment Services KPI Dashboard in Excel
- Open the workbook in Microsoft Excel and read the Home and Read Me pages.
- Review the KPI Definition sheet and edit names, units, formulas, owners, priorities, frequencies, and UTB/LTB types where needed.
- Replace sample monthly values in KPI Input – Actual, KPI Input – Target, and KPI Input – PY.
- Select the reporting month on the KPI Dashboard.
- Review MTD/YTD achievement and traffic-light status, then use KPI Trend and KPI Analysis for follow-up.
- Save a controlled copy according to your organisation’s reporting process.
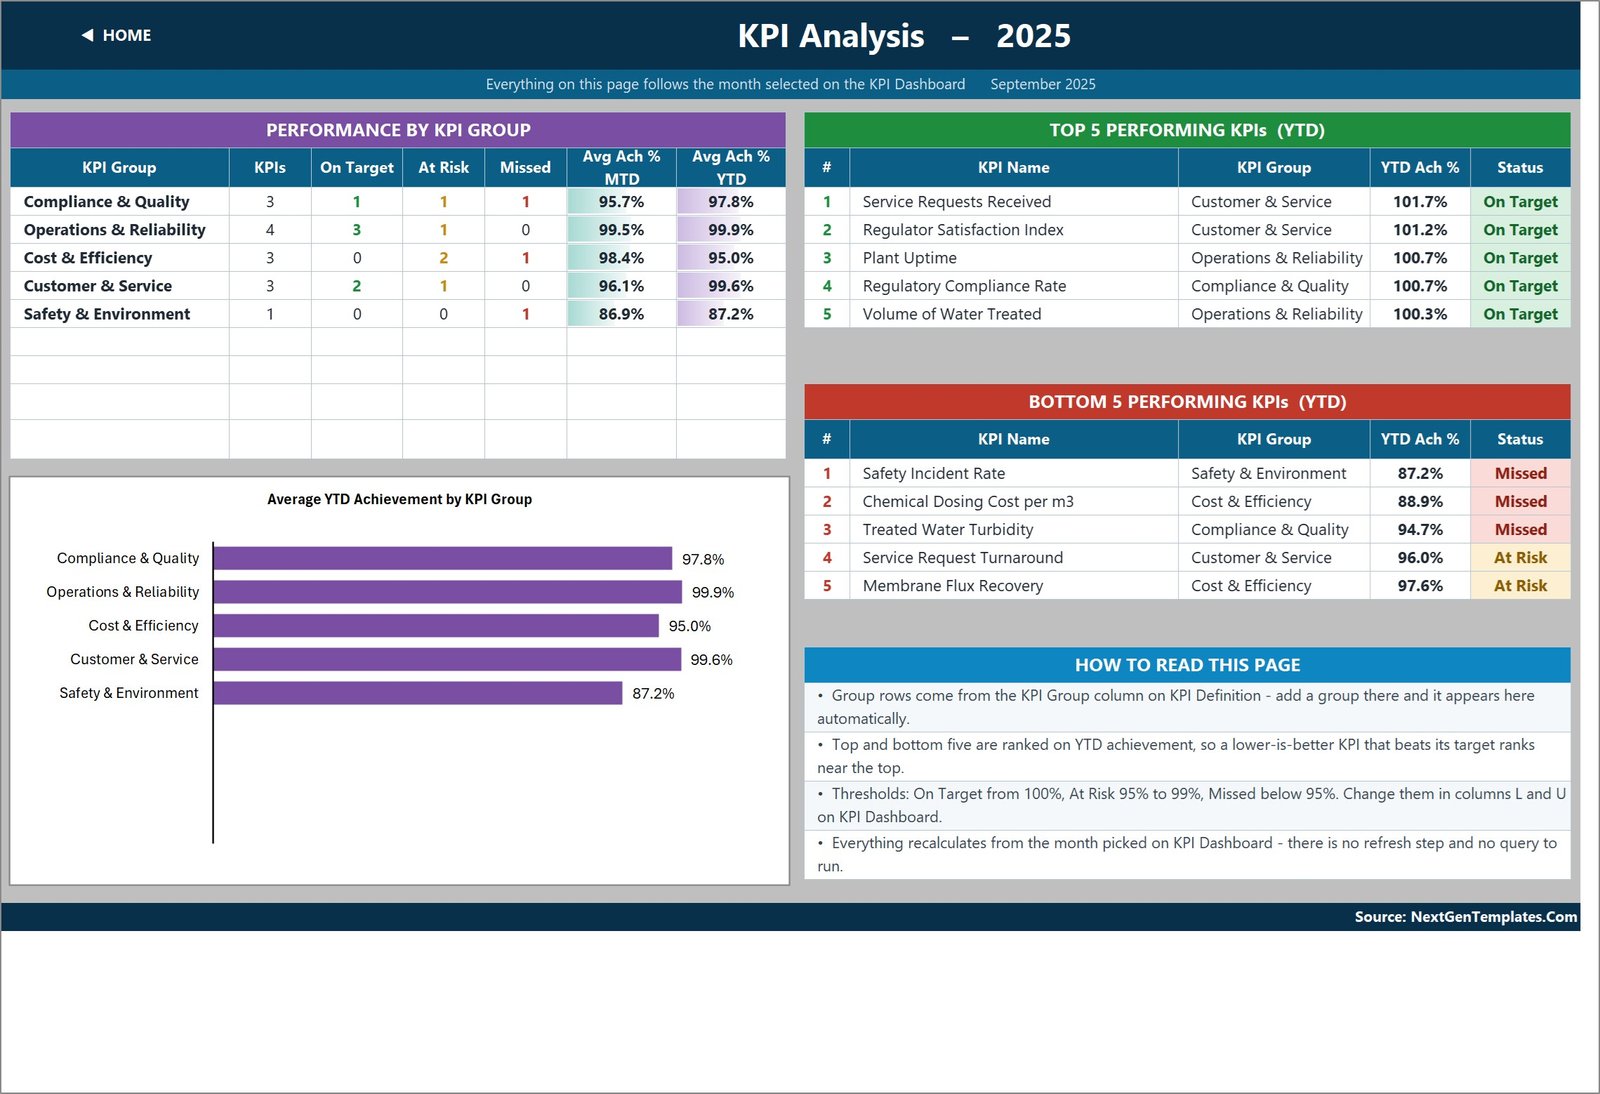
KPI Analysis highlights group performance and ranked exceptions.
Real-World Use Cases
Plant operations manager: Review uptime, unplanned downtime, treated-water volume, energy consumption, and preventive maintenance completion in a monthly operations meeting.
Compliance and laboratory lead: Combine compliance rate, sample pass rate, turbidity, and regulator satisfaction for a consistent management review while keeping laboratory records in the approved source system.
Contract water-service manager: Use water treatment performance tracking to compare service turnaround, request volumes, safety, cost, and quality trends before preparing a client report.
Frequently Asked Questions
Does the workbook use macros?
No. The supplied workbook is formula-driven and does not require VBA, Power Query, or Power Pivot.
Can I rename or add KPIs?
Yes. The KPI Definition master list is editable, and the workbook is designed so dashboard, trend, analysis, and input sheets follow that list. Preserve the workbook structure and test changes on a copy.
How many KPIs are included?
The included setup contains 14 water-treatment KPIs with names, formulas, definitions, direction, owner, priority, and frequency fields.
Does it connect directly to plant systems?
No. Enter or paste monthly actual, target, and prior-year values into the input sheets. Integration is not included.
Is this a compliance certificate or laboratory record?
No. It is a management dashboard. Validate data and reporting obligations through your approved regulatory and technical processes.
What files are included?
The download ZIP contains the Excel workbook and the Excel KPI Dashboard user manual.
About the Author
Built by PK – Microsoft Certified Professional with 15+ years of Excel, Google Sheets, and Power BI experience. Founder of NextGenTemplates, reaching 300K+ subscribers across YouTube channels. Every template is hand-built and tested before release.
Explore Related Templates
Compare the Water Desalination KPI Dashboard in Excel, Water Resource Management KPI Dashboard in Excel, and Water Utilities Dashboard in Power BI. You can also browse the Excel KPI Dashboard category and Microsoft Excel templates.
Download the Water Treatment Services KPI Dashboard in Excel to turn monthly source figures into a consistent KPI review covering compliance, operations, cost, maintenance, safety, and service performance.
Last updated: September 2026.




























Reviews
There are no reviews yet.