

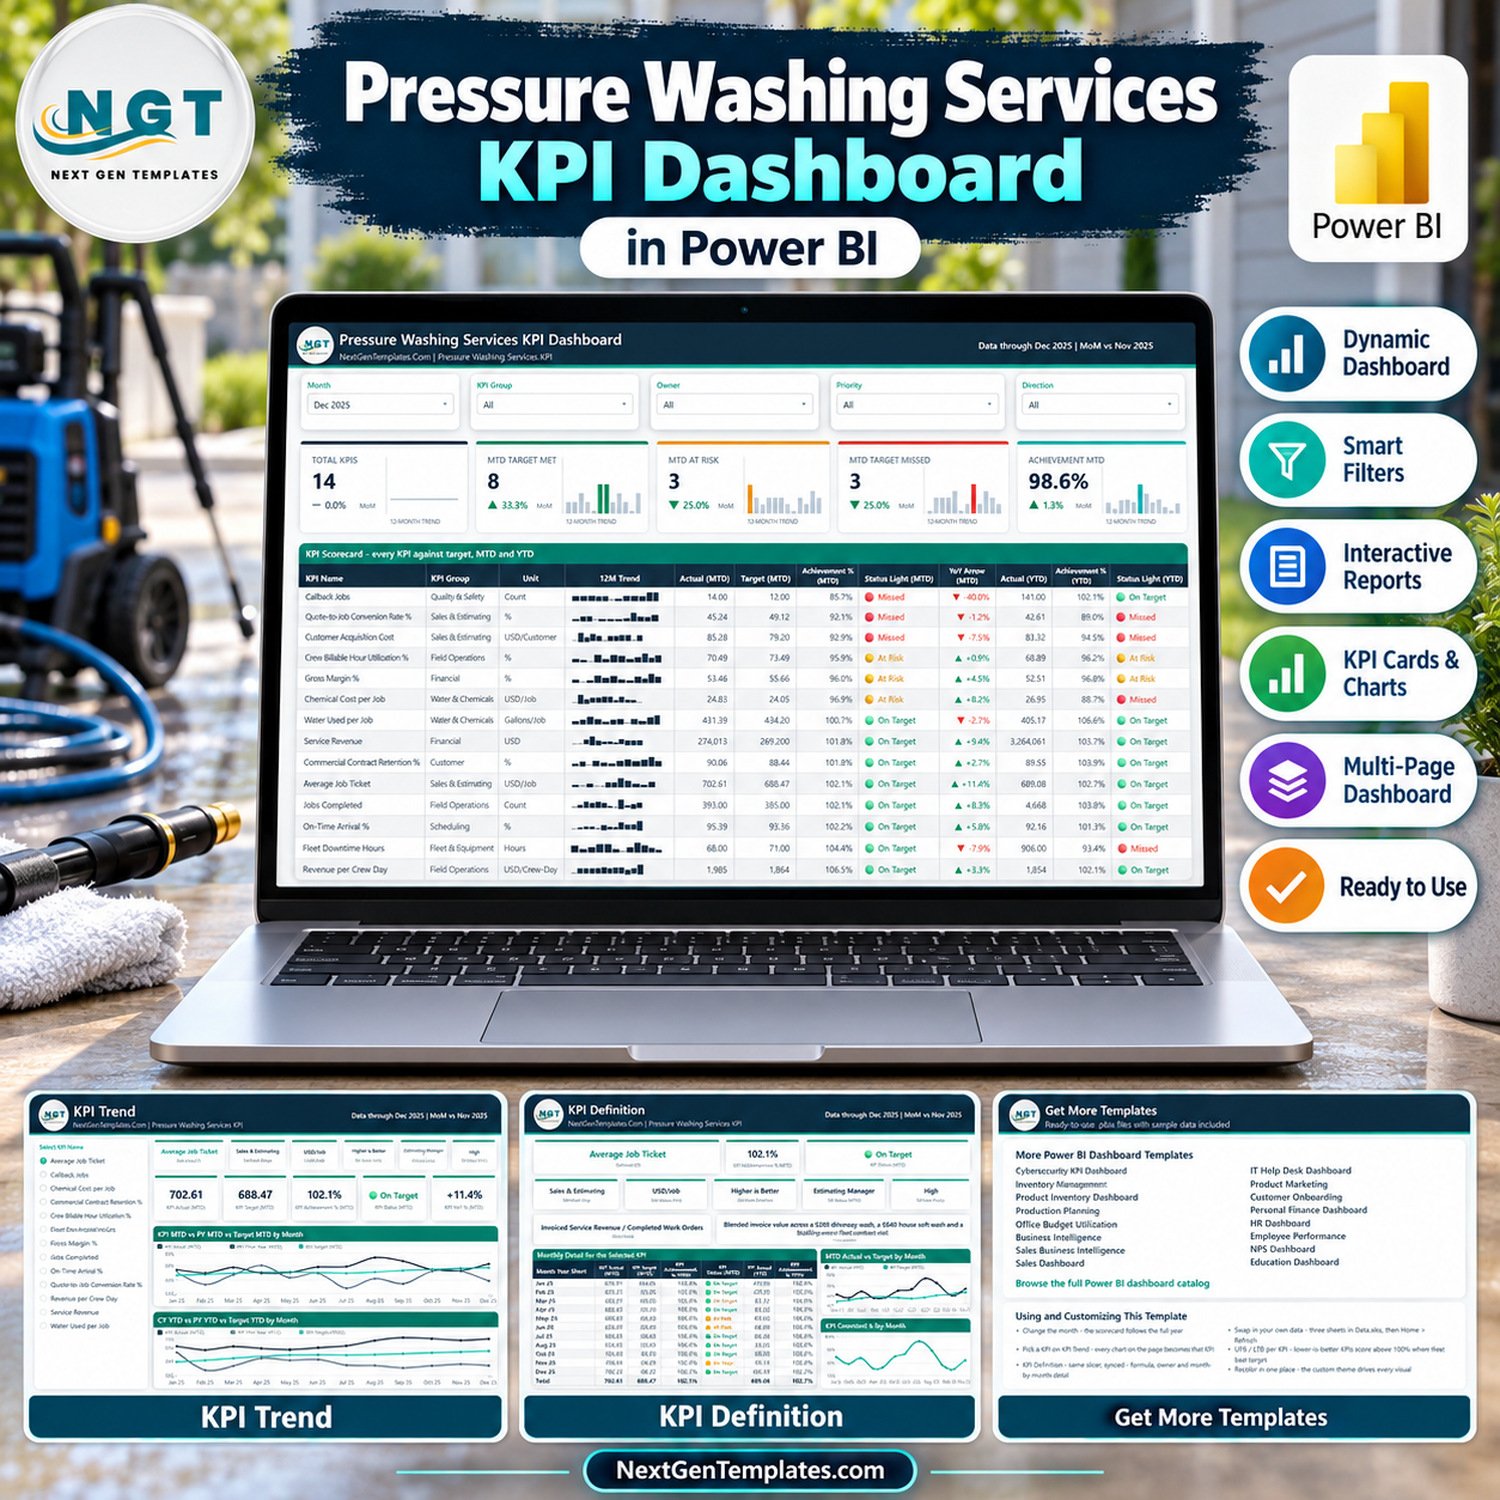
The Pressure Washing Services KPI Dashboard in Power BI is a month-picker KPI scorecard for residential and commercial exterior cleaning businesses. It scores 14 KPIs across 8 KPI groups, with MTD and YTD traffic lights and a 12-month sparkline per KPI, spread over 4 report pages. The December 2025 sample shows 8 KPIs On Target, 3 At Risk and 3 Missed, at 98.6% achievement MTD.
This is the Power BI KPI Dashboard family: one scorecard page, a KPI Trend page, a KPI Definition page and a Get More Templates page. It is not one of our analytical Power BI dashboards with transaction-level charts. Separate Pressure Washing Services KPI Dashboard and KPI Scorecard editions for Excel and Google Sheets are in preparation.
✅ Instant download · One-time payment · No subscription · No per-user fees · Lifetime access to the file
🔑 Key Features of the Pressure Washing Services KPI Dashboard
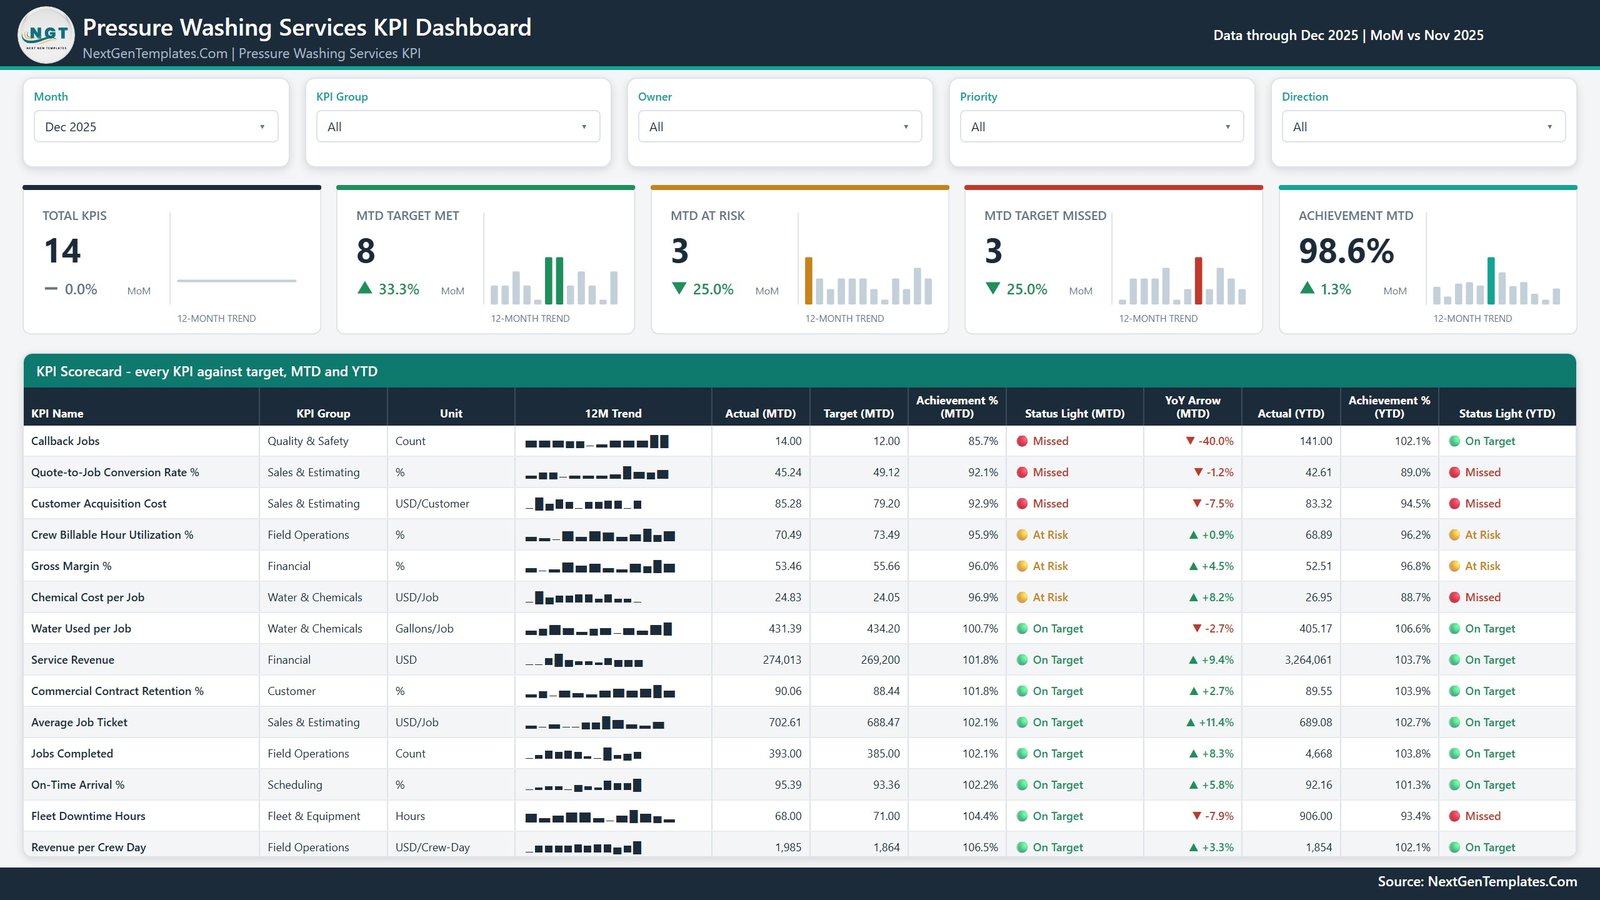
📅 Month picker with four more slicers – Month, KPI Group, Owner, Priority and Direction filter every card and the scorecard table. Pick any month and the MTD, YTD, traffic-light and month-on-month figures all move to that month. The header shows the data month and the comparison month, for example “Data through Dec 2025 | MoM vs Nov 2025”.
🚦 Direction-aware traffic lights – 9 KPIs are higher-is-better and 5 are lower-is-better. Lower-is-better KPIs score Target ÷ Actual, so beating a Customer Acquisition Cost, Callback Jobs or Fleet Downtime Hours target scores above 100%. On Target is 100% or more, At Risk is 95% to 100%, and Missed is below 95%.
📊 Five header cards with 12-month trends – Total KPIs, MTD Target Met, MTD At Risk, MTD Target Missed and Achievement MTD, each with a month-on-month change and a 12-month column trend that highlights the selected month.
🧽 Pressure washing KPIs – Average Job Ticket, Quote-to-Job Conversion Rate %, Revenue per Crew Day, Crew Billable Hour Utilization %, On-Time Arrival %, Callback Jobs, Water Used per Job, Chemical Cost per Job, Fleet Downtime Hours and Commercial Contract Retention % sit next to Service Revenue and Gross Margin %.
🔁 Fully data-driven – nothing in the report hard-codes a KPI. Rename, add or delete KPIs in the three input sheets of Data.xlsx, press Refresh, and the counts, scorecard, KPI list and charts follow.
📦 What’s Inside the Template
The download is a ZIP holding the .pbix report, its Data.xlsx source workbook and a Power BI dashboard user manual (PDF). Data.xlsx has a Read Me sheet, a KPI Definition sheet (group, unit, formula, definition, UTB/LTB type, owner and priority), Input_ Target for 2025, and Input_ Actual for 2024 and 2025 so every prior-year and YoY figure has real rows behind it.
Page 1: KPI Scorecard
The main page. Five header cards and a 14-row scorecard with KPI Name, KPI Group, Unit, 12M Trend, Actual (MTD), Target (MTD), Achievement % (MTD), Status Light (MTD), YoY Arrow (MTD), Actual (YTD), Achievement % (YTD) and Status Light (YTD). The rows run from the weakest to the strongest MTD achievement, so Callback Jobs, Quote-to-Job Conversion Rate % and Customer Acquisition Cost head the December list.
See it in the screenshot above.
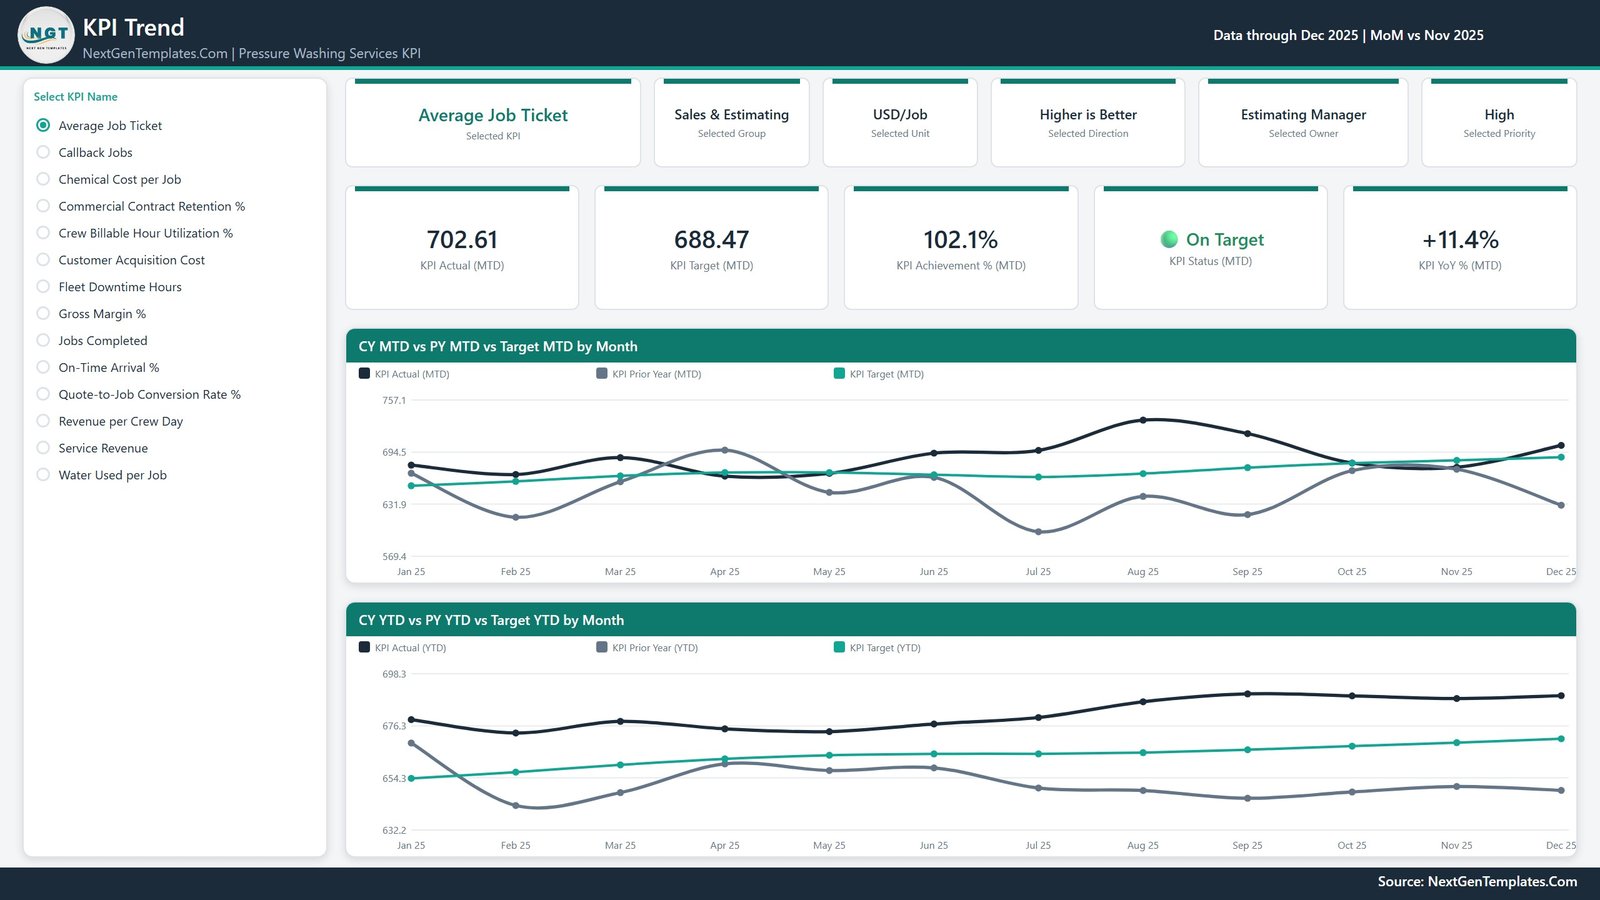
Page 2: KPI Trend
Choose one KPI from the list on the left and six context cards show the selected KPI, group, unit, direction, owner and priority, with five value cards for KPI Actual, Target, Achievement %, Status and YoY % (MTD). Two line charts follow: CY MTD vs PY MTD vs Target MTD by Month and CY YTD vs PY YTD vs Target YTD by Month.
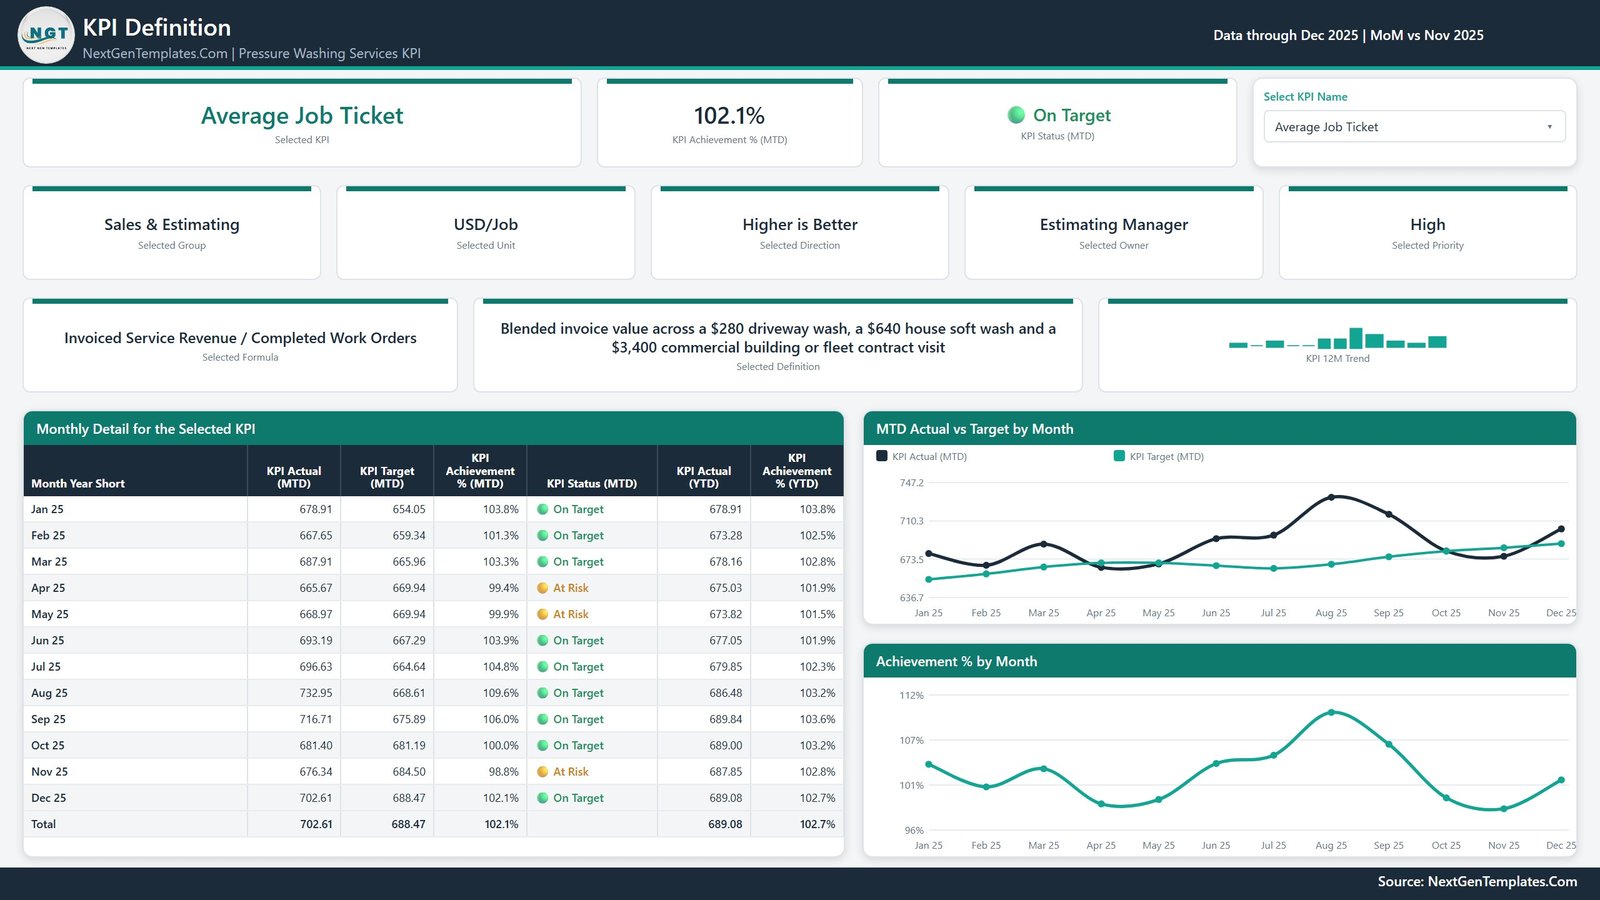
Page 3: KPI Definition
A KPI dropdown shows the selected KPI’s formula, definition and 12-month trend. For Average Job Ticket the formula reads Invoiced Service Revenue / Completed Work Orders. Below sit a Monthly Detail for the Selected KPI table and two charts: MTD Actual vs Target by Month and Achievement % by Month.
Page 4: Get More Templates
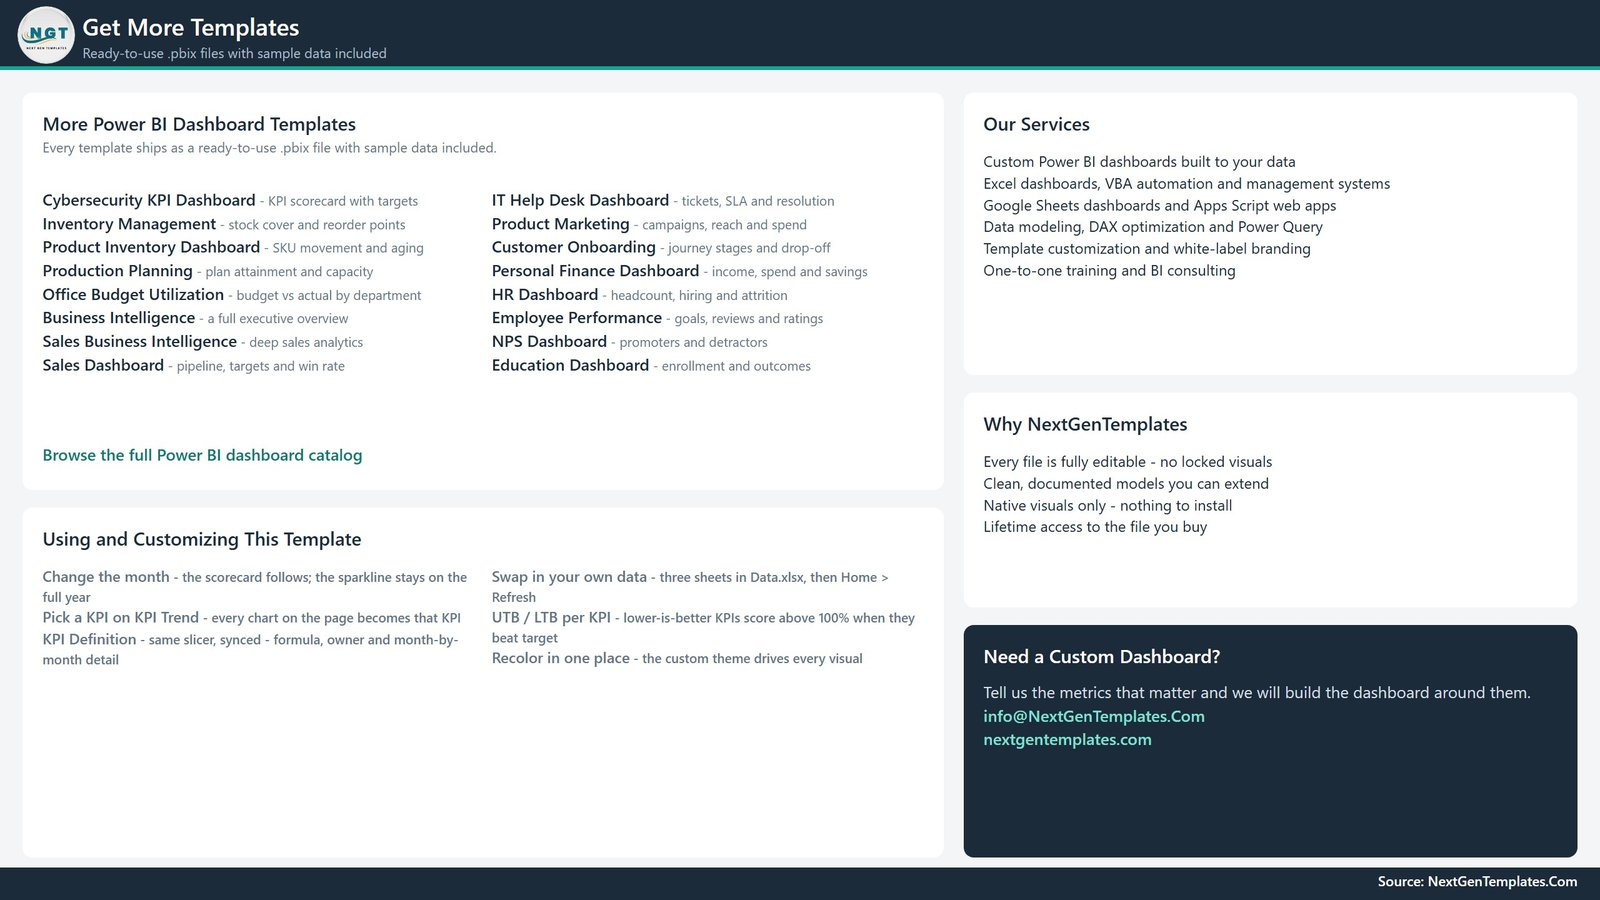
A reference page with tips on changing the month, picking a KPI, swapping in your own data and recolouring the theme, plus a list of more Power BI templates and our services.
The 14 KPIs by group
- 💰 Financial: Service Revenue, Gross Margin %
- 📝 Sales & Estimating: Average Job Ticket, Quote-to-Job Conversion Rate %, Customer Acquisition Cost
- 🚚 Field Operations: Jobs Completed, Revenue per Crew Day, Crew Billable Hour Utilization %
- ⏰ Scheduling: On-Time Arrival %
- 🔍 Quality & Safety: Callback Jobs
- 💧 Water & Chemicals: Water Used per Job, Chemical Cost per Job
- 🔧 Fleet & Equipment: Fleet Downtime Hours
- 🤝 Customer: Commercial Contract Retention %
📊 This Template vs. Tableau / Qlik vs. Field Service SaaS Reporting
| Feature | This Power BI KPI scorecard | Tableau / Qlik build | Field service SaaS (e.g. Jobber, Housecall Pro) |
|---|---|---|---|
| Cost | ✅ $12.99 one-time | Per-user licences plus build time | Recurring monthly subscription |
| Platform | Power BI Desktop (free, Windows) | Tableau or Qlik client | Vendor web and mobile app |
| Setup | ✅ Open the .pbix and explore at once | Design from a blank canvas | Account setup and job import |
| Pressure washing KPIs built in | ✅ 14, with formulas and definitions | None until you build them | Generic job and invoice reports |
| Direction-aware traffic lights | ✅ Yes, UTB and LTB | Custom calculation needed | Rarely |
| Customisable KPIs | ✅ Edit three sheets, then Refresh | Yes, with development | Limited to vendor fields |
| Scheduling and invoicing | Not included (reporting only) | Not included | ✅ Built in |
| Share with a team | Needs a Power BI service licence | Server or cloud licence | ✅ Built in |
| Year-1 cost at 5 users | ✅ $12.99 for the file (sharing licences separate) | Five annual licences | Twelve months of a multi-user plan |
For pressure washing companies that already run jobs in another tool and want a monthly KPI scorecard without another subscription, this template sits in the sweet spot.
👥 Who This Template Is For — and Who It’s Not For
✅ This template is built for:
- Owners and general managers of pressure washing and soft washing companies who review a monthly KPI pack
- Operations and dispatch managers tracking jobs completed, revenue per crew day, utilization and on-time arrival
- Power BI users who want a ready KPI model they can rename for their own crews, routes or branches
❌ This template is NOT for:
- Teams looking for scheduling, quoting, invoicing or environmental compliance software. This is a reporting template, and it makes no wastewater, permit or regulatory check
- Mac-only users with no Windows machine for Power BI Desktop
- Companies that need daily, job-level or live-feed reporting rather than monthly KPI values
⚙️ How to Use the Template
- Unzip the download and keep Data.xlsx in the same folder as the .pbix file.
- Open the .pbix in Power BI Desktop. If the refresh asks for the file, use Home > Transform data > Data source settings > Change Source.
- Edit KPI Definition in Data.xlsx: one row per KPI, with Type set to UTB or LTB.
- Type monthly MTD and YTD values into Input_ Target and Input_ Actual (the current and prior year).
- Press Home > Refresh, then pick a month on the KPI Scorecard page.
💼 Real-World Use Cases
An owner of a multi-crew pressure washing company opens the scorecard at month end, sets Priority to Critical and walks the team through five KPIs. The December sample shows Callback Jobs as Missed at 85.7% (14 callbacks against a target of 12), while Revenue per Crew Day is On Target at 106.5%.
An estimating manager filters KPI Group to Sales & Estimating. Quote-to-Job Conversion Rate % is Missed at 92.1% and Customer Acquisition Cost is Missed at 92.9%, even though Average Job Ticket is On Target at 102.1%. The KPI Trend page shows whether that conversion gap is new or has run all year.
A fleet lead filters Owner to Fleet & Compliance Lead and checks Water Used per Job, Chemical Cost per Job and Fleet Downtime Hours together. In December chemical cost is At Risk at 96.9% MTD and Missed at 88.7% YTD, so mix ratios are the next conversation.
❓ Frequently Asked Questions
What KPIs does this pressure washing KPI dashboard track?
It tracks 14 KPIs in eight groups: Financial, Sales & Estimating, Field Operations, Scheduling, Quality & Safety, Water & Chemicals, Fleet & Equipment and Customer. They include Average Job Ticket, Revenue per Crew Day, On-Time Arrival %, Callback Jobs, Chemical Cost per Job and Commercial Contract Retention %.
Do I need a paid Power BI licence?
No. Power BI Desktop is free from Microsoft and is all you need to open, edit and refresh the .pbix. You only need a Power BI service licence if you want to publish the report and share it online with colleagues.
Are YTD values calculated automatically?
No. YTD values are typed into Data.xlsx alongside MTD, not calculated by the report. The Read Me explains the rule: sum additive KPIs such as revenue and jobs, and average rates and percentages.
Why does Callback Jobs show a negative YoY % when callbacks went up?
The YoY arrow is direction-adjusted. For lower-is-better KPIs a rise is shown as a negative, red arrow, so a green up arrow always means improvement. In the sample Callback Jobs rose from 10 in December 2024 to 14 in December 2025 and shows ▼ -40.0%.
Does it track water discharge or environmental compliance?
No. Water Used per Job and Chemical Cost per Job are monthly cost and usage KPIs you type in. The template does not record wastewater handling, permits or any regulation, and the shipped figures are fictional sample data.
How does it compare with a field service software subscription?
This template is a one-time $12.99 file focused on a monthly KPI scorecard. Field service platforms add scheduling, quoting and invoicing, but charge a recurring subscription. If you already run jobs elsewhere and only need the scorecard, the template covers it without a contract.
👤 About the Author
Built by PK, a Microsoft Certified Professional with 15+ years of Excel, Google Sheets and Power BI experience and the founder of NextGenTemplates. Tutorials are on YouTube at @PKAnExcelExpert. Every template is hand-built and tested before release.
🔗 Explore Related Templates
🏊 Swimming Pool Service KPI Dashboard in Power BI – the same four-page KPI scorecard for route-based pool service companies.
🐜 Pest Control Business KPI Dashboard in Power BI, Septic Tank Service KPI Dashboard in Power BI and Garage Door Service KPI Dashboard in Power BI – sibling home-service trades on the same model.
🚗 Car Wash Management System Web App – for wash businesses that need day-to-day job and billing records rather than a monthly scorecard.
🗂️ Browse all Power BI KPI Dashboard templates or the full Power BI template catalogue.
📚 Learn how report refresh works in the Microsoft Power BI data refresh documentation.
📖 Click here to read the detailed blog post
🎥 Visit our YouTube channel for step-by-step video tutorials
👉 YouTube.com/@PKAnExcelExpert
📅 Last updated: September 2026





























Reviews
There are no reviews yet.