

The Moving Company KPI Scorecard in Excel is a formula-driven monthly scorecard for residential and commercial moving companies, relocation firms and removals businesses. It tracks 10 moving KPIs across four groups (Operations, Service Quality, Financial and Sales), shows each one as a traffic-light tile with its target, change and a 12-month sparkline, and lets you switch between MTD and YTD, and between Target, Prior Year and Prior Month, from the header. There are no macros and no add-ins: you type monthly numbers on one sheet and every page follows.
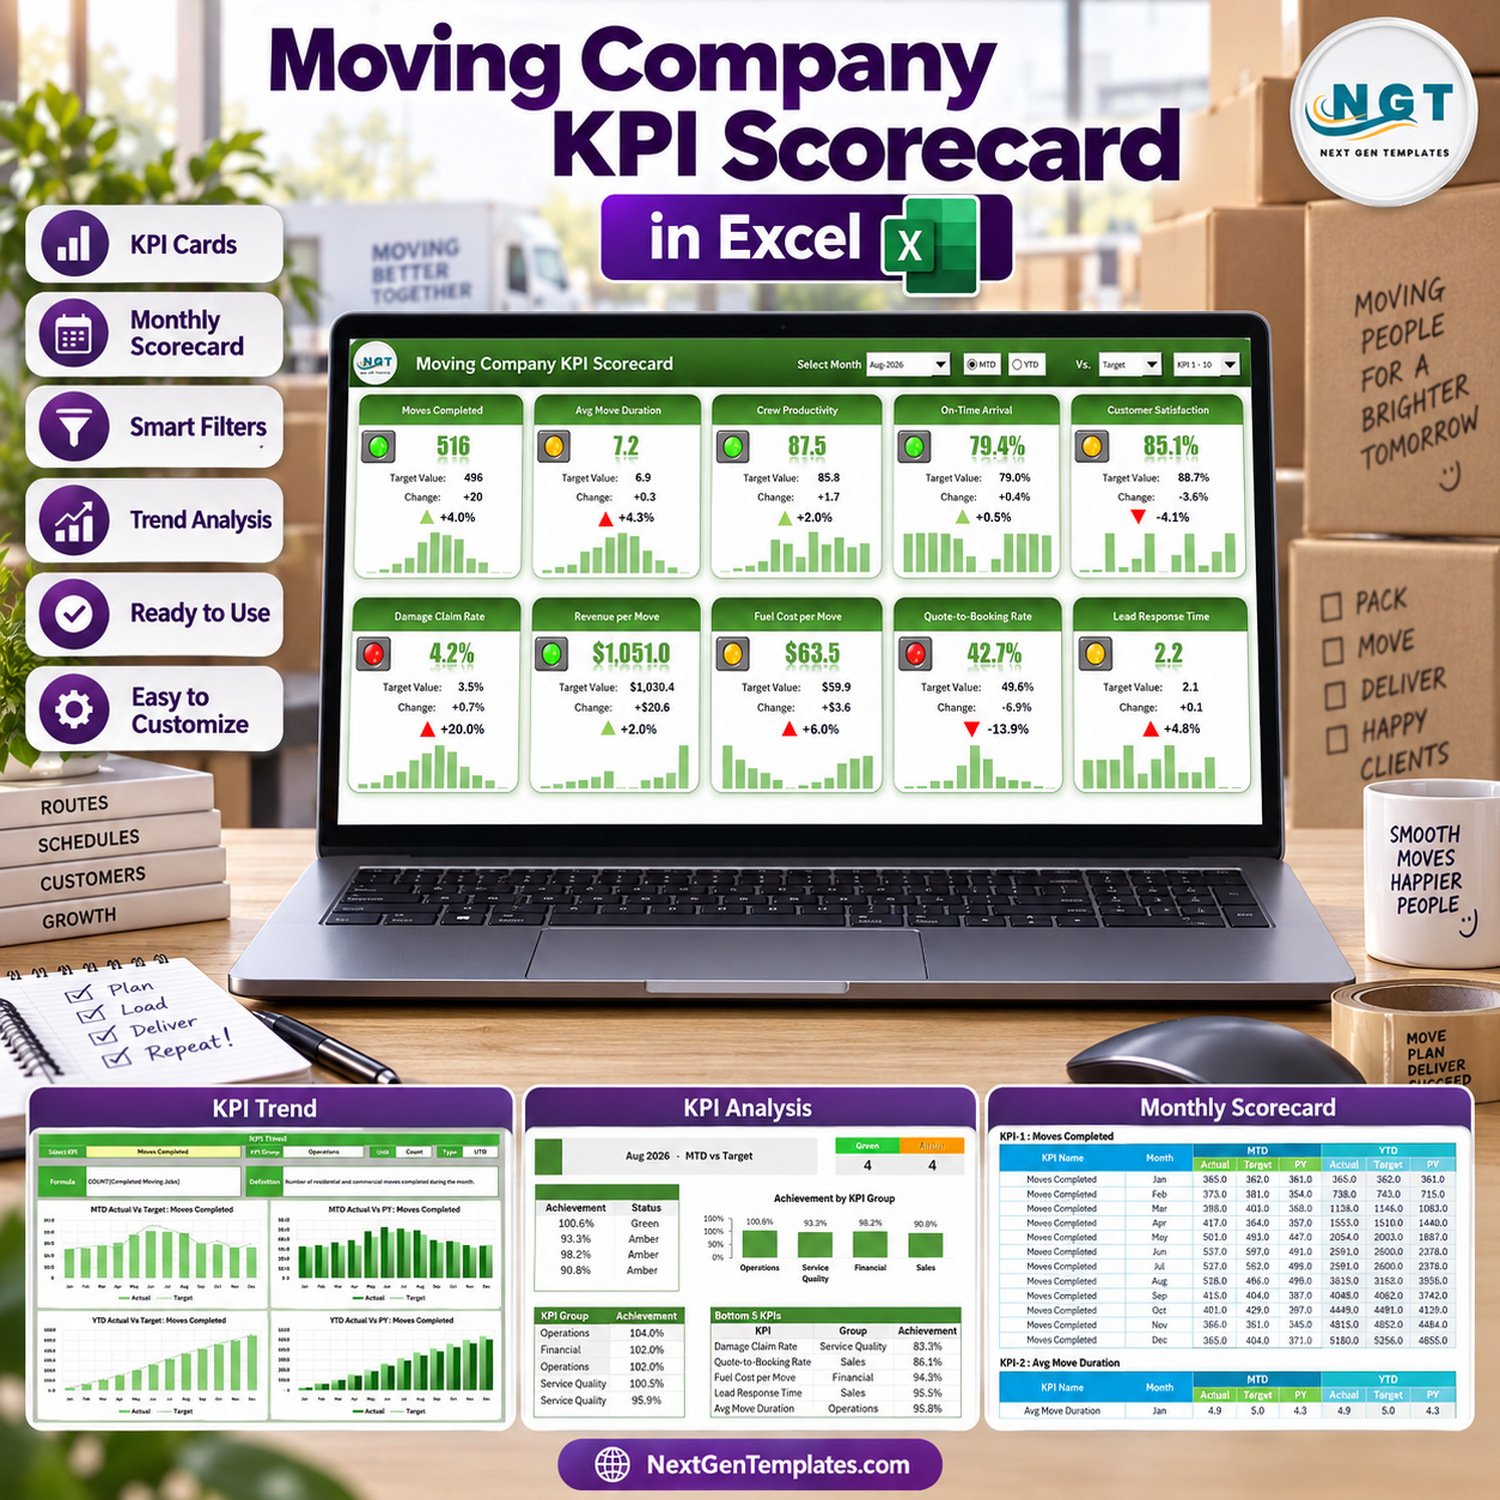
This listing is the KPI scorecard edition (the NextGenTemplates 26. KPI Scorecard family): one monthly tile wall plus KPI Analysis and KPI Trend pages. It is a different template from the Moving Company KPI Dashboard in Excel and from the analytical dashboard line, which use other layouts. Browse the full Excel KPI dashboard and scorecard category, or read the full blog walkthrough of this moving company scorecard.
Key Features of Moving Company KPI Scorecard in Excel
- 10 moving company KPIs in 4 groups: Operations (Moves Completed, Avg Move Duration, Crew Productivity), Service Quality (On-Time Arrival, Customer Satisfaction, Damage Claim Rate), Financial (Revenue per Move, Fuel Cost per Move) and Sales (Quote-to-Booking Rate, Lead Response Time).
- Scorecard tile wall: every KPI shows its value, target, change, a direction arrow, a red/amber/green light and a 12-month bar sparkline.
- Four header controls: Select Month, an MTD / YTD switch, a Vs. picker (Target, PY or Prior Month) and a KPI 1-10 / KPI 11-20 set picker.
- Direction-aware status: 6 KPIs are upper-the-better and 4 are lower-the-better (Avg Move Duration, Damage Claim Rate, Fuel Cost per Move and Lead Response Time), and both the light and the arrow respect that.
- KPI Analysis page: Green / Amber / Red counts, Achievement by KPI Group as a table and a column chart, plus Top 5 and Bottom 5 KPIs for the month.
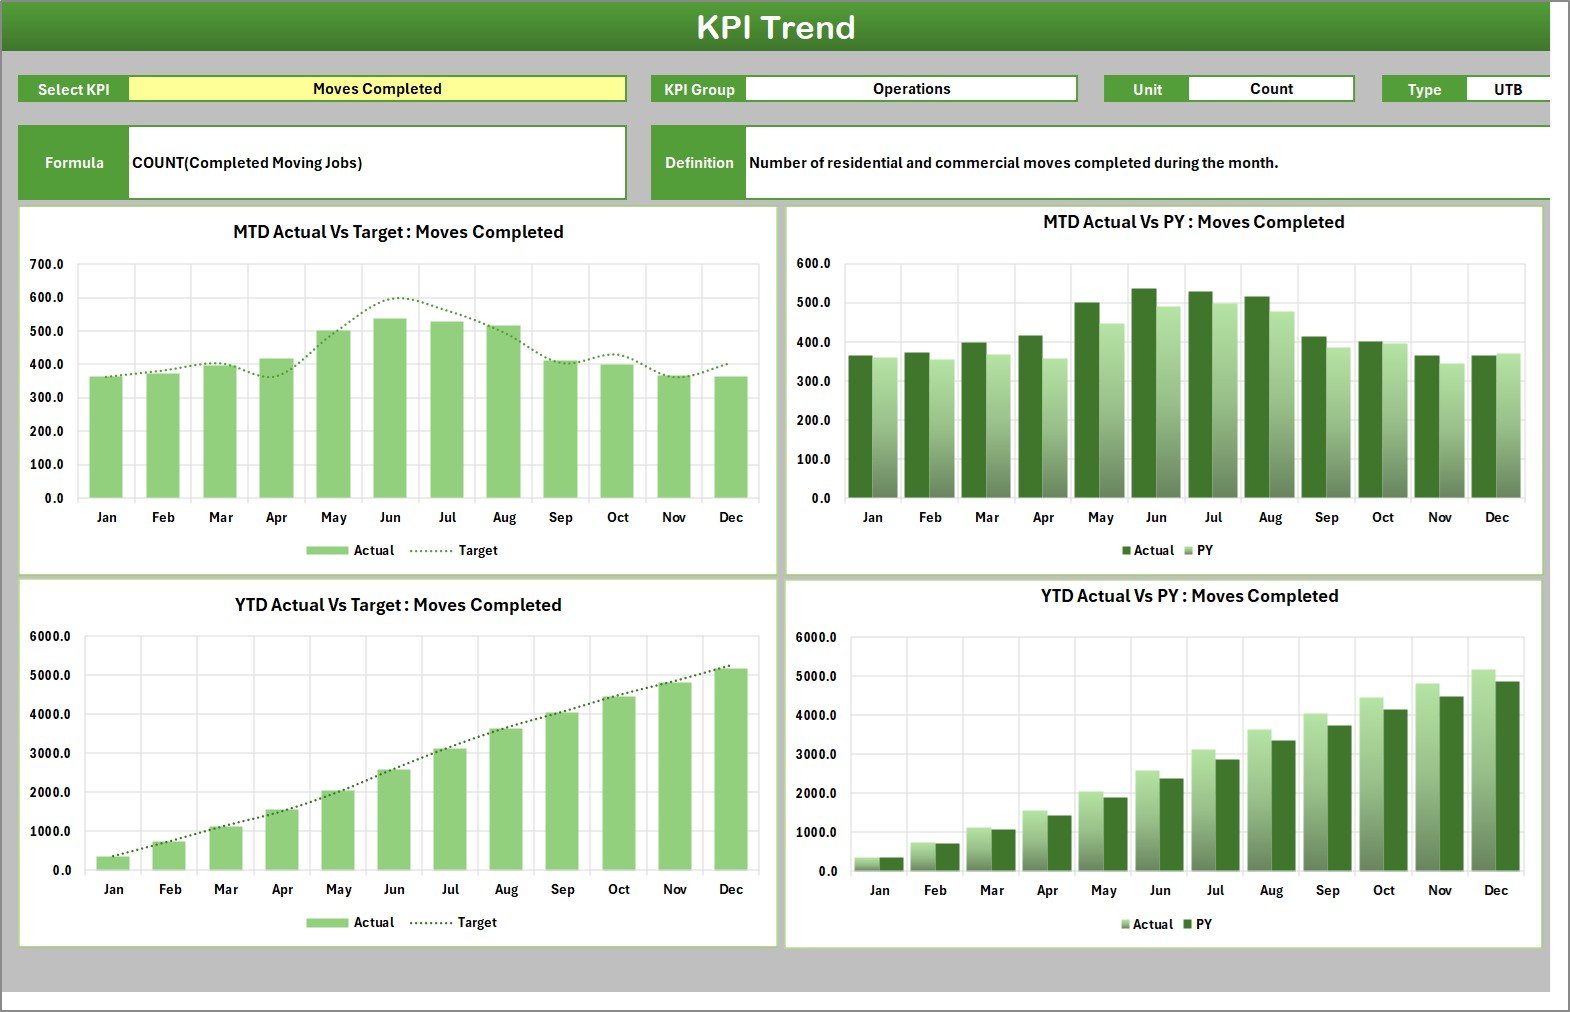
- KPI Trend page: pick one KPI and see MTD Actual vs Target, MTD Actual vs PY, YTD Actual vs Target and YTD Actual vs PY across all 12 months.
- Room for 20 KPIs: add a KPI on the next free KPI Definition row and fill its numbered block on Input Data.
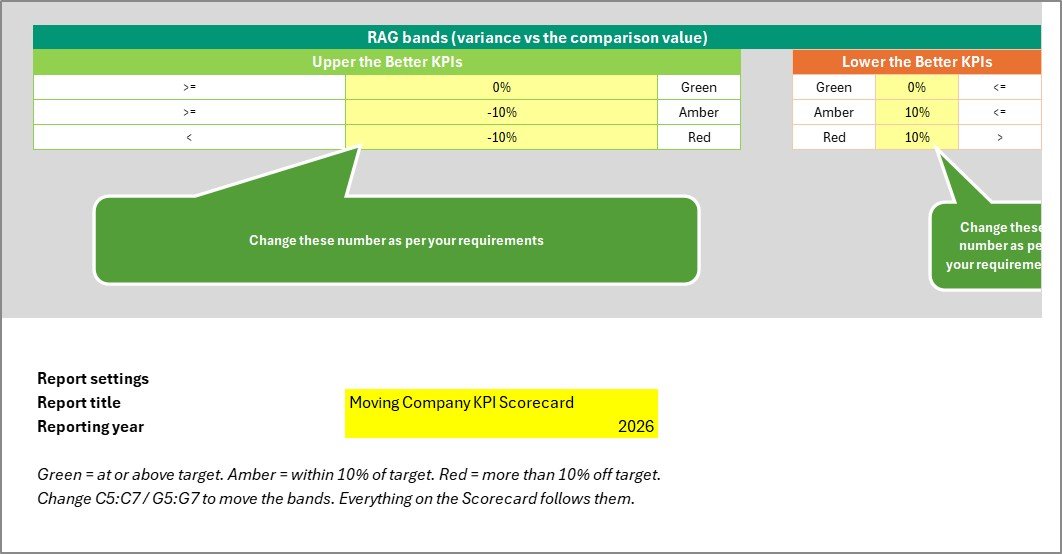
- Editable RAG bands: the Color Settings sheet holds the green, amber and red thresholds for upper-the-better and lower-the-better KPIs, plus the report title and reporting year.
What’s Inside the Workbook
The download is a ZIP holding the .xlsx workbook and the Excel KPI Scorecard user manual (PDF). The workbook has nine visible sheets, shown below with the sample data it ships with (August 2026 selected, MTD vs Target).
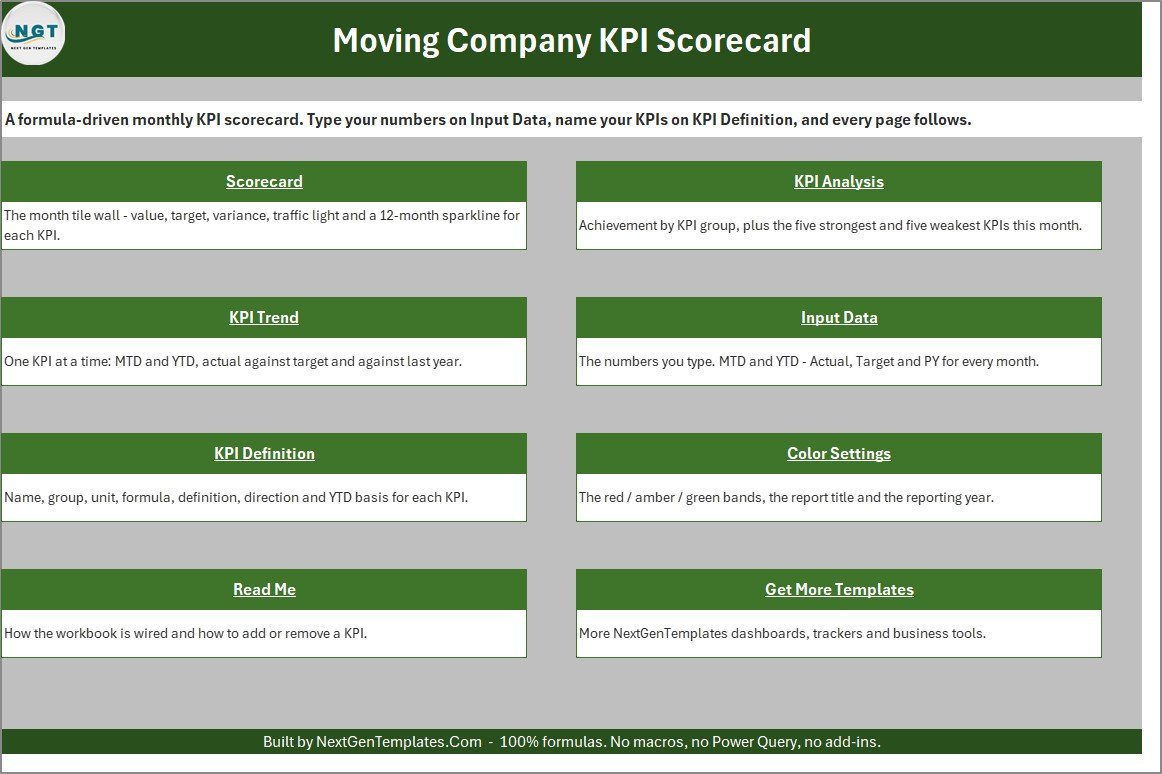
Home
A navigation page with a short description and link card for each sheet: Scorecard, KPI Analysis, KPI Trend, Input Data, KPI Definition, Color Settings, Read Me and Get More Templates.
Scorecard
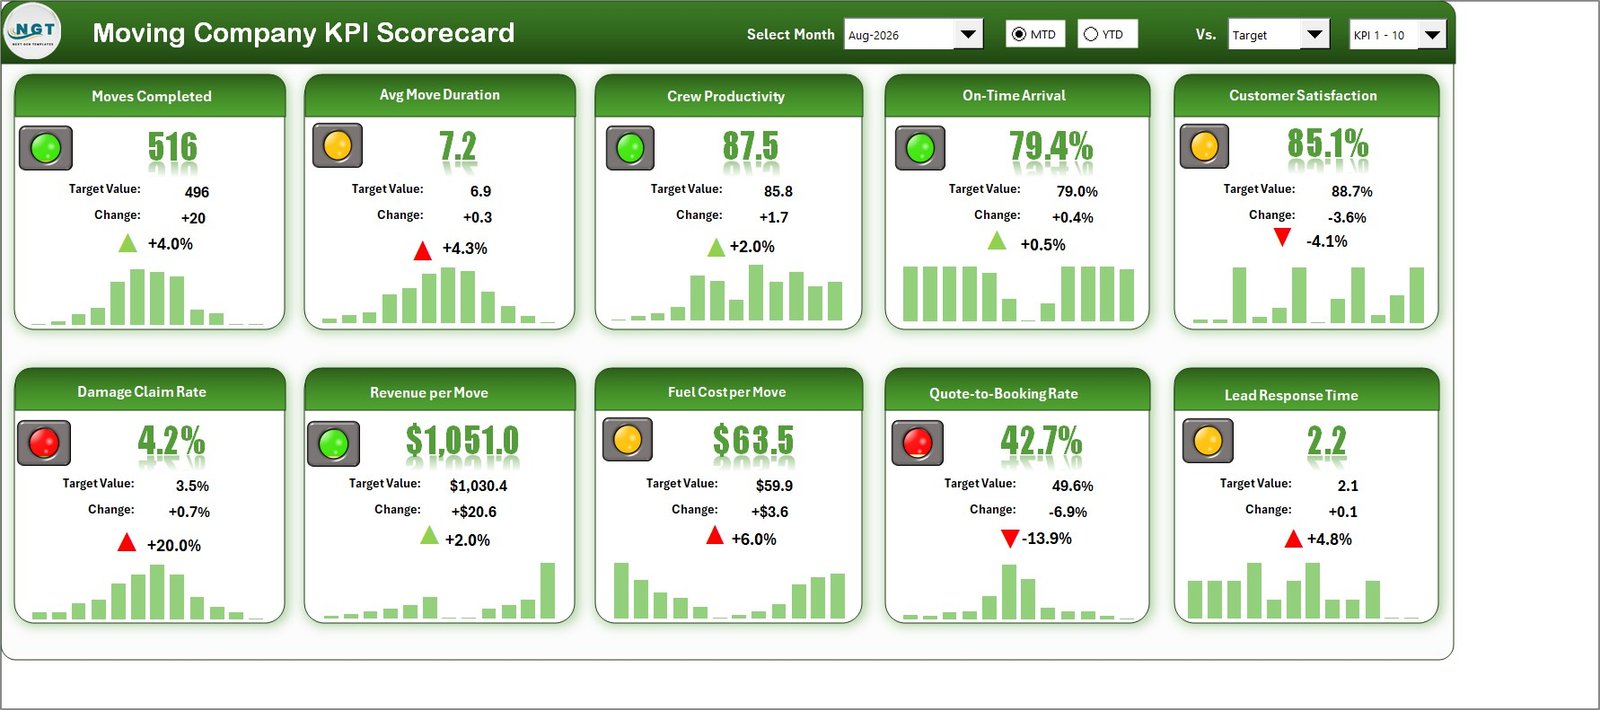
The month tile wall. In the August 2026 sample, Moves Completed reads 516 against a 496 target, Crew Productivity is 87.5 cu ft per hour against 85.8, On-Time Arrival is 79.4% against 79.0% and Revenue per Move is $1,051.0 against $1,030.4, all green. Avg Move Duration (7.2 hours against 6.9), Customer Satisfaction (85.1% against 88.7%), Fuel Cost per Move ($63.5 against $59.9) and Lead Response Time (2.2 hours against 2.1) are amber. Damage Claim Rate is 4.2% against 3.5% and Quote-to-Booking Rate is 42.7% against 49.6%, both red. Four KPIs are green, four amber and two red.
KPI Analysis
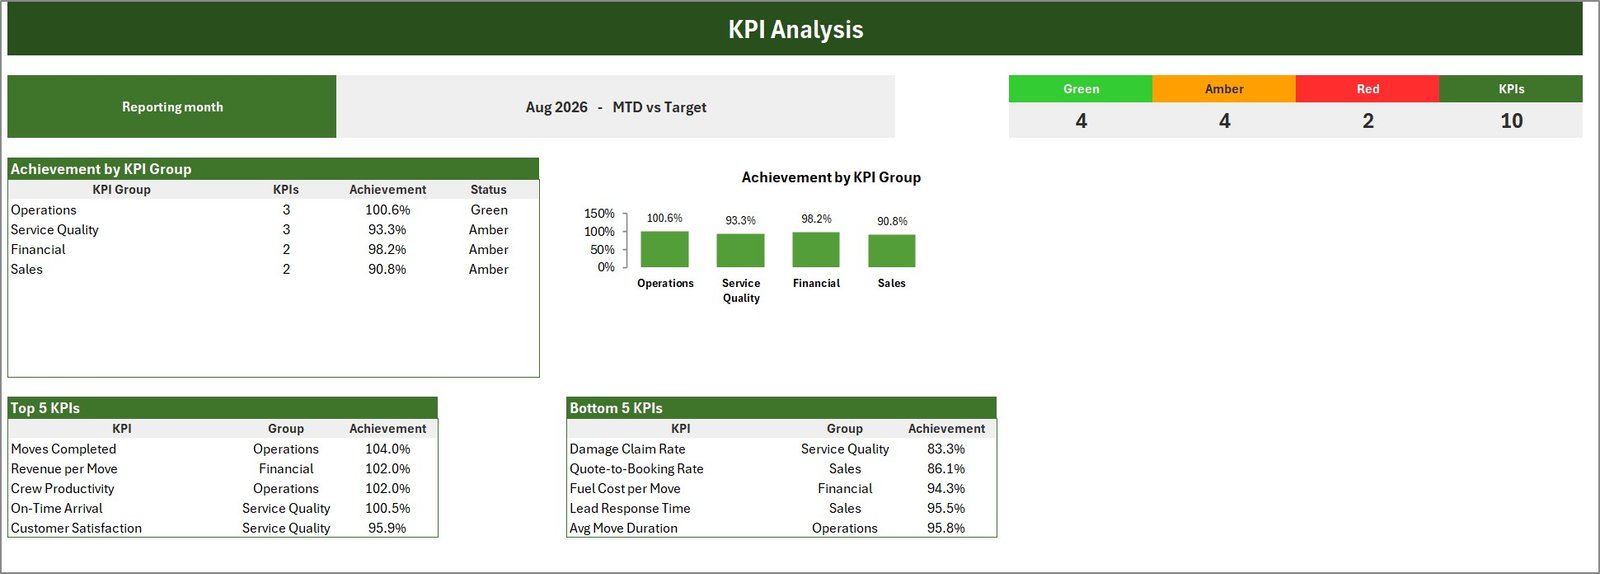
The reporting month and comparison basis, the Green / Amber / Red / KPIs counters (4 / 4 / 2 / 10 in the sample), Achievement by KPI Group (Operations 100.6% green, Service Quality 93.3%, Financial 98.2% and Sales 90.8%, all amber), and the Top 5 and Bottom 5 KPIs by achievement. In the sample, Moves Completed leads at 104.0% and Damage Claim Rate trails at 83.3%, followed by Quote-to-Booking Rate at 86.1%.
KPI Trend
Select a KPI and the page shows its group, unit, type, formula and definition, then four 12-month charts: MTD Actual vs Target, MTD Actual vs PY, YTD Actual vs Target and YTD Actual vs PY. For Moves Completed, the summer moving season stands out: 501 moves in May, 537 in June and 528 in July, against about 365 to 400 in the winter months.
Input Data
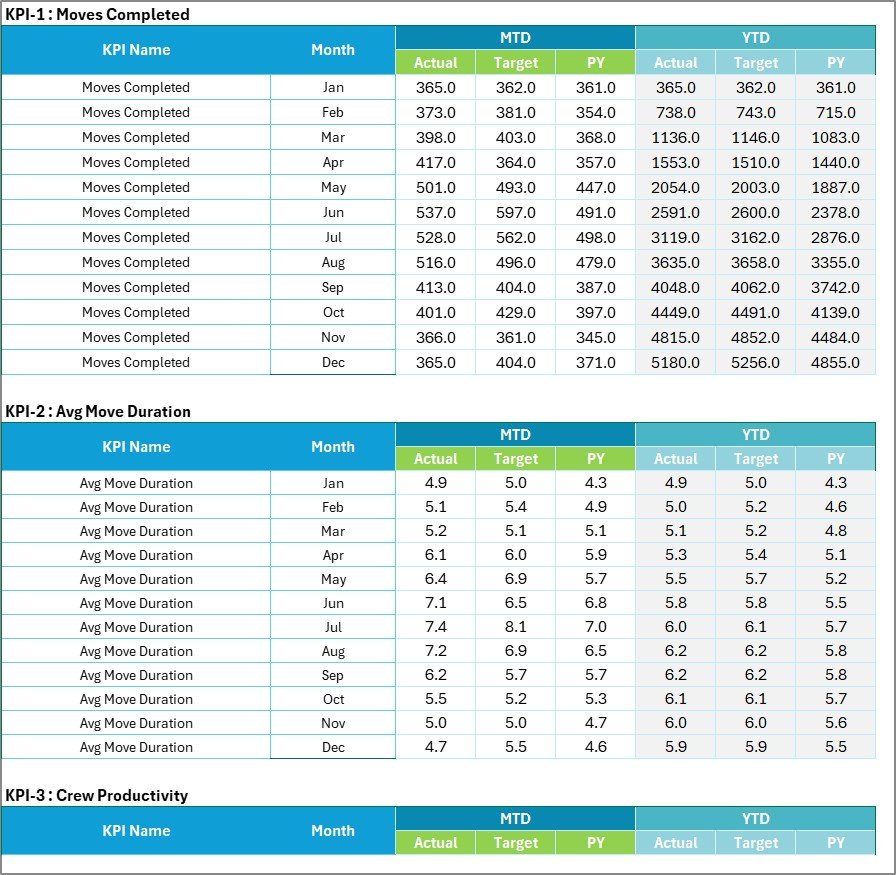
One numbered block per KPI with twelve month rows and six columns: MTD Actual, Target and PY, and YTD Actual, Target and PY.
KPI Definition
Group, name, unit, formula, definition, type (UTB or LTB) and YTD basis (Sum or Average) for each KPI, with a Check column that flags duplicate names. Moves Completed rolls up as a sum; the other nine rates, averages and per-move values roll up as an average. Units include Count, Hours, Cu Ft/Hour, % and USD.

Color Settings, Read Me and Get More Templates
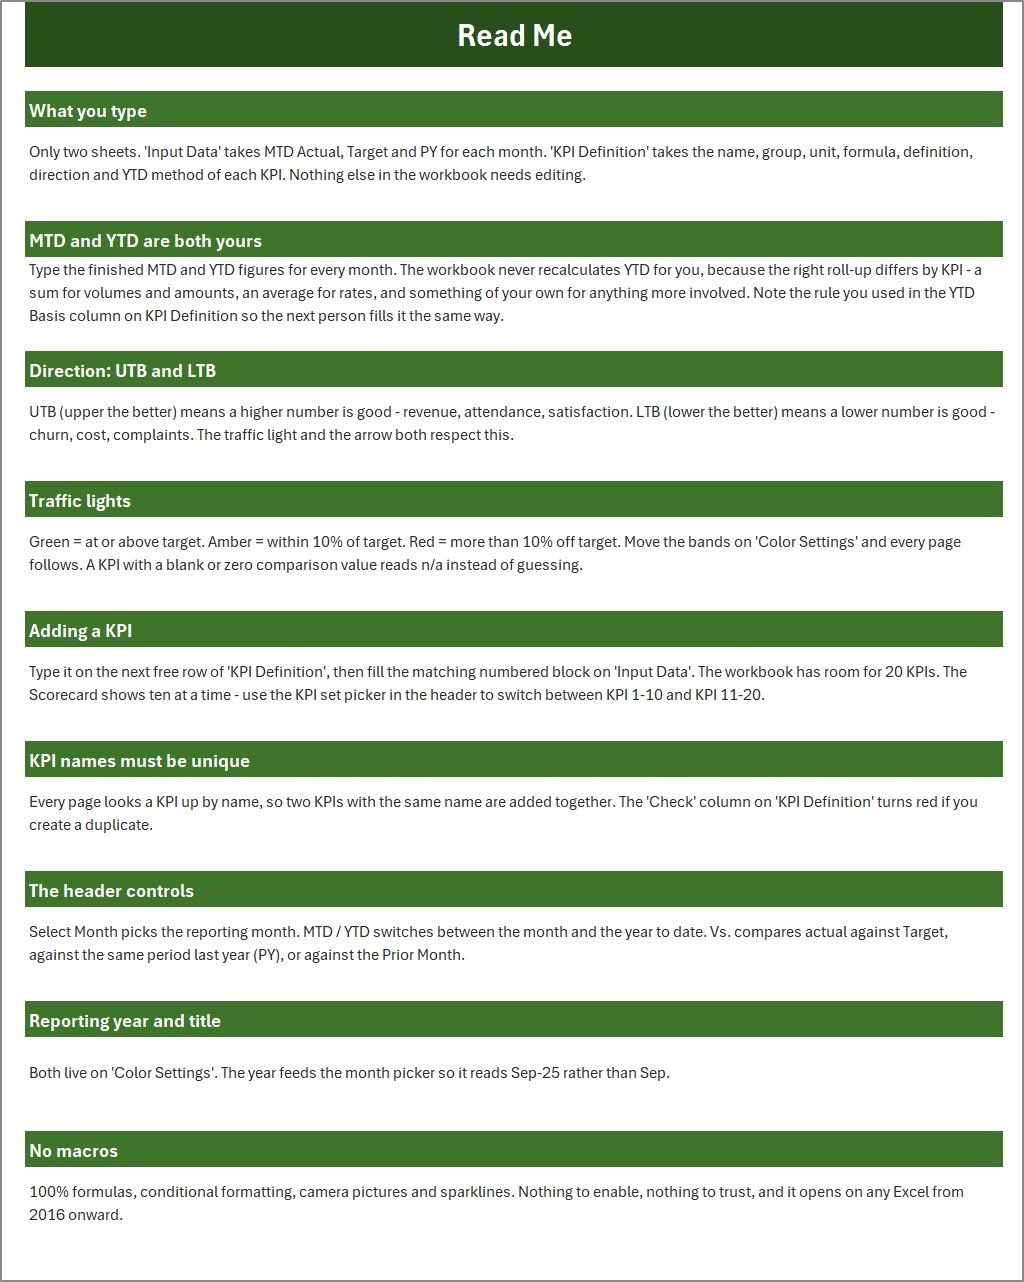
Color Settings holds the RAG bands (by default green at or above target, amber within 10%, red more than 10% off) plus the report title and year. Read Me explains how the workbook is wired, how to add a KPI and what each header control does.
Excel Scorecard vs. Moving Company Software
| Decision point | This Excel scorecard | Moving CRM / dispatch software |
|---|---|---|
| Cost | One-time purchase, $9.99 sale price | Monthly subscription, usually per user |
| Platform | Microsoft Excel desktop (2016 or later) | Cloud and mobile app |
| Setup | Replace sample numbers on Input Data | Account, users, jobs, crews and integrations |
| Data control | Local file you own | Vendor-hosted |
| Macros | None – 100% formulas | Not applicable |
| Best fit | Monthly owner or manager KPI review | Quotes, bookings, crew scheduling and invoicing |
Prefer an interactive analytics view of moves, revenue and customers? The Moving Company Dashboard in Power BI covers that. This scorecard is built for the monthly target review.
Who This Template Is For – and Who It’s Not For
It suits moving company owners, operations and branch managers, sales managers who own quote conversion, and consultants who already have monthly figures and want a clean scorecard to review them. It is useful for owner reviews, crew performance discussions and monthly management packs.
It is not a quoting, booking, crew scheduling, inventory, invoicing or CRM system, and it does not connect to any software. Every number is typed. It makes no licensing, insurance or regulatory claim: Damage Claim Rate is simply a percentage you enter from your own records. The sample figures are fictional.
How to Use This Excel Scorecard
- Download the ZIP, extract it and open the .xlsx in desktop Microsoft Excel.
- On Color Settings, set the report title, reporting year and RAG bands.
- On KPI Definition, keep or rename the 10 KPIs and set each unit, type (UTB / LTB) and YTD basis.
- On Input Data, type MTD Actual, Target and PY and your finished YTD figures for each month.
- Open the Scorecard, pick the month, MTD or YTD, and what to compare against.
- Use KPI Analysis for the group view and KPI Trend for one KPI across the year.
Things to Know Before You Buy
- YTD is typed, not calculated. The workbook deliberately does not roll YTD up for you, because a sum suits move counts while an average suits rates, hours and per-move values. Record your rule in the YTD Basis column.
- One reporting year per file. Save a copy for each year.
- Form controls need desktop Excel. The header dropdowns and MTD / YTD buttons are Excel form controls, which Excel for the web and mobile do not fully support.
- A zero comparison value reads n/a rather than guessing a status.
- Cosmetic note: the Read Me mentions the month picker reading “Sep-25”, while the shipped picker shows the “Aug-2026” style. The picker itself works for every month.
Frequently Asked Questions
Does it need macros?
No. It is a standard .xlsx built on formulas, conditional formatting, camera pictures and sparklines, so there is nothing to enable.
Can I change or add KPIs?
Yes. Rename any KPI on KPI Definition, or add up to 20 in total and switch between KPI 1-10 and KPI 11-20 on the Scorecard.
Can I change the red, amber and green thresholds?
Yes. Edit the bands on Color Settings and every page follows.
Does it import data from my moving software?
No. Export or summarise your monthly numbers first, then type or paste them into Input Data.
Is there a Google Sheets edition?
Not at the moment. This listing is the Excel edition.
Related Excel KPI Scorecards
- Plumbing Business KPI Scorecard in Excel
- Electrical Contractor KPI Scorecard in Excel
- Carpentry Workshop KPI Scorecard in Excel
- Home Renovation Contractor KPI Scorecard in Excel
Want to restyle the traffic lights? See Microsoft’s guide to conditional formatting in Excel, or the general Excel help and learning hub.
About the Author
Built by PK – Microsoft Certified Professional with 15+ years of Excel, Google Sheets and Power BI experience, and founder of NextGenTemplates. Video tutorials are on PK: An Excel Expert on YouTube.































Reviews
There are no reviews yet.