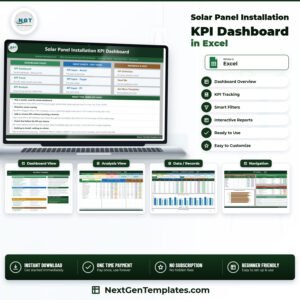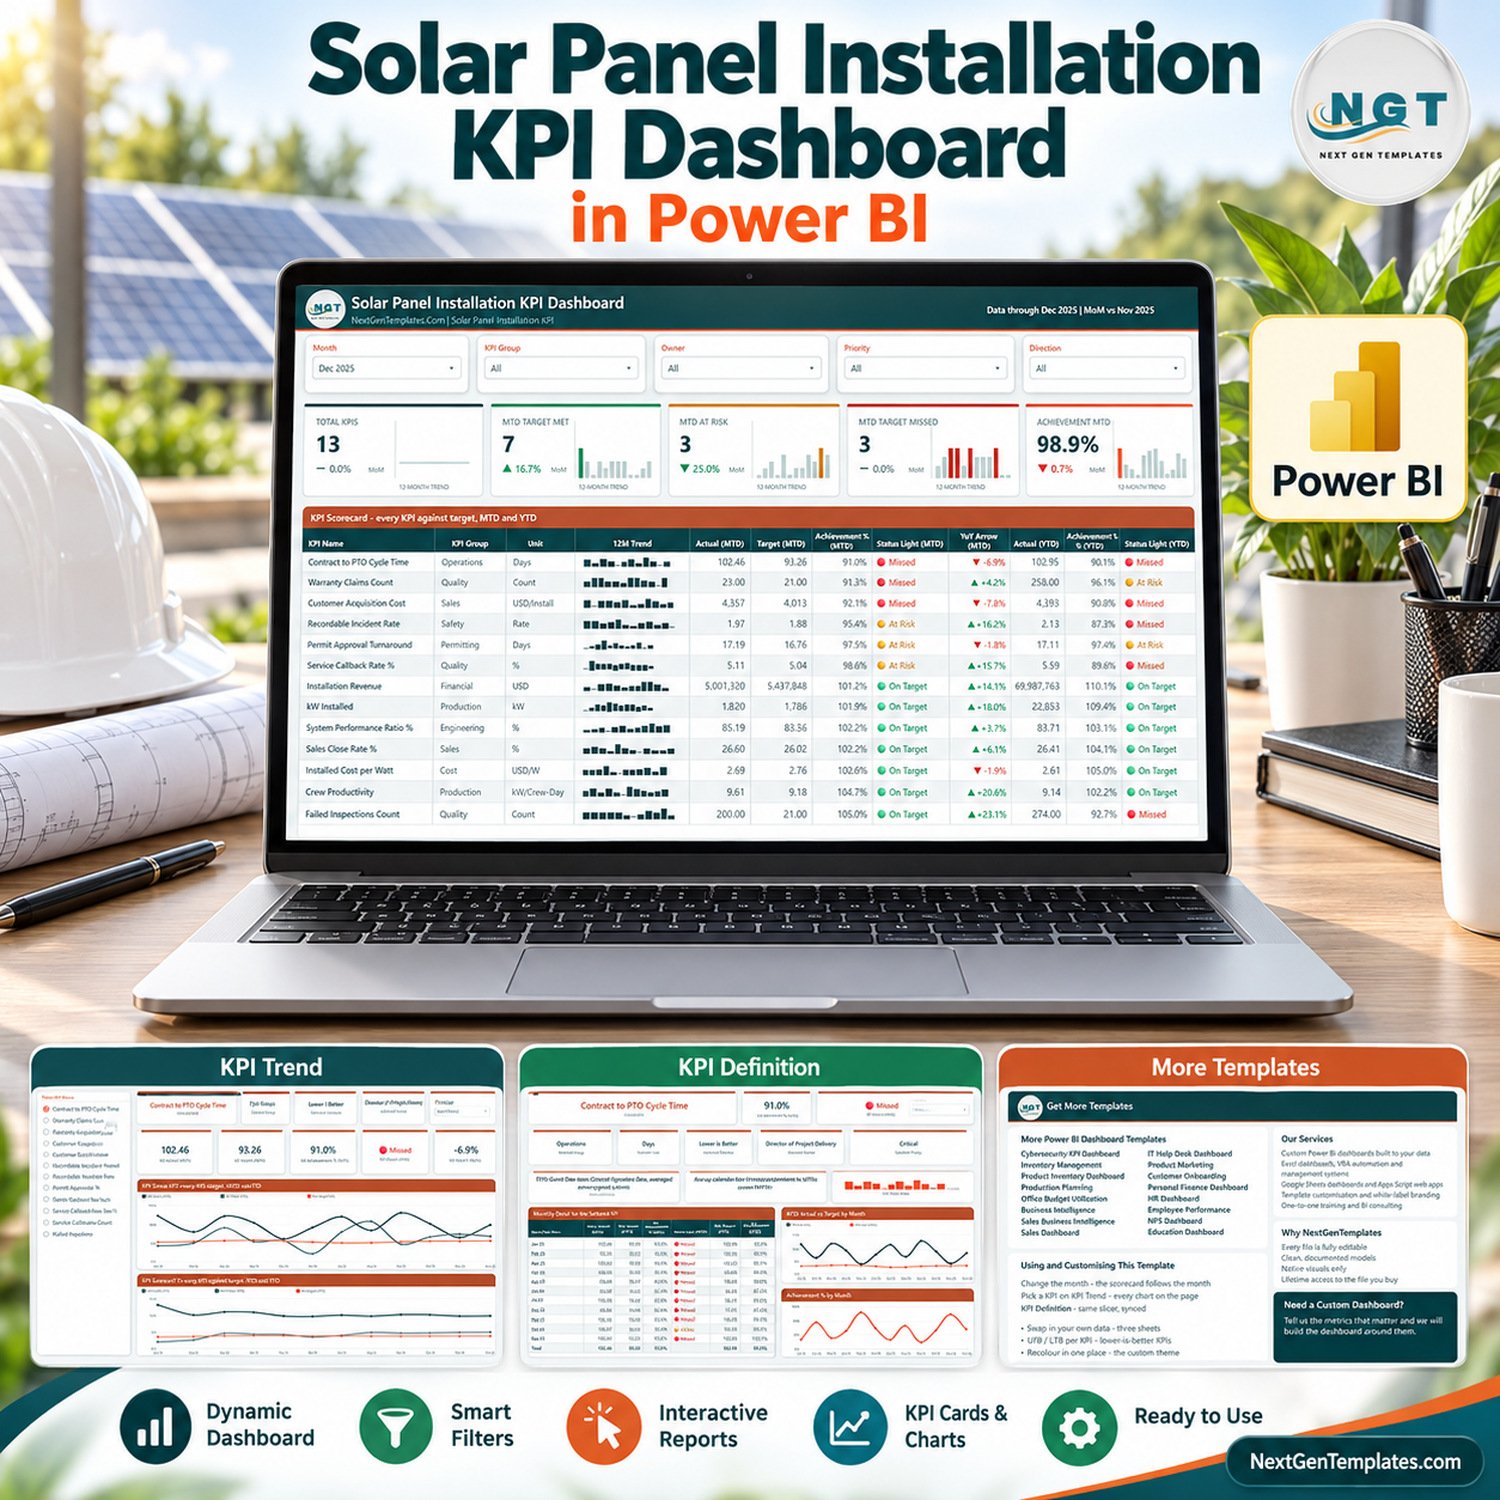
The Solar Panel Installation KPI Dashboard in Power BI scores 13 installer KPIs across 9 KPI groups on three report pages driven by one month picker. Each KPI gets an MTD and a YTD traffic light against target, a 12-month trend and a prior-year comparison. In the sample file (data through Dec 2025), 7 KPIs are on target, 3 are at risk and 3 have missed, with an overall MTD achievement of 98.9%.
This listing is the KPI Dashboard family in Power BI: a month-picker KPI scorecard with traffic lights, a KPI Trend page and a KPI Definition page. It is not an analytical sales dashboard, and it is not the separate Solar Panel Installation KPI Scorecard product. Both are different templates and are linked at the end of this page.
🌍 Join 8,400+ teams in 40+ countries using NextGenTemplates to replace paid SaaS tools with one-time-purchase Excel, Google Sheets, Power BI and HTML templates.
✅ Instant download · One-time payment · No subscription · No per-user fees · Lifetime access
🔑 Key Features of the Solar Panel Installation KPI Dashboard in Power BI
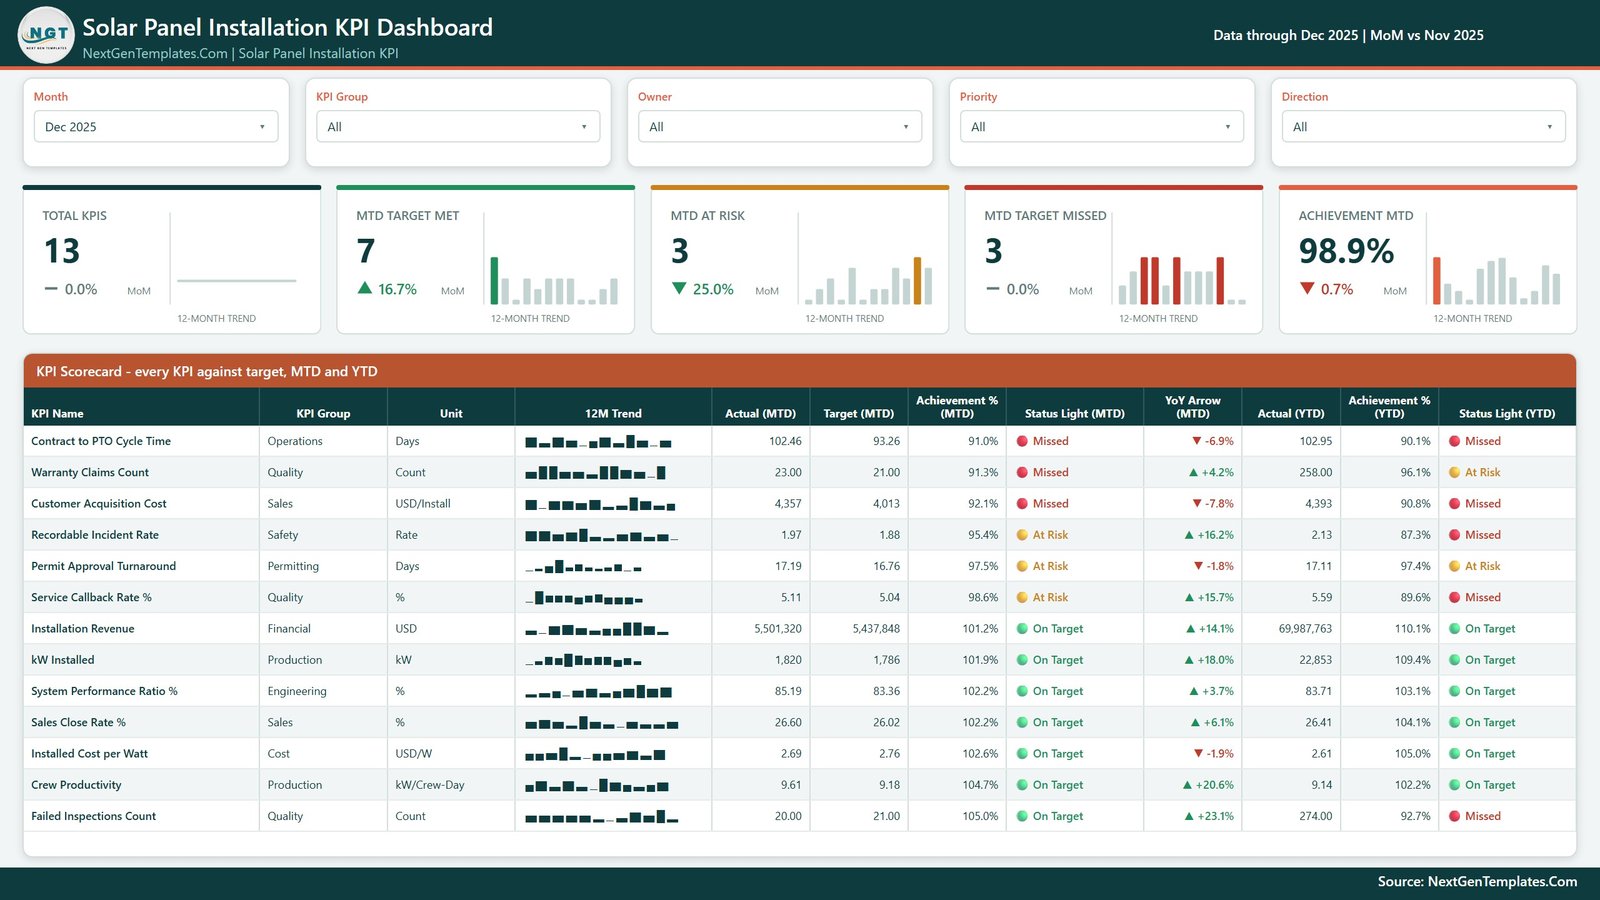
📅 One month picker, four more slicers. Month, KPI Group, Owner, Priority and Direction slicers sit across the top of the KPI Scorecard page. Pick Nov 2025 and every card, sparkline and traffic light re-scores for that month, while each 12-month trend keeps showing the full year.
🚦 Direction-aware traffic lights. The dashboard tracks 5 higher-is-better and 8 lower-is-better KPIs. Higher-is-better KPIs score Actual / Target; lower-is-better KPIs such as Installed Cost per Watt and Contract to PTO Cycle Time score Target / Actual, so beating a cost or cycle-time target reads above 100%. On Target is 100% or more, At Risk is 95% to 100%, Missed is below 95%.
📈 Five header cards with month-on-month change. Total KPIs, MTD Target Met, MTD At Risk, MTD Target Missed and Achievement MTD each show the MoM change against the previous month and a 12-month trend strip, so a slipping month is visible before you read the table.
🔁 A YoY arrow that means “better” or “worse”. The YoY Arrow (MTD) column reports improvement against the same month last year, adjusted for direction. Failed Inspections Count falling from 26 to 20 shows a green ▲ +23.1%, while Contract to PTO Cycle Time rising from 95.87 to 102.46 days shows a red ▼ -6.9%.
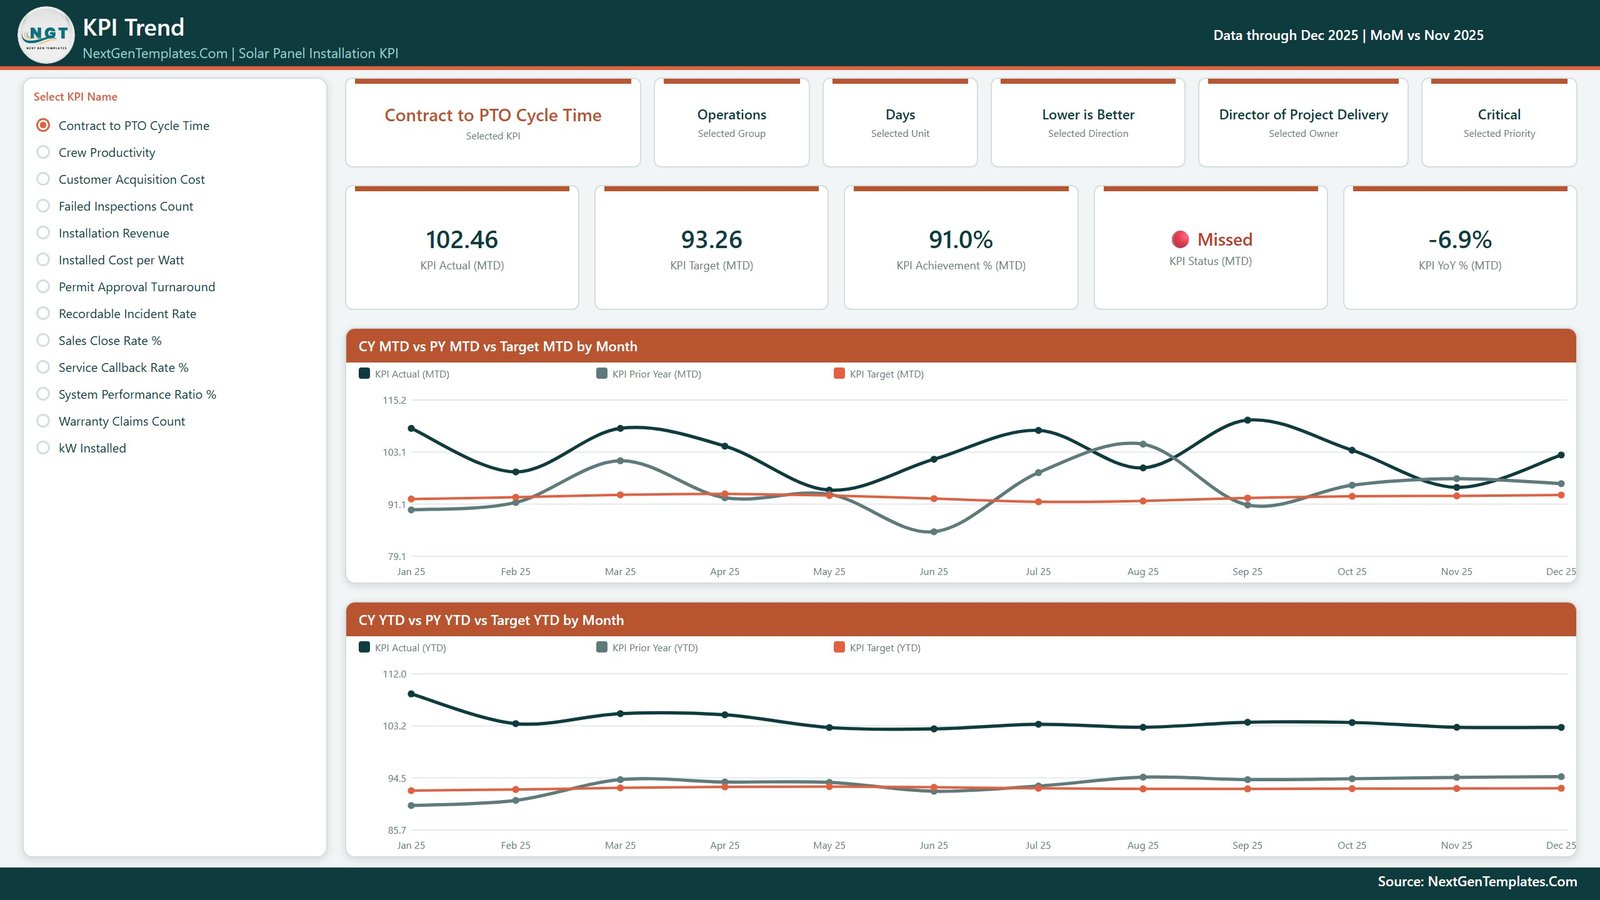
🔍 Drill into any single KPI. The KPI Trend page lists all 13 KPIs as a radio list and plots CY MTD vs PY MTD vs Target MTD by Month and CY YTD vs PY YTD vs Target YTD by Month for the one you choose.
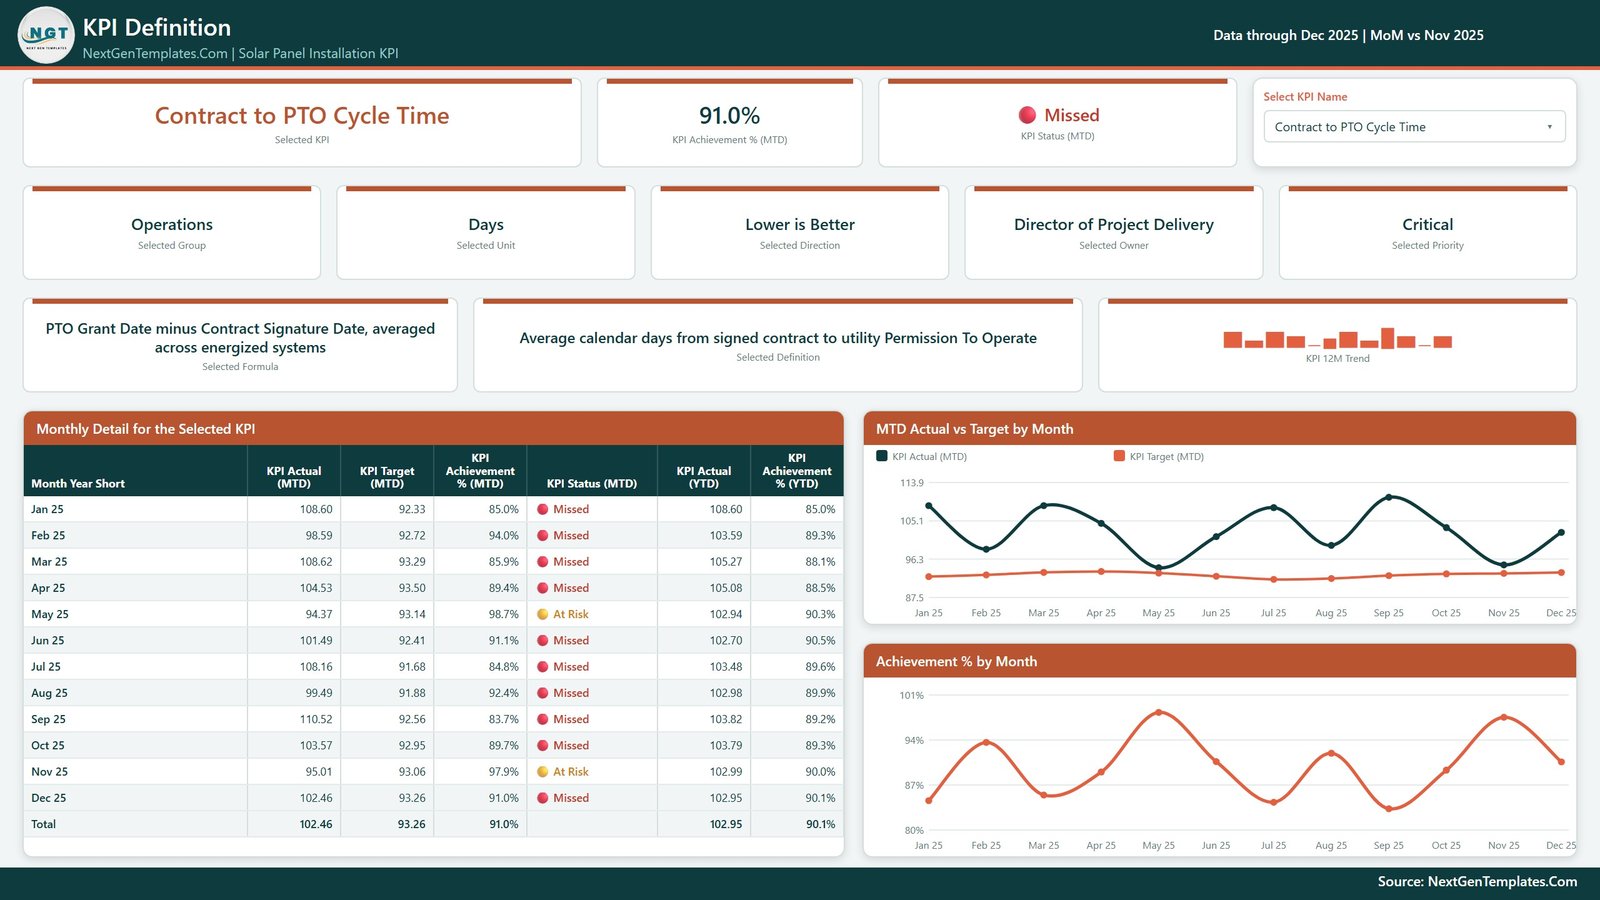
📖 Formula and definition on screen. The KPI Definition page shows the selected KPI’s formula, plain-English definition, owner, priority and a 12-month Monthly Detail table with a Total row, so a crew lead and a CFO read the same number the same way.
🧩 No hard-coded KPIs. Rename, add or delete a KPI in Data.xlsx and press Refresh; the scorecard, the KPI list and every chart follow the rows that exist.
📦 What’s Inside the Solar Panel Installation KPI Dashboard in Power BI
The download is one ZIP holding three files: the .pbix report file, Data.xlsx (Read Me, KPI Definition, Input_ Target and Input_ Actual sheets) and a Power BI Dashboard user manual PDF. The report has 4 visible pages plus 2 hidden tooltip pages (Trend Detail and KPI Detail).
The 13 KPIs shipped in the sample file:
| KPI Name | KPI Group | Unit | Direction | Priority |
|---|---|---|---|---|
| kW Installed | Production | kW | Higher is better | Critical |
| Installed Cost per Watt | Cost | USD/W | Lower is better | Critical |
| Contract to PTO Cycle Time | Operations | Days | Lower is better | Critical |
| Permit Approval Turnaround | Permitting | Days | Lower is better | High |
| Failed Inspections Count | Quality | Count | Lower is better | Critical |
| Sales Close Rate % | Sales | % | Higher is better | High |
| Customer Acquisition Cost | Sales | USD/Install | Lower is better | Critical |
| Installation Revenue | Financial | USD | Higher is better | Critical |
| Crew Productivity | Production | kW/Crew-Day | Higher is better | High |
| Service Callback Rate % | Quality | % | Lower is better | High |
| Recordable Incident Rate | Safety | Rate | Lower is better | Critical |
| Warranty Claims Count | Quality | Count | Lower is better | Medium |
| System Performance Ratio % | Engineering | % | Higher is better | High |
Page 1: KPI Scorecard
This page shows the Month, KPI Group, Owner, Priority and Direction slicers, five cards (Total KPIs, MTD Target Met, MTD At Risk, MTD Target Missed, Achievement MTD) and a KPI Scorecard table with KPI Group, Unit, 12M Trend, Actual (MTD), Target (MTD), Achievement % (MTD), Status Light (MTD), YoY Arrow (MTD), Actual (YTD), Achievement % (YTD) and Status Light (YTD) for every KPI.
Page 2: KPI Trend
This page shows a Select KPI Name list, context cards for the selected KPI’s group, unit, direction, owner and priority, five value cards (KPI Actual, KPI Target, KPI Achievement %, KPI Status and KPI YoY %, all MTD) and two charts: CY MTD vs PY MTD vs Target MTD by Month and CY YTD vs PY YTD vs Target YTD by Month.
Page 3: KPI Definition
This page shows the selected KPI with its Achievement % and Status, group, unit, direction, owner, priority, formula, definition and 12-month trend, a Monthly Detail table (KPI Actual, Target, Achievement % and Status for MTD, plus Actual and Achievement % for YTD) and two charts: MTD Actual vs Target by Month and Achievement % by Month.
Page 4: Get More Templates
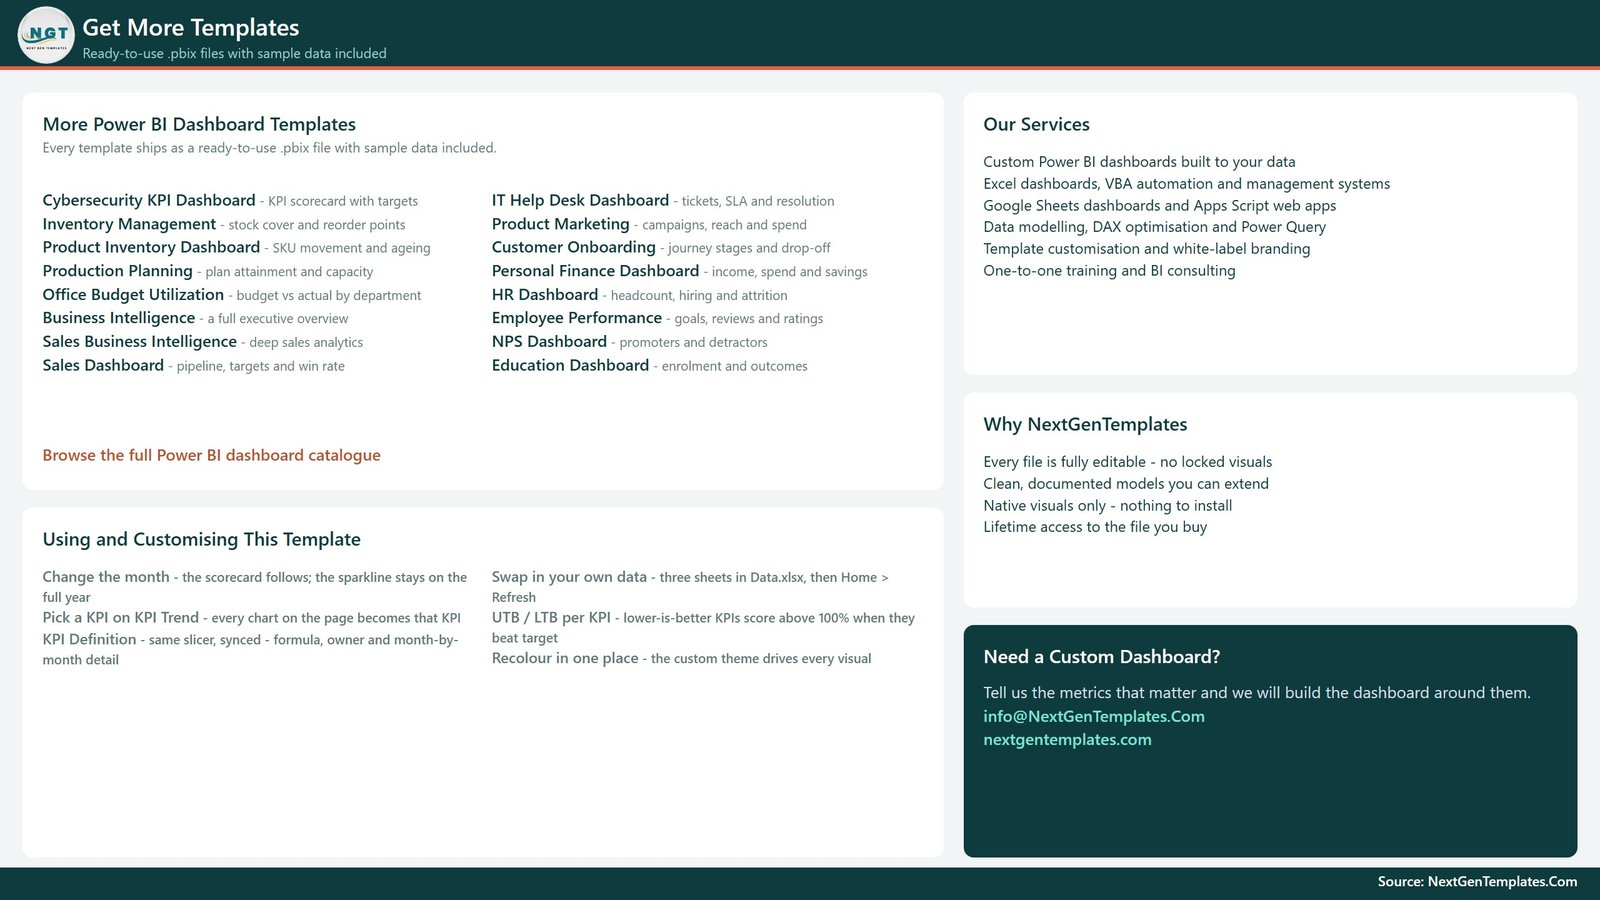
This page lists more Power BI dashboard templates, quick tips for using and customising this template (change the month, pick a KPI, swap in your own data, recolour through the theme) and contact details for custom dashboard work.
📊 Power BI Solar Installer KPI Dashboard vs. Tableau / Qlik Build vs. Solar CRM / Project SaaS — Where This Fits
| Feature | This Power BI KPI Dashboard | Tableau / Qlik build | Solar CRM / project SaaS |
|---|---|---|---|
| Cost | ✅ $12.99 one-time | Per-user licence plus build time | Per-user monthly subscription |
| Platform | Power BI Desktop (free, Windows) | Tableau / Qlik desktop or cloud | Vendor web app |
| Setup time | ✅ Under an hour with your own numbers | Days to design from scratch | Onboarding and data migration |
| 13 installer KPIs with traffic lights, pre-built | ✅ Yes | Build it yourself | Depends on vendor |
| Lower-is-better scoring (cost, cycle time, callbacks) | ✅ Built in | Build it yourself | Depends on vendor |
| Customizable KPIs and targets | ✅ Edit Data.xlsx and refresh | ✅ Yes | Limited to vendor fields |
| Real-time team collaboration | Share through Power BI Service (Pro licence) | ✅ Server / cloud licence | ✅ Built in |
| Mobile access | Power BI mobile app after publishing | ✅ Mobile app | ✅ Usually included |
| Year-1 cost at 5 users | ✅ $12.99 for the file (Pro licences only if you share online) | 5 licences plus build hours | 5 × monthly seat price × 12 |
For solar installers who want a month-by-month KPI review without paying for another per-seat platform, this Power BI file sits in the sweet spot.
👥 Who This Template Is For — and Who It’s Not For
✅ This template is built for:
- Owners and operations managers of residential or commercial solar installation companies who run a monthly KPI review
- Project delivery, permitting and quality leads who need Contract to PTO, permit turnaround and failed inspections on one page
- Finance and sales leaders tracking Installation Revenue, Customer Acquisition Cost and Sales Close Rate % against target
- Consultants and analysts who build KPI packs for solar EPC or installer clients in Power BI
❌ This template is NOT for:
- Live system monitoring — it reads monthly figures from Excel, not inverter, SCADA or monitoring-portal feeds
- Permit, interconnection, electrical-code, NABCEP or incentive compliance records — it reports your numbers and certifies nothing
- Energy-yield or production guarantees for customers
- Mac-only teams without access to Windows, since Power BI Desktop runs on Windows
⚙️ How to Use This Solar Installer KPI Dashboard
- Unzip the .pbix, Data.xlsx and the user manual into one folder and keep them together.
- Open the .pbix in Power BI Desktop, which is free from Microsoft.
- If you moved the workbook, go to Home > Transform data > Data source settings > Change Source and point it at Data.xlsx.
- On the KPI Definition sheet, keep one row per KPI and set Type to UTB (higher is better) or LTB (lower is better).
- Fill Input_ Target with MTD and YTD targets for the reporting year, and Input_ Actual with MTD and YTD actuals for that year and the year before.
- Press Home > Refresh, then pick a month on the KPI Scorecard page.
💼 Real-World Use Cases
Maria runs operations for a 40-crew residential installer. Each month she picks the new month on the KPI Scorecard, filters Direction to lower-is-better and walks her team through Contract to PTO Cycle Time, Permit Approval Turnaround and Service Callback Rate %, which are the three KPIs her customers feel first.
Dev is the controller at a commercial solar EPC. He uses the KPI Trend page to show the board Installed Cost per Watt and Installation Revenue against target and prior year, and the KPI Definition page to settle what “installed cost” includes before anyone argues about the number.
Aisha is a quality and safety lead. She filters the scorecard by the Quality and Safety groups and tracks Failed Inspections Count, Warranty Claims Count and Recordable Incident Rate month by month, with the owner of each KPI named on screen.
❓ Frequently Asked Questions
What KPIs does the Solar Panel Installation KPI Dashboard in Power BI track?
It ships with 13 KPIs in 9 groups: kW Installed, Installed Cost per Watt, Contract to PTO Cycle Time, Permit Approval Turnaround, Failed Inspections Count, Sales Close Rate %, Customer Acquisition Cost, Installation Revenue, Crew Productivity, Service Callback Rate %, Recordable Incident Rate, Warranty Claims Count and System Performance Ratio %. You can rename, add or remove KPIs in Data.xlsx.
Is this the KPI Dashboard or the KPI Scorecard product?
This is the Power BI KPI Dashboard family: a month-picker scorecard with traffic lights, a KPI Trend page and a KPI Definition page. The Solar Panel Installation KPI Scorecard in Excel and in Google Sheets are separate products with their own layout, and they are linked below.
How long does setup take?
Opening the file takes minutes because sample data is already loaded. Replacing it with your own targets and actuals usually takes under an hour for 13 KPIs: fill the three sheets in Data.xlsx, press Home > Refresh, and every page of the report updates.
Are the YTD figures calculated automatically?
No. The YTD Actual and YTD Target values are read from the YTD column you enter in Data.xlsx, not rebuilt from the monthly figures. Enter additive KPIs such as revenue, kW and counts as a running sum, and rates or days as the average of the months so far, as the Read Me sheet explains.
Do I need a paid Power BI licence?
No. Power BI Desktop is free and opens the .pbix on Windows. You only need a Power BI Pro or Premium Per User licence if you want to publish the report to the Power BI Service and share it with colleagues online.
Does it confirm permit, code, NABCEP or incentive compliance?
No. The dashboard reports the figures you enter against the targets you set. It is not a permitting, interconnection, electrical-code, NABCEP or incentive record, and it makes no energy-yield or production guarantee. The shipped numbers are fictional sample data.
How does it compare to a solar CRM or project-management subscription?
A solar CRM runs your jobs day to day and bills per user each month. This Power BI KPI dashboard is a one-time $12.99 file for the monthly management review: it scores 13 KPIs against target and prior year from figures you export from whatever system you already use.
👤 About the Author
Built by PK — Microsoft Certified Professional with 15+ years of Excel, Google Sheets and Power BI experience. Founder of NextGenTemplates, reaching 300K+ subscribers across YouTube channels (@PKAnExcelExpert, @NextGenTemplates, @NeoTechNavigators). Every template is hand-built and tested before release.
🔗 Explore Related Templates
Also available as (same topic, KPI Dashboard family): the Solar Panel Installation KPI Dashboard in Excel and the Solar Panel Installation KPI Dashboard in Google Sheets. Each is a separate build for its own platform.
A different family on the same topic: the Solar Panel Installation KPI Scorecard in Excel and the Solar Panel Installation KPI Scorecard in Google Sheets use a scorecard layout instead of the month-picker dashboard.
🔆 Neighbouring Power BI KPI dashboards: Solar Parks KPI Dashboard in Power BI for plant operators, Solar Panel Manufacturing KPI Dashboard in Power BI for module makers, and Security System Installation KPI Dashboard in Power BI for another field-install trade.
Browse every Power BI KPI Dashboard template or the full Power BI template catalogue.
📖 Click here to read the Detailed Blog Post
🎥 Visit our YouTube channel for step-by-step video tutorials
👉 YouTube.com/@NextGenTemplates
📅 Last updated: September 2026