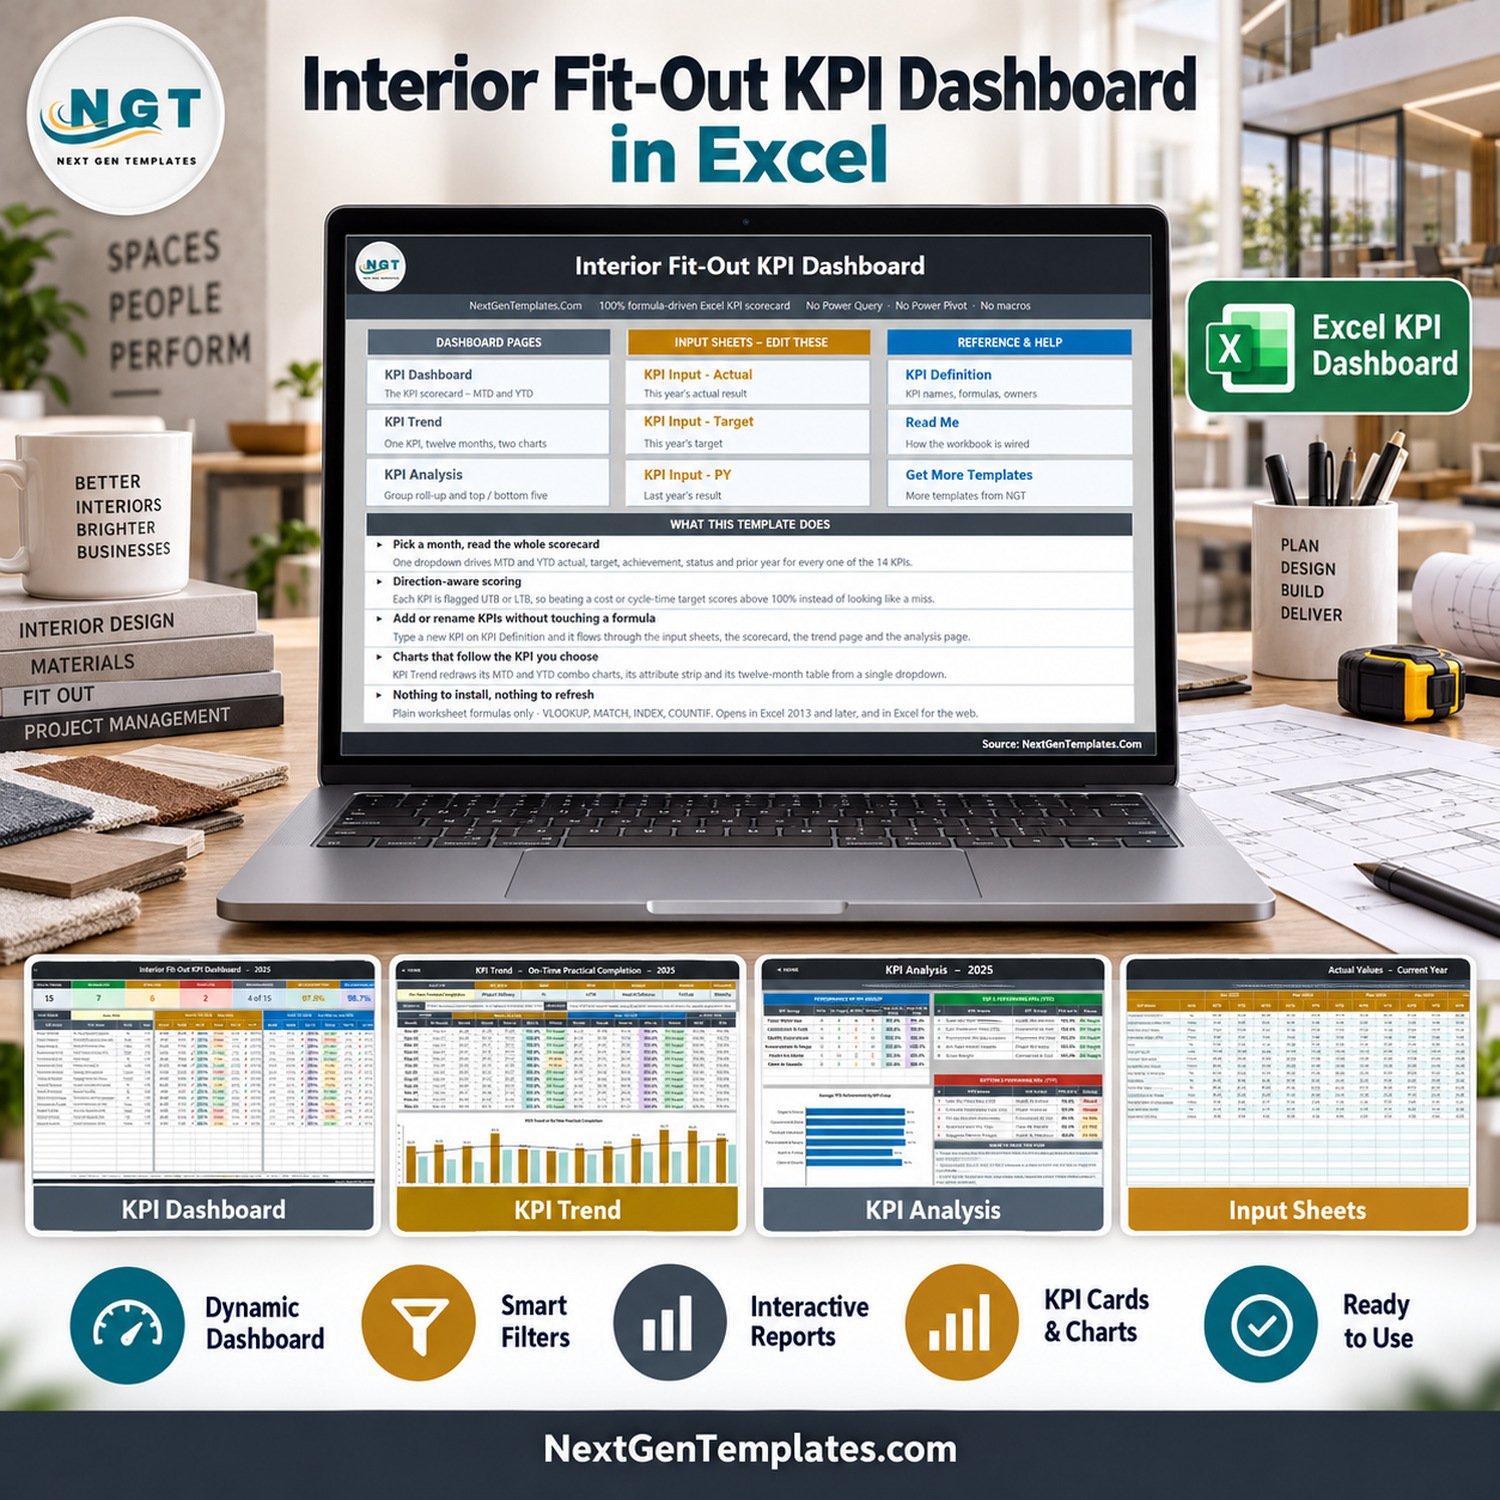
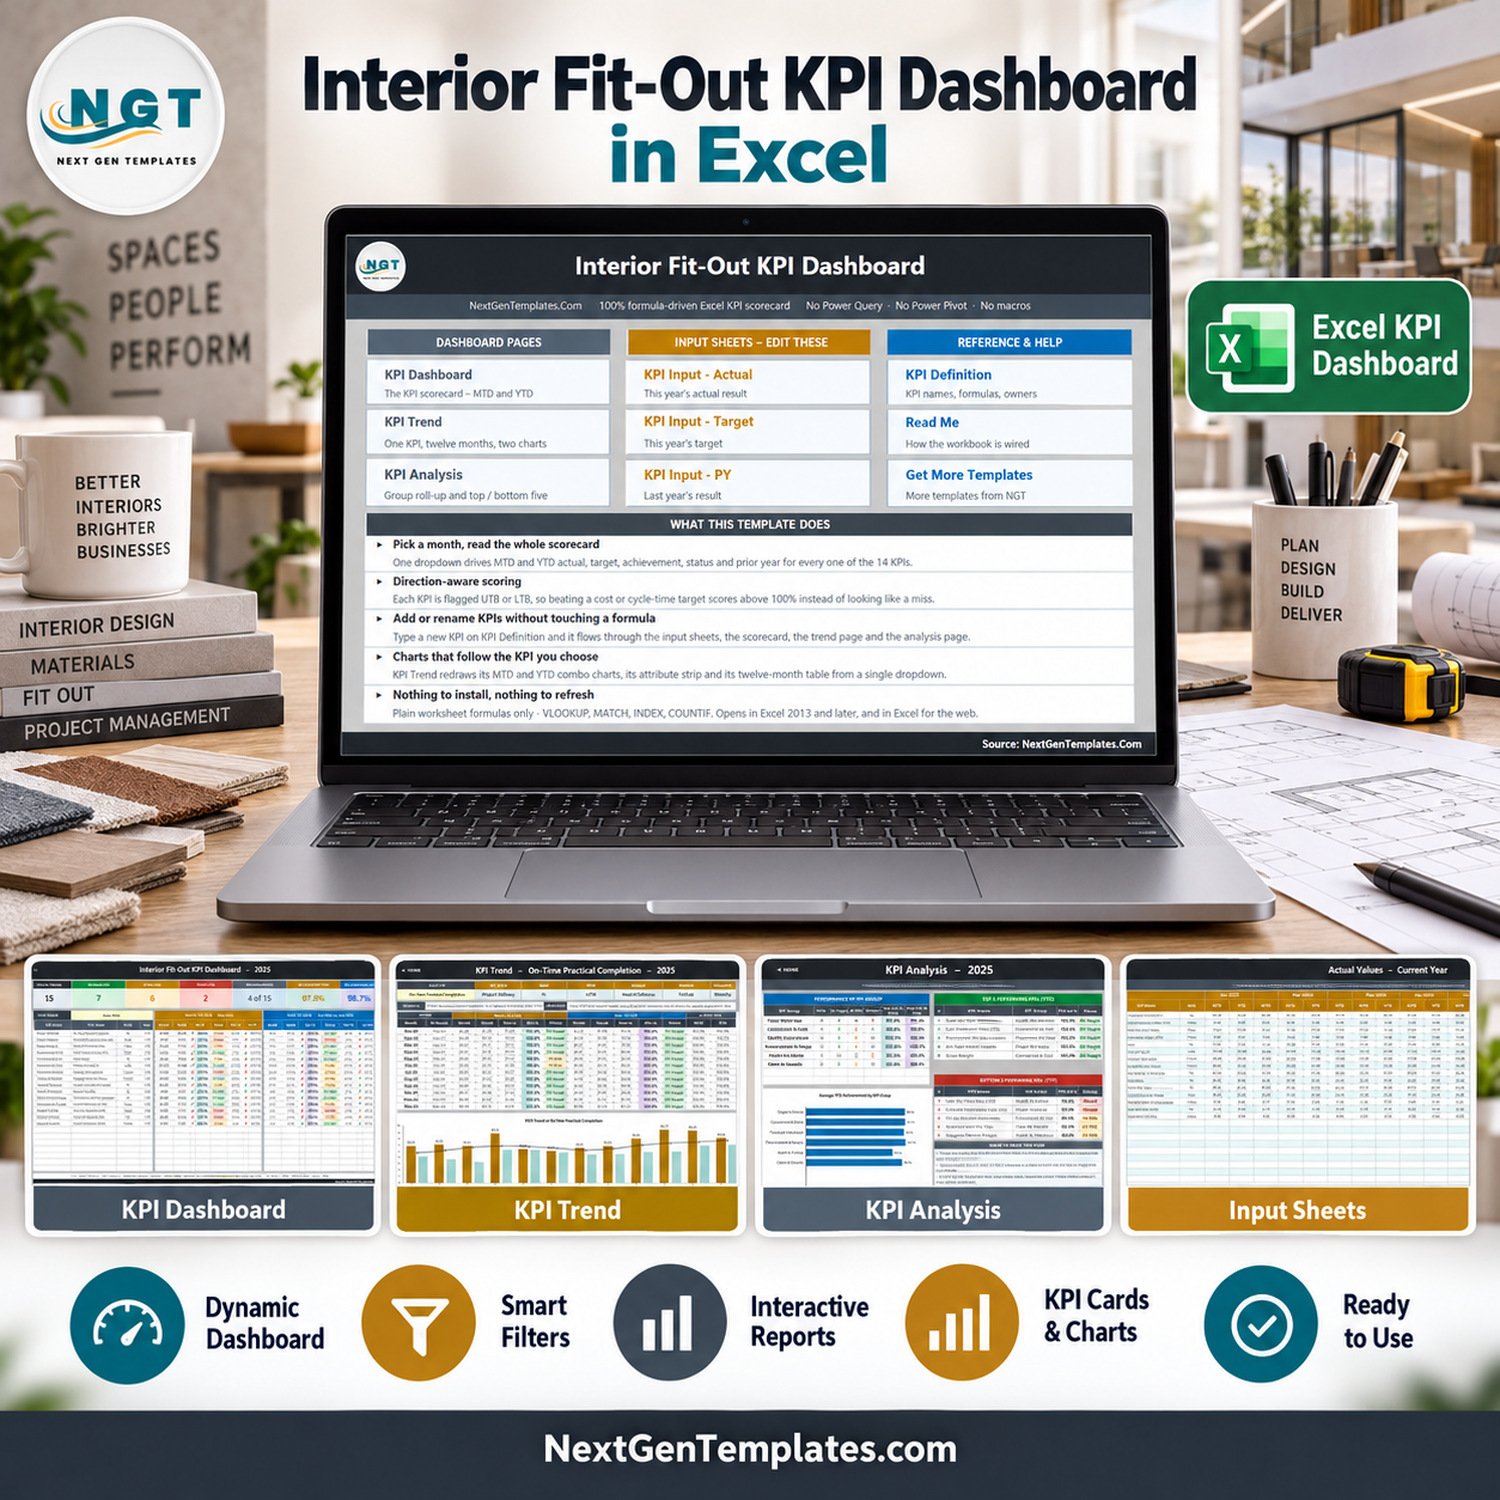
The Interior Fit-Out KPI Dashboard in Excel tracks 15 fit-out KPIs across 5 KPI groups and 11 worksheets, with 24 months of sample data (Jan 2025 to Dec 2025 plus the full prior year) already typed in. One month dropdown drives every card, every traffic light and both trend charts. Setup takes under 10 minutes: replace the sample rows on three input sheets and the whole scorecard re-bases.
🌍 Join 8,400+ teams in 40+ countries using NextGenTemplates to replace paid SaaS tools with one-time-purchase Excel, Google Sheets, Power BI and HTML templates.
✅ Instant download · One-time payment · No subscription · No per-user fees · Lifetime access
⚠️ Read this first. This is an Excel reporting template that presents numbers you type in. It does not establish compliance with building codes, fire safety, accessibility, permitting, licensing or construction-contract law. It is not a structural, electrical, mechanical, fire or safety assessment, not an inspection record, not a handover certificate and not a warranty. It does not produce estimates, bids or contracts that are binding, accurate or fit to hand to a customer, and it does not replace the statutory duties of a licensed contractor, designer or engineer. Every margin, snagging, cycle-time, variation and satisfaction figure shipped in the file is demo data invented for the sample, not a benchmark for your trade.
🔑 Key Features of the Interior Fit-Out KPI Dashboard in Excel
🔹 15 fit-out KPIs in five groups. Project Delivery (3), Commercial & Cost (4), Quality & Handover (3), Procurement & Supply (2), Health & Safety (1) and Client & Growth (2). Named metrics include On-Time Practical Completion, Schedule Performance Index, Average Fit-Out Cycle Time, Cost Performance Index, Gross Margin, Fit-Out Cost per Sq Ft, Change Orders Approved, Snagging Defects per Project, Practical-Completion Pass Rate, Rework Cost Ratio, Subcontractor On-Time Completion, Joinery & Material Lead Time, Lost Time Injury Rate, Quote-to-Award Win Rate and Client Satisfaction.
🔹 MTD and YTD side by side. Every KPI row carries actual, target, achievement percentage, status, prior-year comparator and a year-on-year arrow for the selected month and for the year to date — 12 columns of context per KPI, on one screen.
🔹 Direction-aware scoring. Each KPI is flagged UTB (upper the better) or LTB (lower the better). Achievement is Actual ÷ Target for UTB and Target ÷ Actual for LTB, so beating a cost or cycle-time target scores above 100% instead of reading as a miss. The year-on-year arrows are coloured the same way — we checked the conditional-formatting rules directly, and a falling cost genuinely renders as a green down-arrow.
🔹 No macros, no Power Query, no data model. Plain worksheet formulas only — VLOOKUP, MATCH, INDEX, COUNTIF, AVERAGEIF, LARGE and SMALL. Nothing is locked or hidden. It opens in Excel 2013 and later and in Excel for the web.
🔹 Capacity for 22 KPIs. Fifteen rows are filled; the remaining rows are live and empty, so adding a sixteenth KPI needs no formula work — type it on KPI Definition and it flows through the input sheets, the scorecard, the trend page and the analysis page.
📦 What’s Inside the Interior Fit-Out KPI Dashboard in Excel
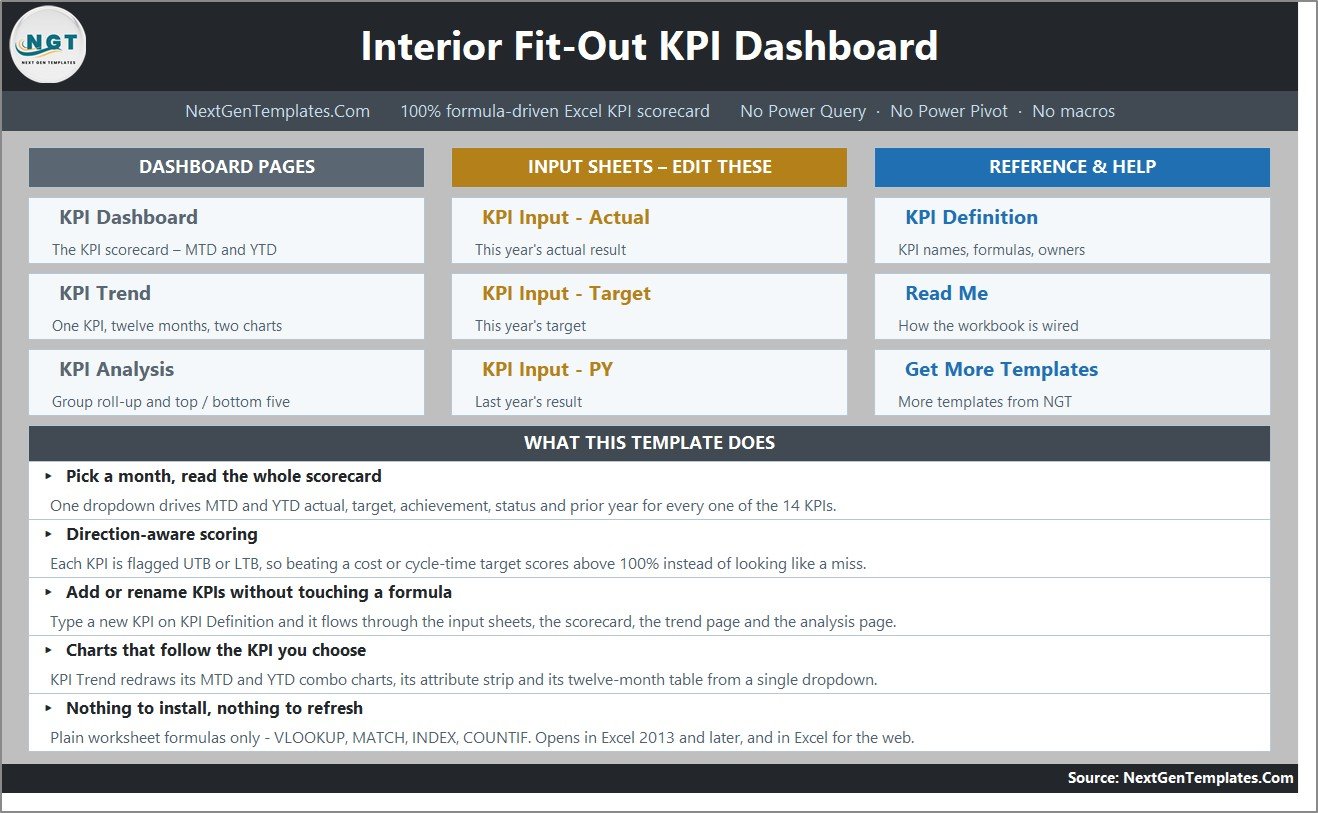
Page 1: Home
A navigation hub linking the three dashboard pages, the three input sheets and the three reference sheets, with a short summary of what the workbook does.
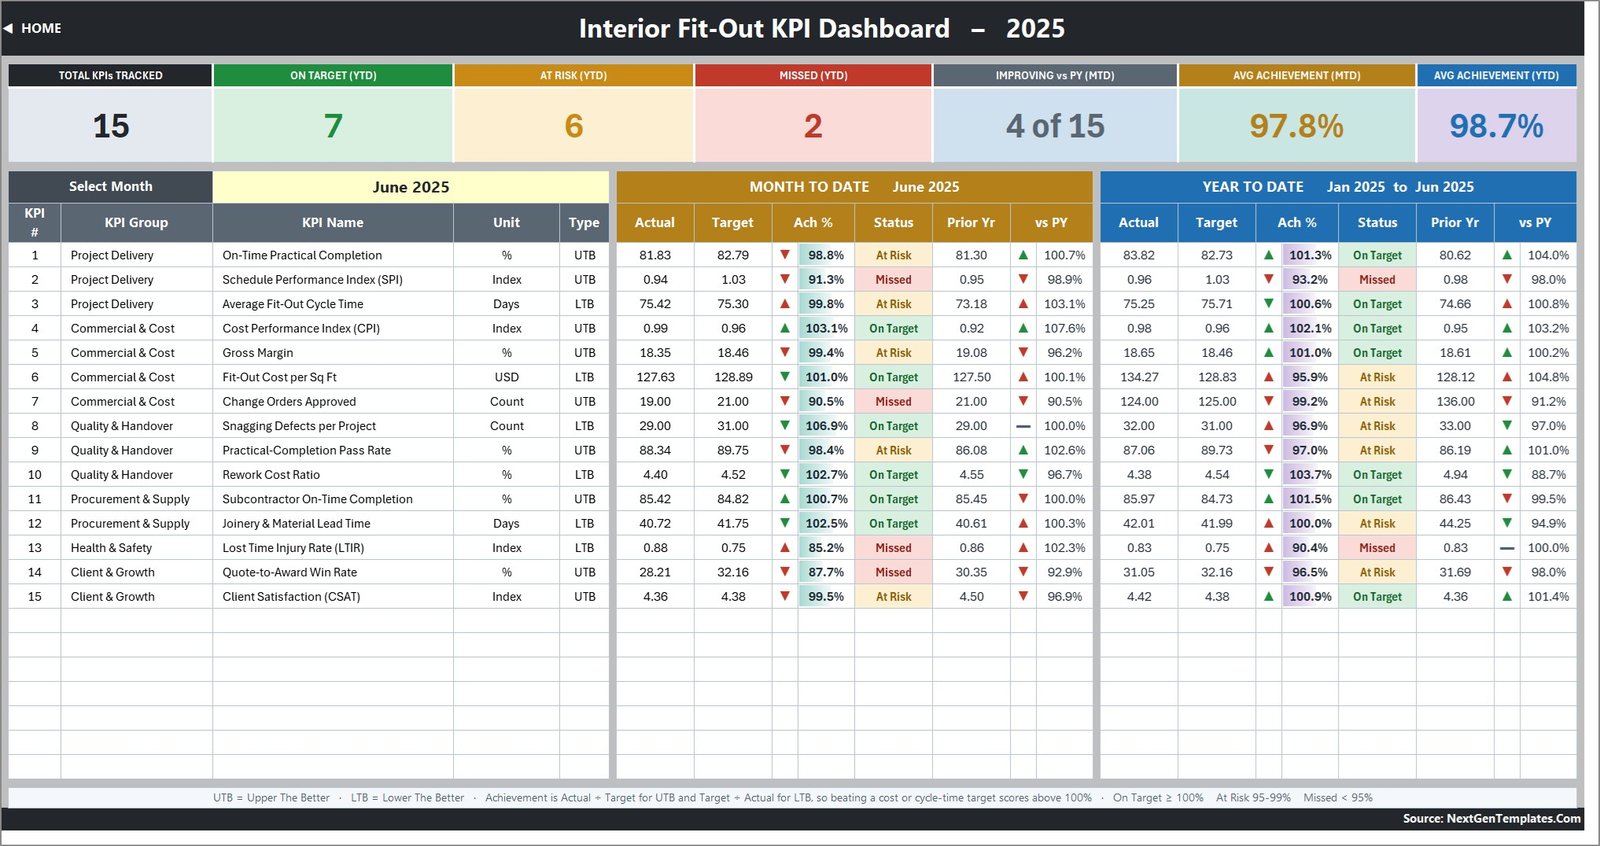
Page 2: KPI Dashboard (the scorecard)
The month picker plus seven summary cards — Total KPIs Tracked, On Target (YTD), At Risk (YTD), Missed (YTD), Improving vs PY (MTD), Avg Achievement (MTD) and Avg Achievement (YTD). Below them, one row per KPI with MTD and YTD actual, target, achievement, status pill and prior-year movement. In the shipped sample (June 2025) the cards read 15 / 7 / 6 / 2 / 4 of 15 / 97.8% / 98.7%.
Page 3: KPI Trend
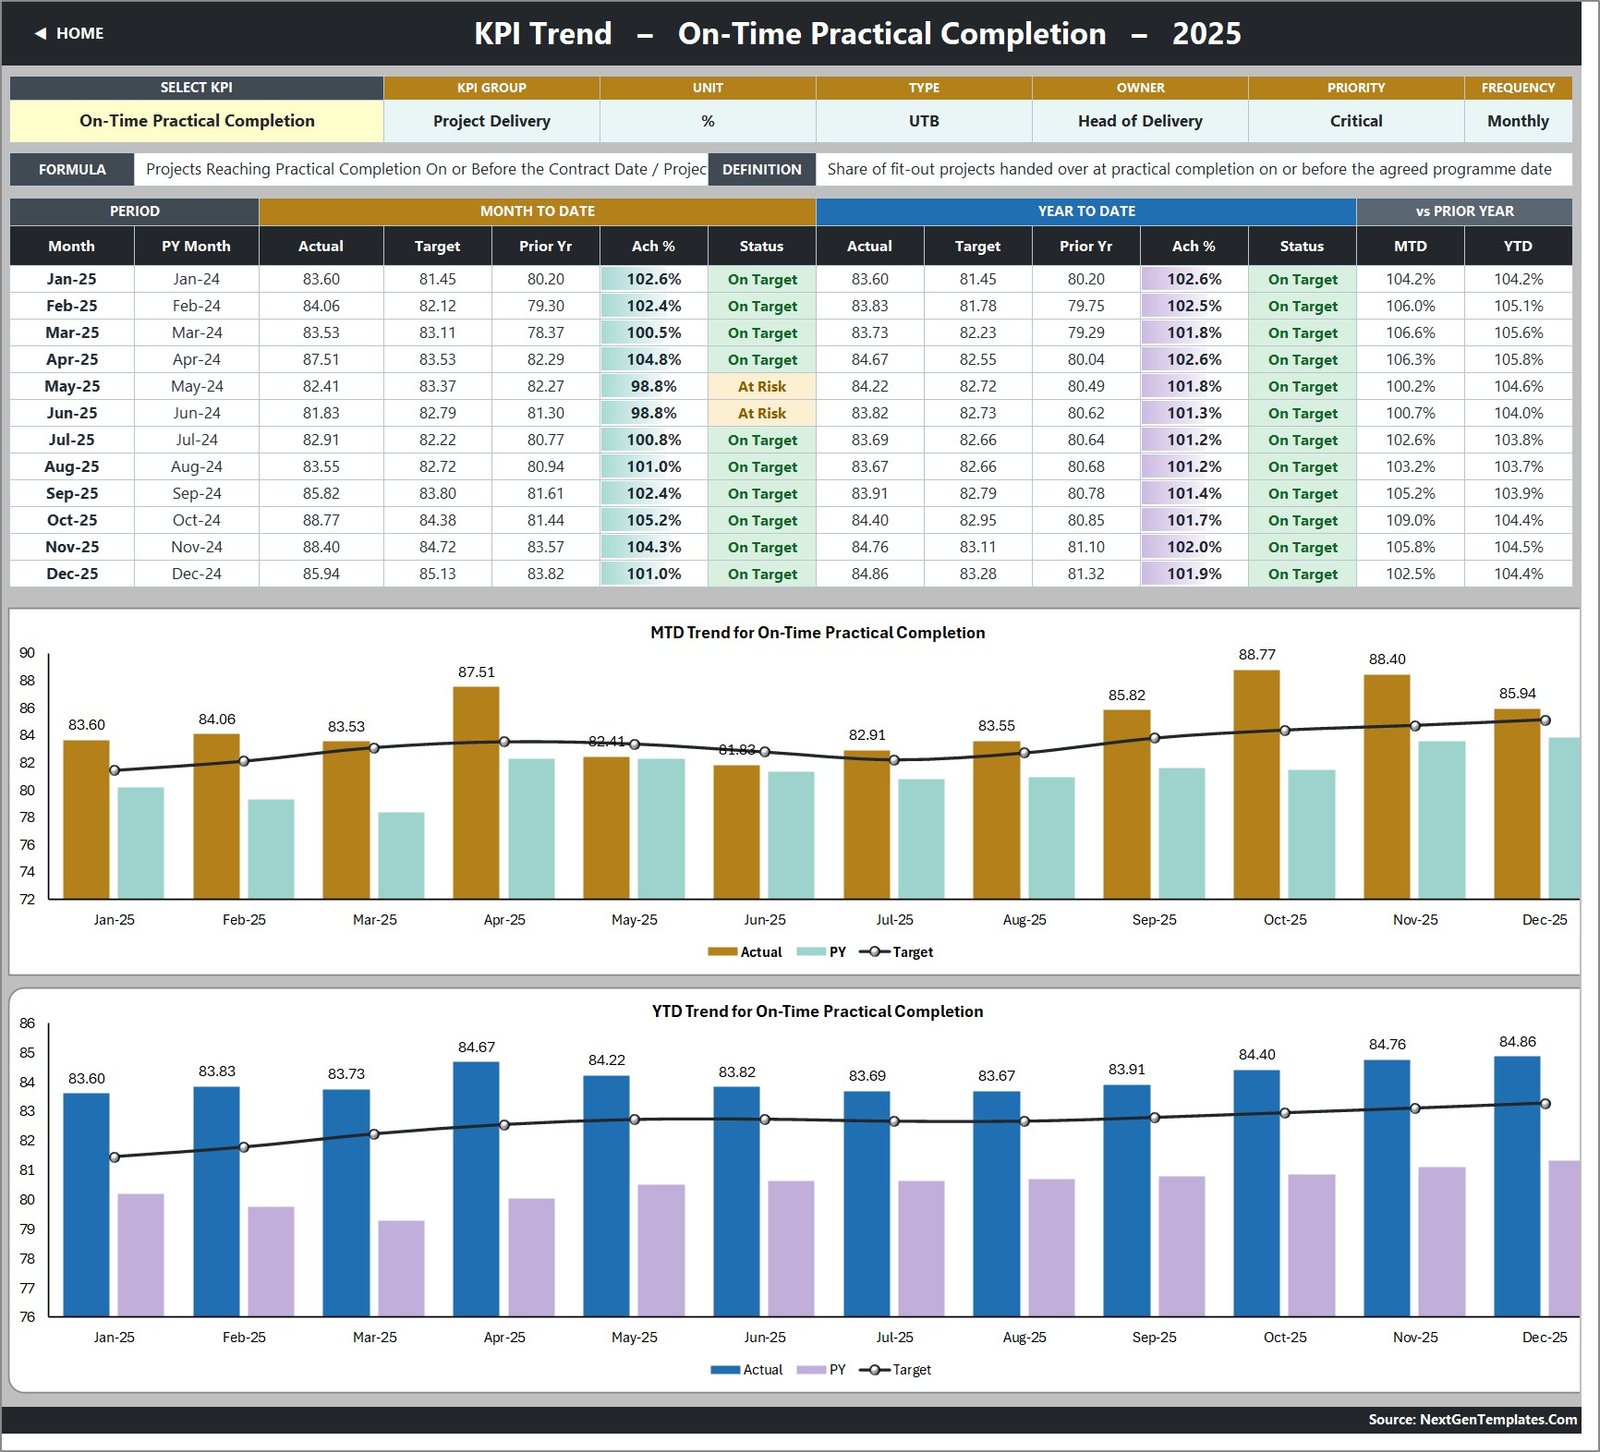
One KPI at a time, chosen from a dropdown: its group, unit, type, owner, priority and frequency, its formula and definition, a twelve-month table of MTD and YTD actual, target, prior year, achievement and status, and two combo charts plotting actual and prior-year columns against a target line.
Page 4: KPI Analysis
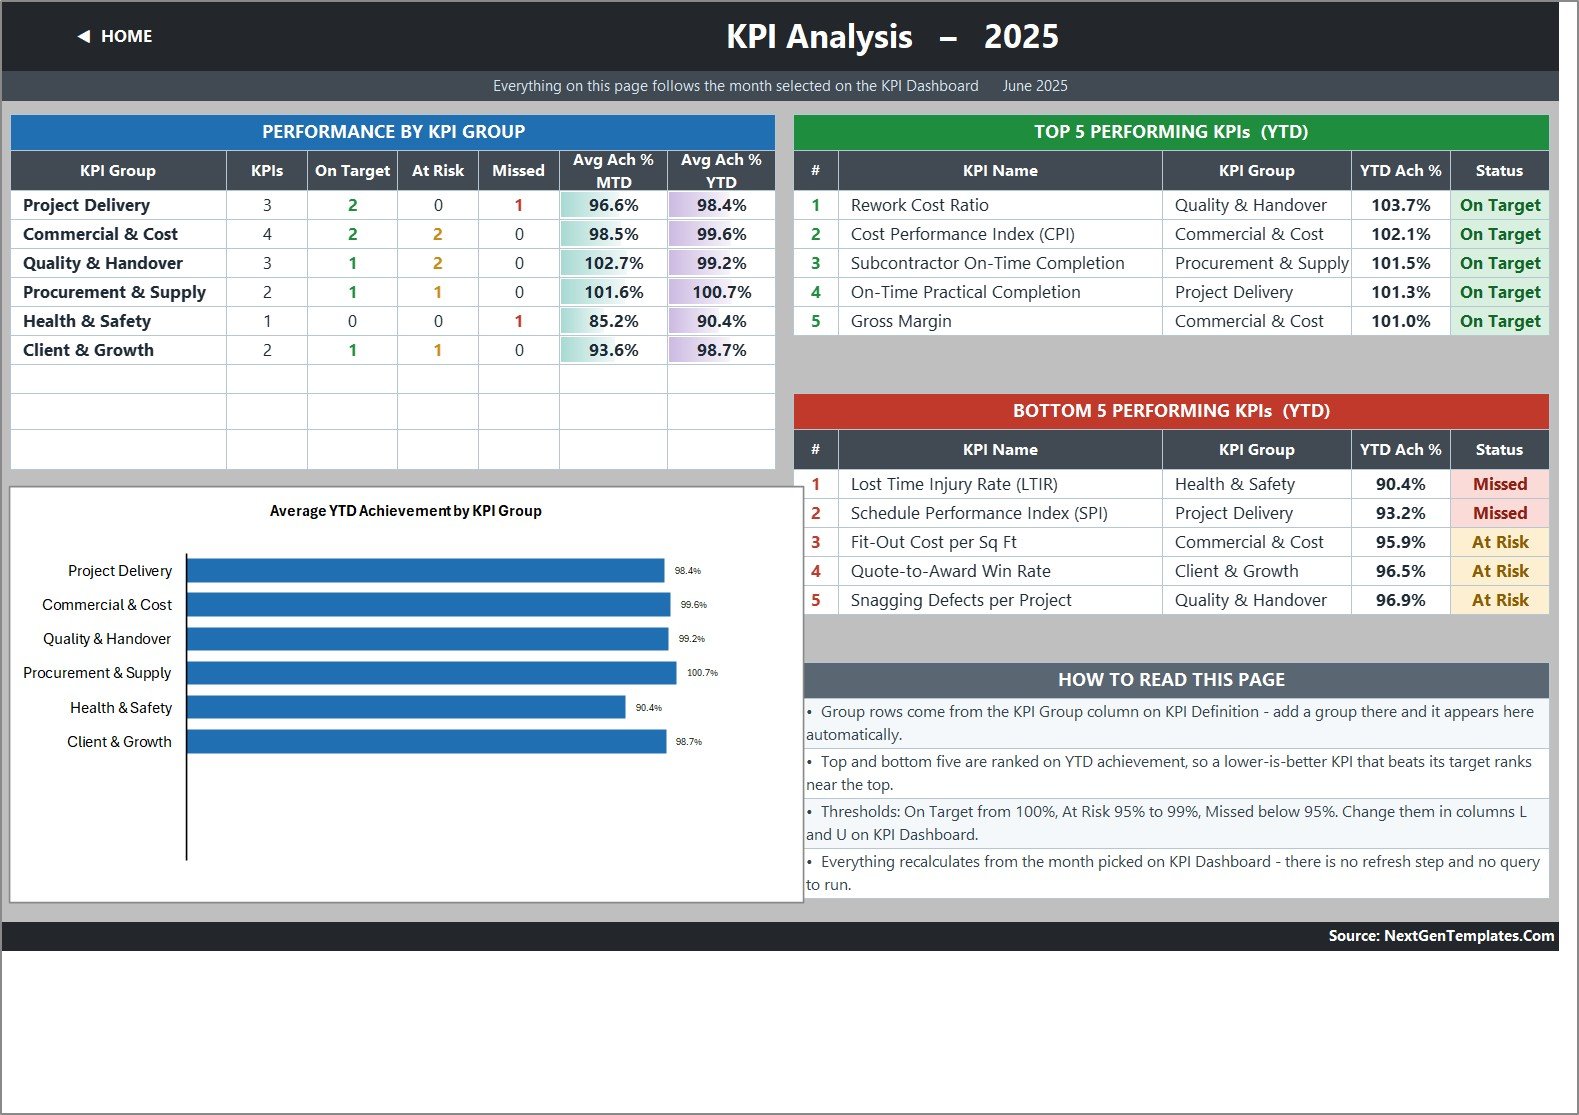
Achievement rolled up by KPI group — count, On Target, At Risk, Missed, Avg Ach % MTD and Avg Ach % YTD — with an Average YTD Achievement by KPI Group chart, plus Top 5 and Bottom 5 performing KPIs ranked on year-to-date achievement.
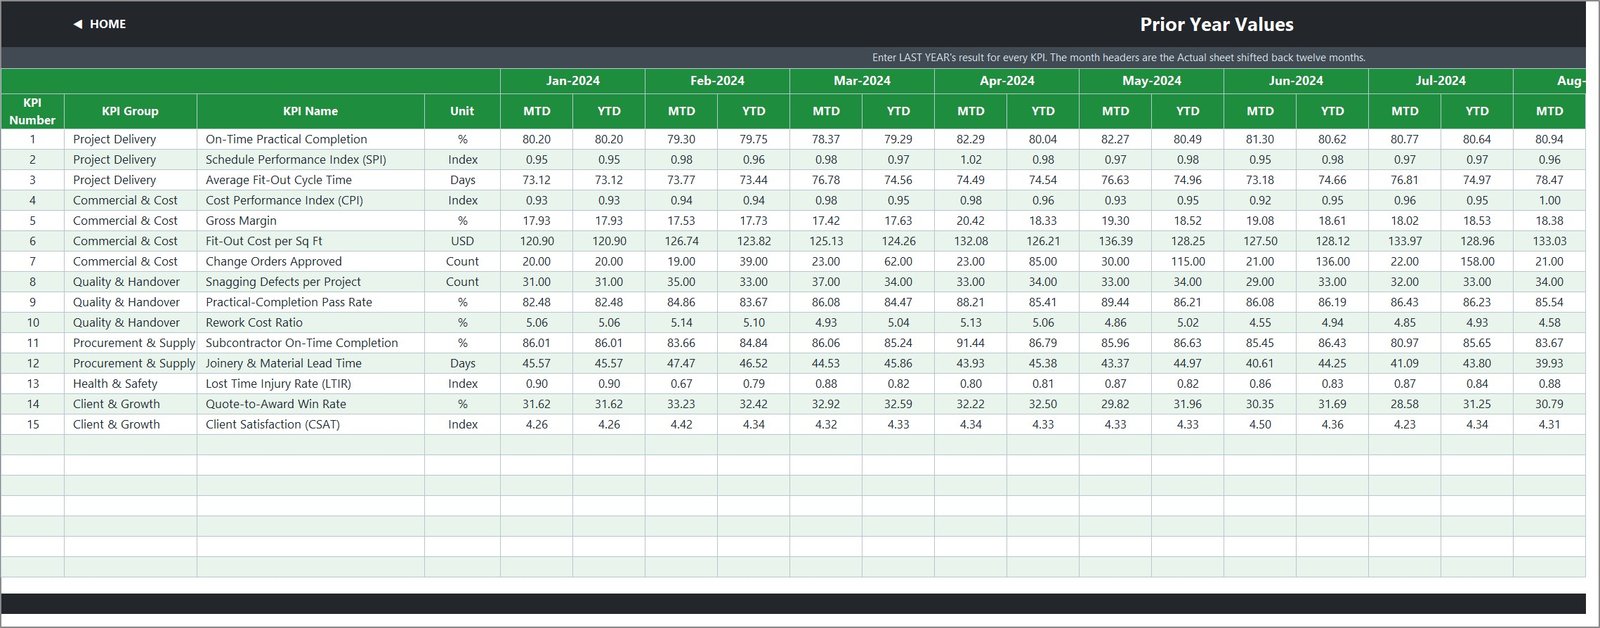
Pages 5-7: KPI Input — Actual, Target and Prior Year
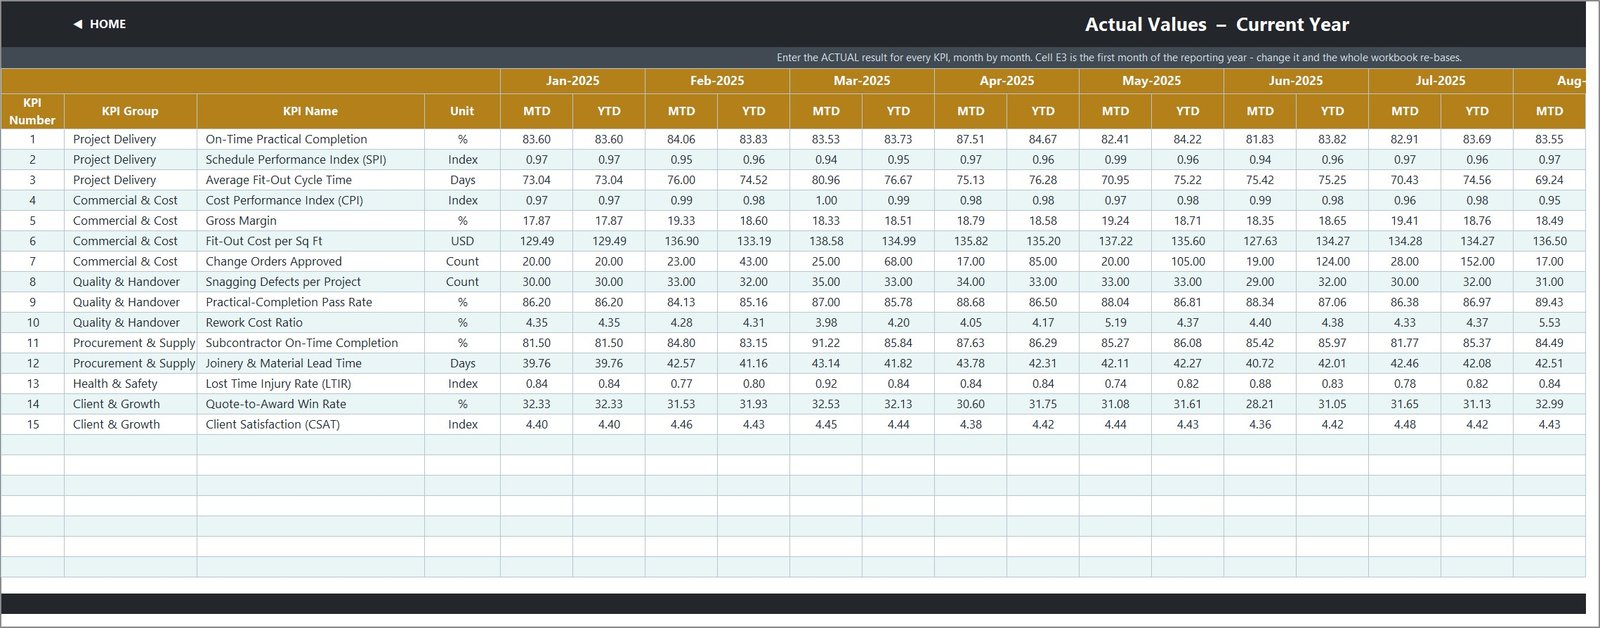
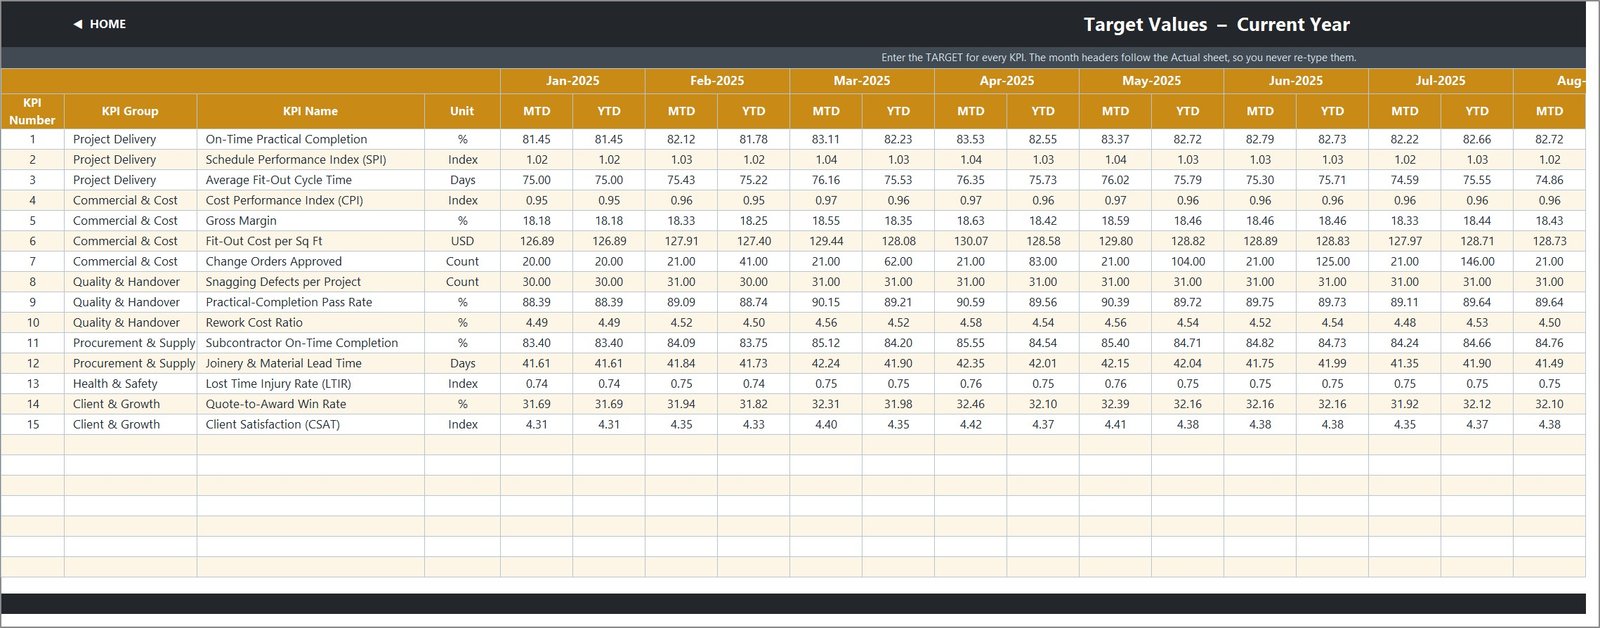
The three sheets you actually type in. Each holds an MTD and a YTD cell for every KPI for all twelve months; the Target and Prior Year sheets take their month headers from the Actual sheet, so you never re-type a date.
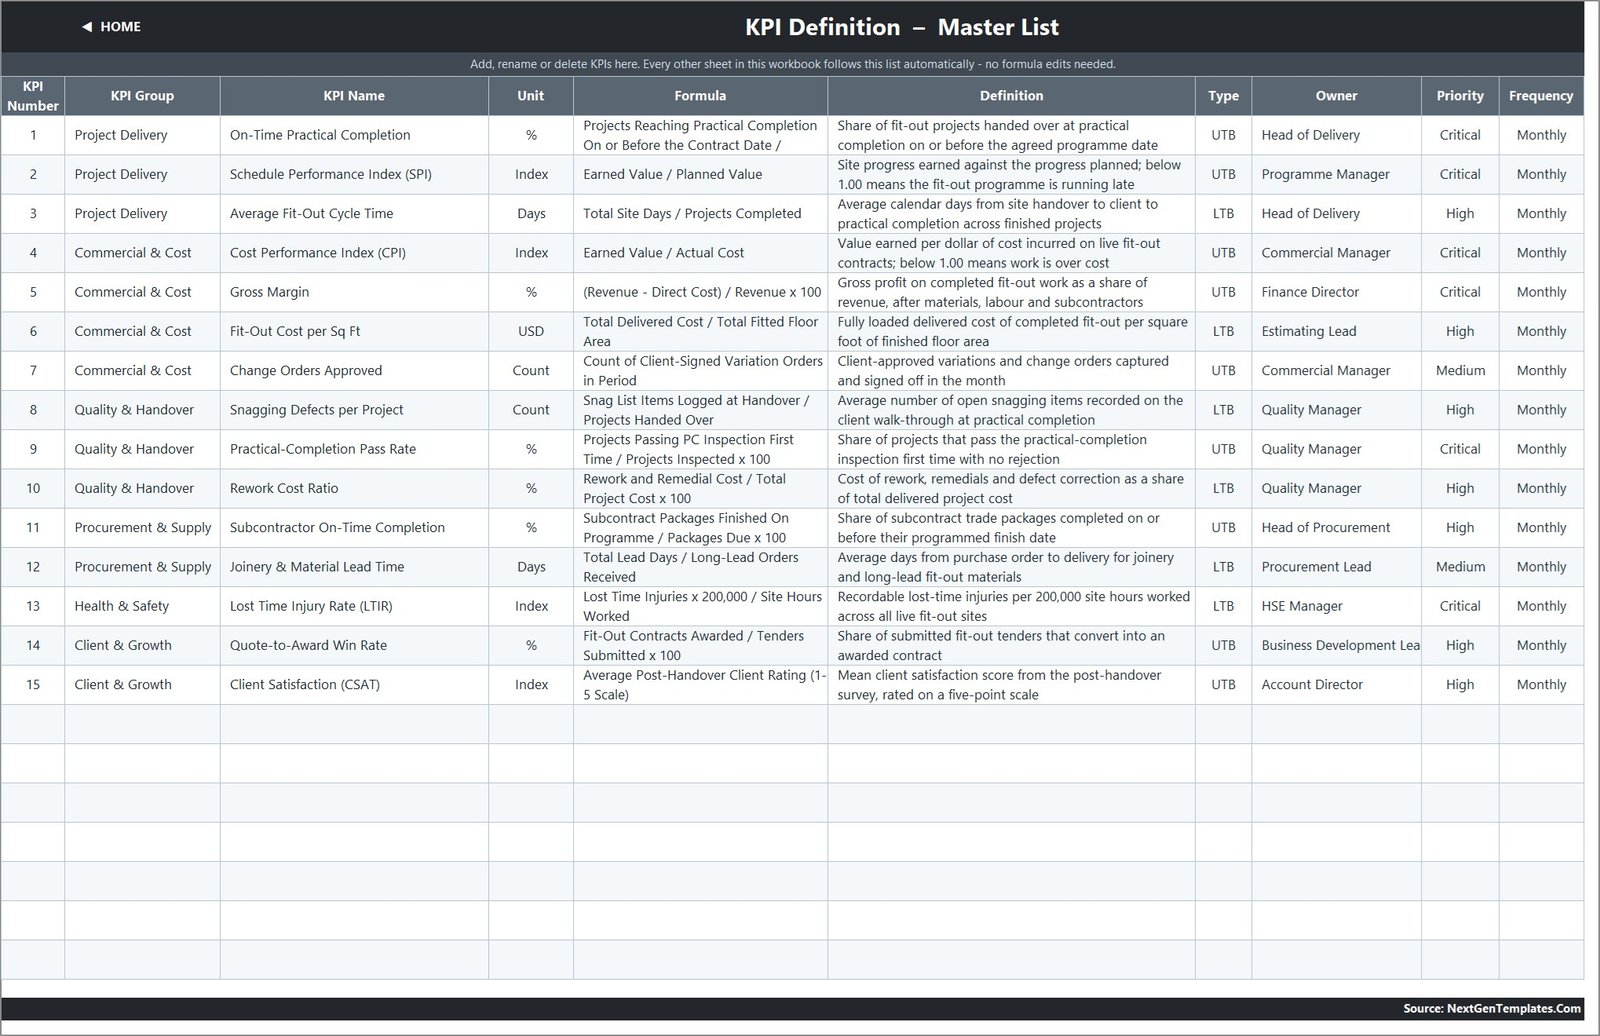
Page 8: KPI Definition
The master list — number, group, name, unit, formula, definition, UTB/LTB type, owner, priority and frequency for each of the 15 KPIs. Every other sheet reads names from here.
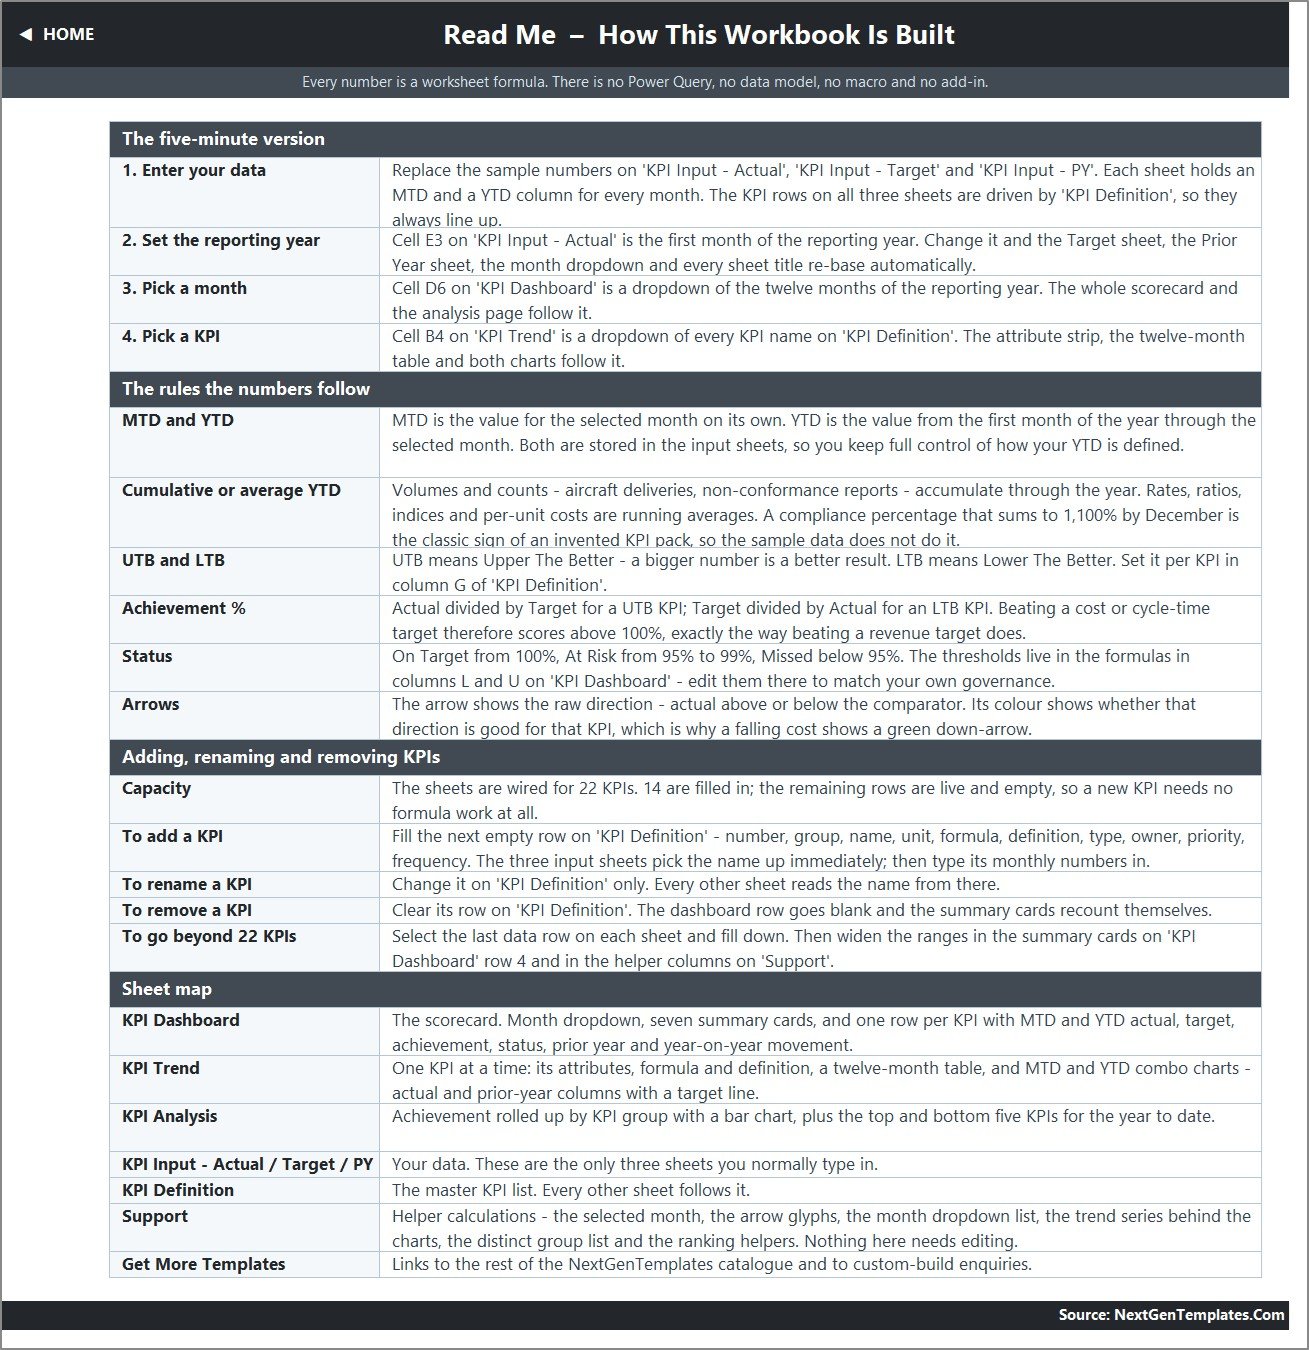
Page 9: Read Me
How the workbook is wired: the four-step setup, the MTD/YTD rules, the UTB/LTB convention, the achievement and status thresholds, and how to add, rename or remove a KPI.
The workbook also carries a Support helper sheet (nothing to edit) and a Get More Templates catalogue page. A tenth page image of that catalogue page exists but is a NextGenTemplates upsell listing rather than a feature of the template, so it is deliberately left out of the gallery above.
🔍 Honest Notes on This Build — What We Checked and What We Found
We recomputed every headline card, group roll-up, achievement percentage and Top/Bottom 5 ranking from the three input sheets. All of them reconcile exactly. The 7 On Target / 6 At Risk / 2 Missed counts add to 15; Avg Achievement MTD 97.8% and YTD 98.7% are the true averages of the fifteen achievement cells; the six group averages and both five-row ranking tables match the source rows to the last decimal. There is no wrong denominator, no Indian digit grouping on the USD metric, and no currency symbol applied to a count.
Four cosmetic issues did survive into the shipped file, and we would rather you heard them from us:
🔸 The Home and Read Me sheets both say “14 KPIs” while the file ships 15. The scorecard itself counts correctly — the Total KPIs Tracked card reads 15.
🔸 The Read Me’s “Cumulative or average YTD” note still carries an aerospace example (“aircraft deliveries, non-conformance reports”) left over from the master template. The rule it describes is correct; only the illustration belongs to another trade.
🔸 Joinery & Material Lead Time reads 100.0% YTD but is flagged At Risk. The true value is 99.95% and the achievement cell is formatted to one decimal, so it rounds up in the display while the status formula uses the unrounded number. The status is right; the printed percentage is a rounding artefact.
🔸 Count-unit KPIs print two decimals — Change Orders Approved shows 19.00 and Snagging Defects per Project shows 29.00. Widen the number format on the input sheets if whole numbers matter to you. Some long formula and owner strings on the KPI Definition and KPI Trend sheets are also clipped by their column width, and the three input-sheet screenshots above stop at August even though the workbook itself holds all twelve months.
None of these affect a single calculation. All of them are a two-minute fix in a file that is completely unlocked.
📊 Interior Fit-Out KPI Dashboard in Excel vs. a Google Sheets Equivalent vs. Paid Construction SaaS
| Feature | Interior Fit-Out KPI Dashboard in Excel | Google Sheets equivalent | Procore / Buildertrend / Fieldwire |
|---|---|---|---|
| Cost | $12.99 one-time | $8.99 one-time | $99-375 / user / month |
| Platform | Excel 2013+ and Excel for the web | Browser only | Web + vendor mobile app |
| Setup time | Under 10 minutes | Under 10 minutes | 2-8 weeks onboarding |
| Works offline | ✅ Yes | ❌ No | ❌ Partial |
| Real-time team collaboration | ❌ File-based | ✅ Yes | ✅ Yes |
| Mobile access | Excel mobile app | ✅ Browser | ✅ Native app |
| Customisable KPIs and formulas | ✅ Fully unlocked, 22-KPI capacity | ✅ Unlocked | ❌ Vendor-defined fields |
| Direction-aware (UTB/LTB) scoring | ✅ Built in | ✅ Built in | Varies by module |
| Year-1 cost at 5 users | $12.99 | $8.99 | $5,940-22,500 |
For a fit-out contractor who wants a monthly board pack without a five-figure construction-platform contract, the Interior Fit-Out KPI Dashboard in Excel sits in the sweet spot.
👥 Who This Template Is For — and Who It’s Not For
✅ Built for:
- Commercial interior fit-out and refurbishment contractors running 5-50 projects a year who already hold their numbers in spreadsheets
- Commercial managers, quantity surveyors and estimating leads who report margin, CPI and cost per square foot monthly
- Quality and HSE managers who track snagging, practical-completion pass rates and lost-time injuries and need one page for the board
- Joinery and specialist sub-trade businesses reporting lead times and package completion against programme
❌ Not for:
- Anyone needing a compliance, inspection, permit or handover record — this template is none of those things
- Teams wanting live site data, RFI workflow, drawing management or snag photos on a phone; use a real construction platform
- Anyone expecting estimating or bid-pricing output — the numbers here are reporting outputs, not quotations
- Multi-entity groups needing row-level permissions, SSO or an audit trail
⚙️ How to Use the Interior Fit-Out KPI Dashboard in Excel
- Open the workbook and go to KPI Definition. Rename, add or delete KPIs so the list matches the metrics your fit-out business actually reports.
- Set cell E3 on KPI Input – Actual to the first month of your reporting year. The Target sheet, Prior Year sheet, month dropdown and every sheet title re-base automatically.
- Replace the demo numbers on KPI Input – Actual, KPI Input – Target and KPI Input – PY, month by month, MTD and YTD.
- Pick a month in cell D6 on KPI Dashboard. The seven cards, all fifteen KPI rows and the whole KPI Analysis page follow it.
- Use the dropdown in cell B4 on KPI Trend to read any single KPI across twelve months with both combo charts.
- Adjust the On Target and At Risk thresholds in columns L and U on KPI Dashboard if your governance uses different bands.
💼 Real-World Use Cases
Daniel is commercial manager at a 40-person office fit-out contractor in Manchester. Each month he drops actual, target and last-year figures into the three input sheets and takes the June view to the directors’ meeting — CPI 0.98 YTD, gross margin 18.65% against an 18.46% target, cost per square foot running 4.2% over. He stopped rebuilding the same slide deck from scratch every month.
Priya runs quality and handover for a retail-interiors business. Snagging defects per project, practical-completion pass rate and rework cost ratio sit in one group on the scorecard, so she can see instantly that snagging is in the Bottom 5 on year-to-date achievement while rework cost is in the Top 5 — a pattern that told her the snags were being found, just late.
Tom is a director at a joinery subcontractor. He uses the KPI Trend page on Joinery & Material Lead Time alone, month by month against last year, when he negotiates with suppliers — one dropdown, one chart, no pivot tables.
❓ Frequently Asked Questions
Does this make our fit-out work compliant or our estimates accurate?
No. The Interior Fit-Out KPI Dashboard in Excel is a reporting template for numbers you type in. It creates no compliance with building codes, fire safety, accessibility or permitting rules, it is not an inspection or handover record, and it produces nothing you can rely on as an estimate, bid or contract. A licensed contractor’s statutory duties are unchanged.
Are the numbers in the file real fit-out benchmarks?
No. Every figure in the workbook is demo data generated for the sample — margins, snagging counts, cycle times, variations and satisfaction scores alike. Delete them and enter your own before anyone reads a single card as a fact about your business.
How many KPIs does it track?
Fifteen, across five groups, with live empty rows wired for up to 22. Note that the Home and Read Me sheets in this build both say “14” — that text is wrong; the KPI Definition sheet and the Total KPIs Tracked card both carry the correct 15.
How long does setup take?
Under ten minutes if your monthly numbers already exist. Set the reporting year in one cell, paste actual, target and prior-year values onto three sheets, and the scorecard, trend page and analysis page are finished — there is no refresh step and no query to run.
Do I need macros, Power Query or a Power BI licence?
None of them. The Interior Fit-Out KPI Dashboard in Excel is built entirely from worksheet formulas, so it opens in Excel 2013 and later and in Excel for the web, and no security prompt appears when you open it.
How does this compare to Procore or Buildertrend?
It does not replace them. Those platforms manage live site operations — RFIs, drawings, snag photos, subcontractor workflow. This template is a one-time $12.99 monthly reporting layer over numbers you already hold, for teams that do not want a $99-375 per-user monthly contract just to see KPI trends.
Is there a Google Sheets or scorecard version?
The Interior Fit-Out KPI Scorecard in Google Sheets is live now. An Excel edition of that scorecard is also being prepared as product 95041 and will be linked here once it is published.
👤 About the Author
Built by PK — Microsoft Certified Professional with 15+ years of Excel, Google Sheets and Power BI experience. Founder of NextGenTemplates, reaching 300K+ subscribers across YouTube channels (@PK-AnExcelExpert, @NextGenTemplates, @NeoTechNavigators). Every template is hand-built and tested before release.
🔗 Explore Related Templates
- Interior Design KPI Dashboard in Excel — the design-studio side of the same business: billable utilisation, concept approvals and project profitability.
- Carpentry Workshop KPI Dashboard in Excel — timber yield, offcut waste, CNC utilisation and on-time delivery for the joinery shop feeding your sites.
- Architecture KPI Dashboard in Excel — fee recovery, drawing issue and stage-completion KPIs for the practice on the other side of the table.
- Window and Door Installation KPI Dashboard in Google Sheets and Drywall Contractor KPI Dashboard in Google Sheets — adjacent trade packages, browser-based.
- Also available as: Interior Fit-Out KPI Scorecard in Google Sheets. A separate Interior Fit-Out KPI Scorecard in Excel (product 95041) is in preparation — it is a different, ten-KPI scorecard product, not a copy of this dashboard.
- Browse more KPI Dashboard templates and MS Excel templates.
🎥 Visit our YouTube channel for step-by-step video tutorials
👉 YouTube.com/@NextGenTemplates
📅 Last updated: September 2026