

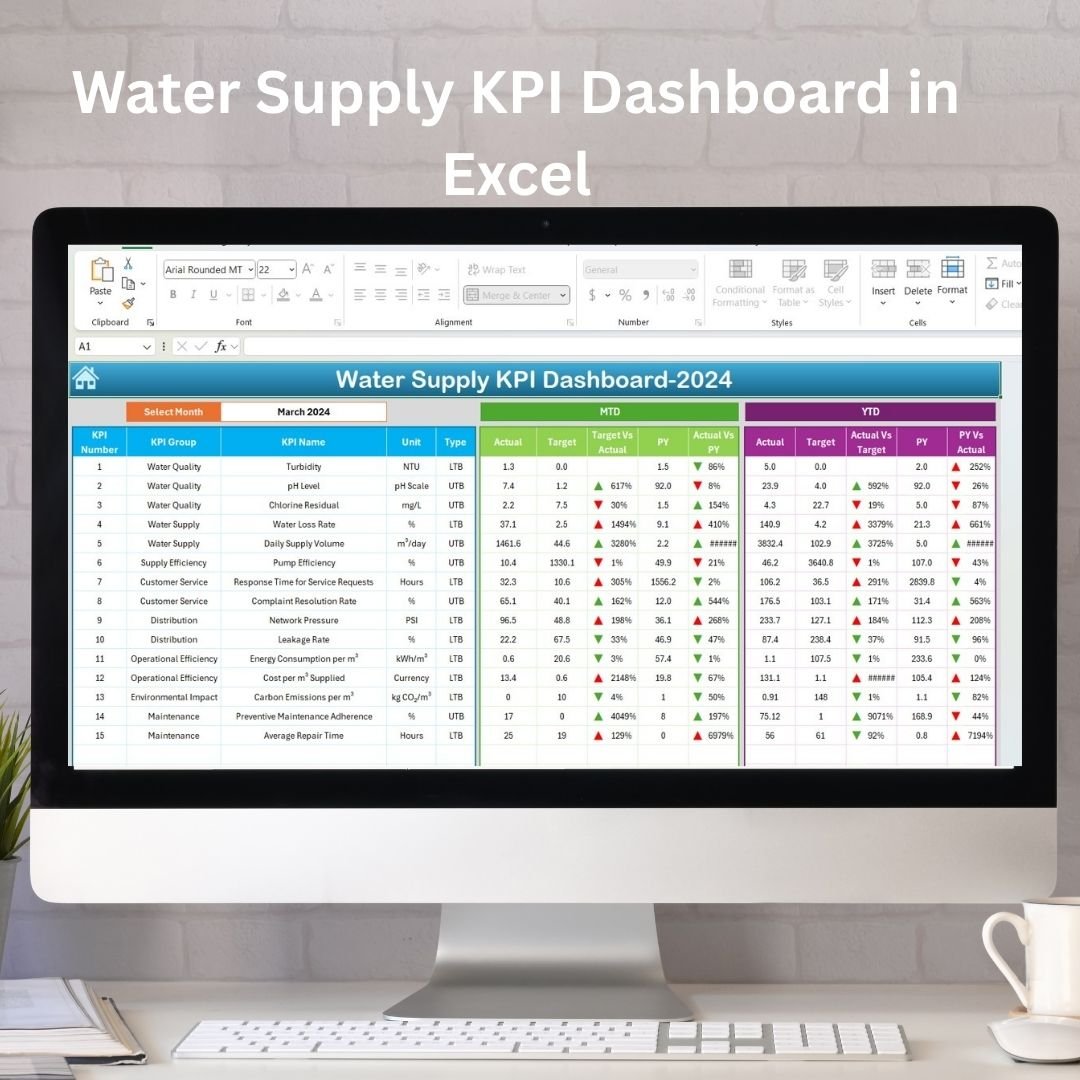

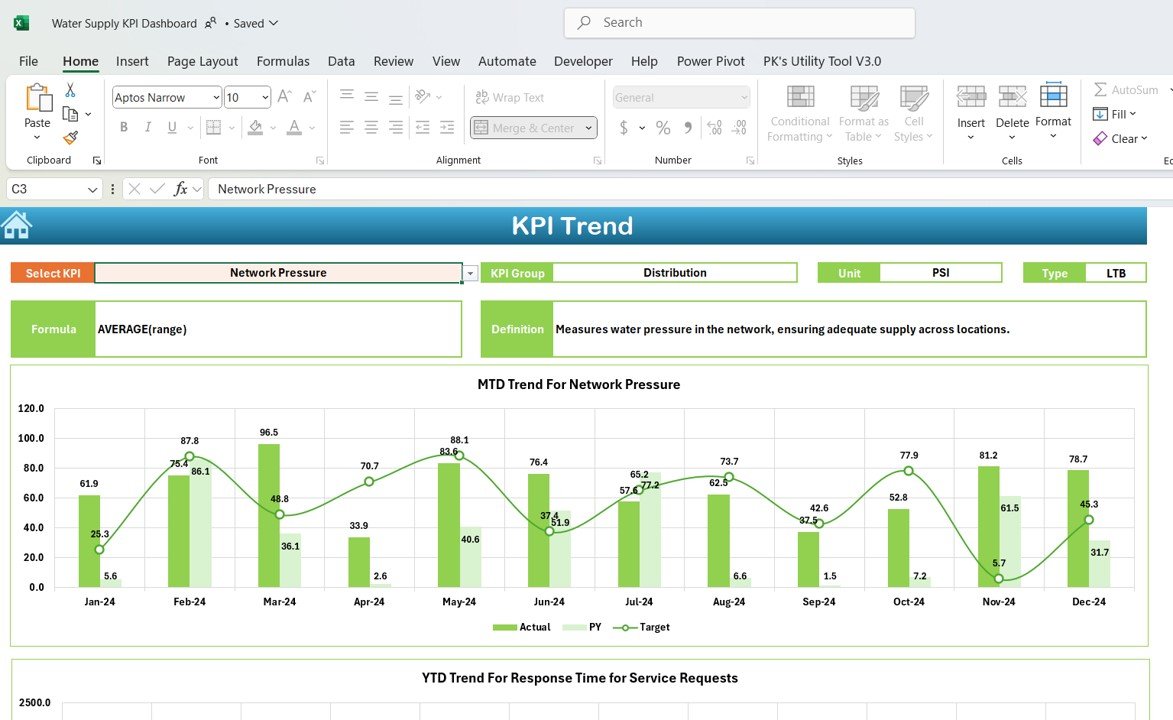
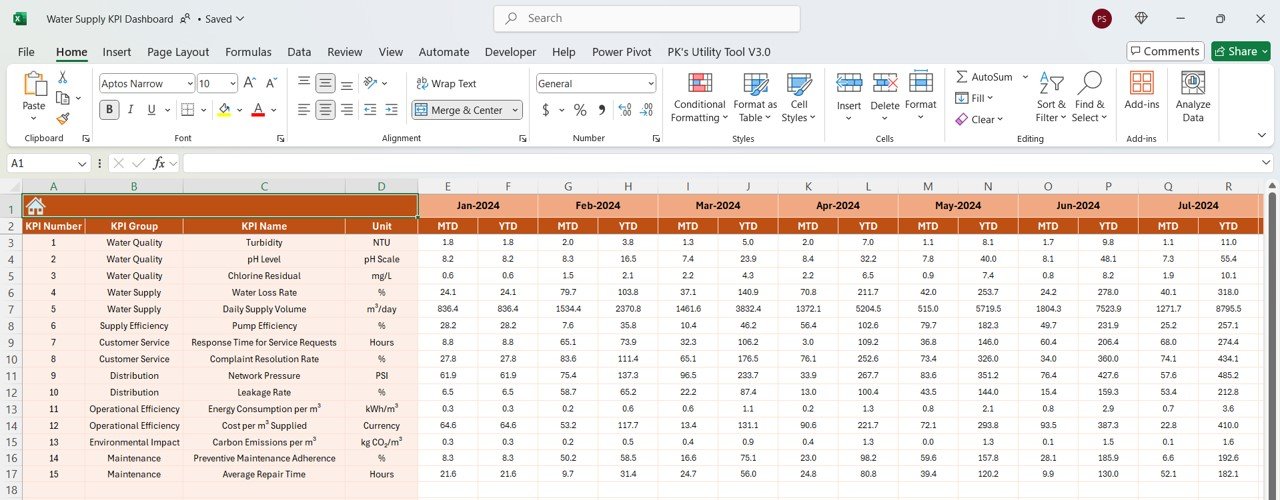

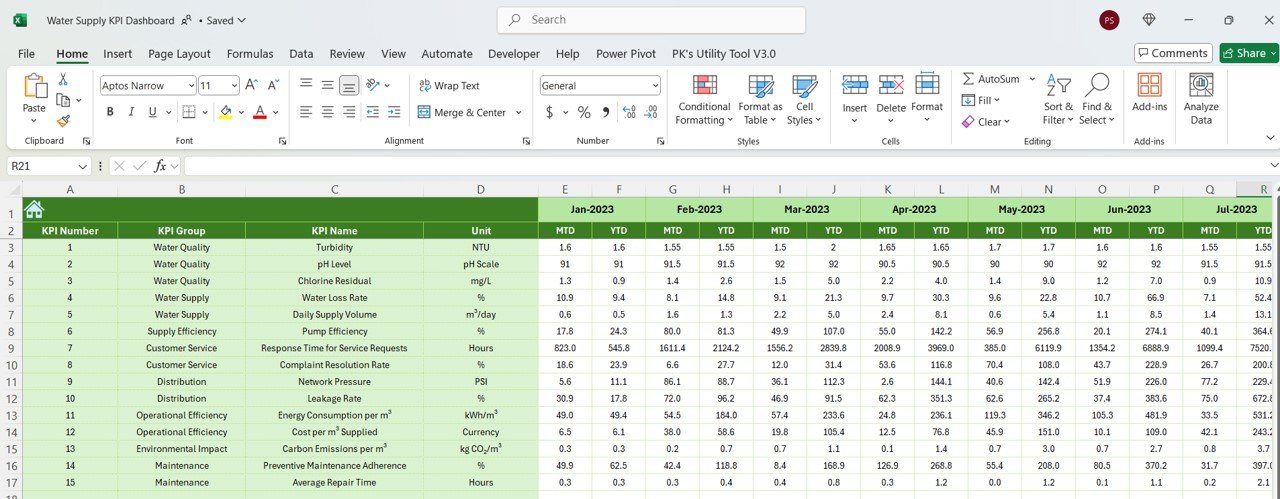
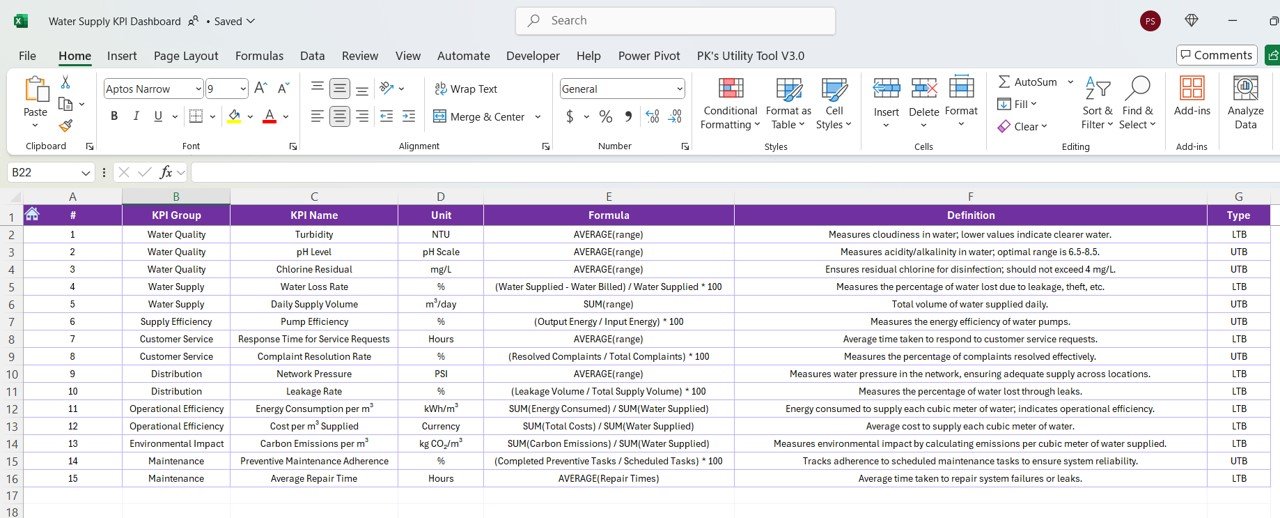

The Water Supply KPI Dashboard in Excel is a comprehensive tool designed for water utility companies, municipalities, and organizations to track and optimize key performance indicators (KPIs) in their water distribution operations. Whether you’re managing water consumption, supply efficiency, system reliability, or customer service, this dashboard provides an easy-to-use solution to monitor and improve performance.
With real-time tracking, dynamic charts, and customizable features, this Excel dashboard helps water supply operators, managers, and business owners monitor critical aspects of water distribution, such as water flow rates, leakage rates, service interruptions, and customer satisfaction. It empowers you to make data-driven decisions to enhance service delivery and reduce operational costs.
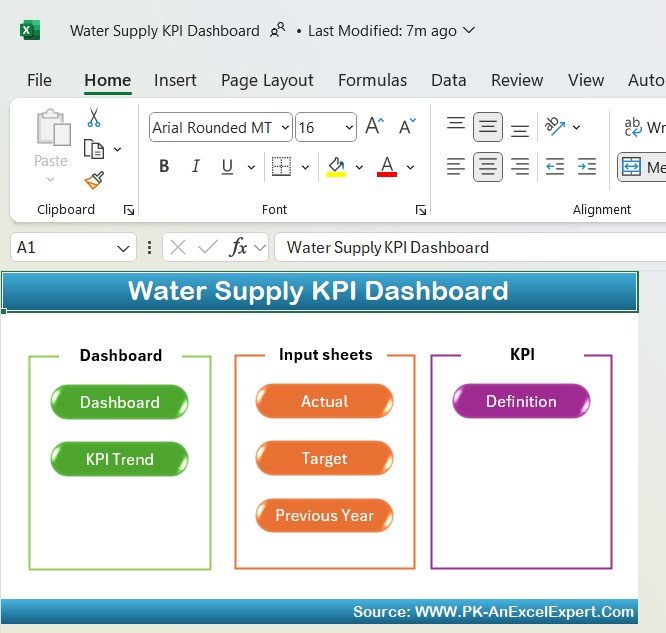
Key Features of the Water Supply KPI Dashboard in Excel:
📊 Comprehensive KPI Tracking
Track essential water supply KPIs such as water consumption, supply efficiency, leakage rates, service interruptions, and customer satisfaction—all in one dashboard.
📈 Real-Time Performance Monitoring
Monitor water distribution performance in real-time, ensuring that you can address issues such as leaks, supply shortages, or customer complaints promptly.
📅 Month-to-Date (MTD) and Year-to-Date (YTD) Tracking
Compare performance over different periods, allowing you to identify seasonal trends, long-term improvements, or potential issues.
🎯 Goal Setting and Performance Comparison
Set specific targets for each KPI and compare actual performance against these goals to ensure efficient and reliable water supply operations.
🛠 Customizable Inputs
Easily input data such as water flow, consumption, leakage, service interruptions, and customer feedback, while customizing the dashboard to suit your water supply operation needs.
🔔 Conditional Formatting Alerts
Get real-time alerts using color-coded indicators to highlight underperforming areas, such as high leakage rates, low service levels, or missed targets.
💧 Water Supply Insights
Gain insights into water flow rates, leakage patterns, and customer feedback to optimize your water distribution strategies and reduce waste.
🚀 Why You’ll Love the Water Supply KPI Dashboard in Excel:
✅ Optimize Water Distribution – Track water consumption, flow rates, and leakage to ensure that supply is consistent and efficient across all areas.
✅ Reduce Operational Costs – Monitor leakage rates and repair times to minimize losses and reduce repair expenses.
✅ Enhance Service Delivery – Track service interruptions, customer complaints, and satisfaction to improve customer experience and reduce downtime.
✅ Improve Sustainability – Measure water conservation efforts by tracking consumption trends and identifying areas to reduce waste.
✅ User-Friendly Interface – Designed for ease of use, even for non-technical staff, making it easy to input data and analyze performance.
✅ Fully Customizable – Tailor the dashboard to suit your water supply company’s needs, whether you’re focusing on city-wide distribution or specific service areas.
What’s Inside the Water Supply KPI Dashboard in Excel:
- Water Consumption KPI: Track the total volume of water consumed across various sectors and service areas.
- Leakage Rate KPI: Monitor the percentage of water lost due to leaks in the distribution system, helping you optimize maintenance and repair efforts.
- Service Interruptions KPI: Track the frequency and duration of service interruptions, ensuring timely response and minimizing downtime.
- Water Flow Rate KPI: Measure the flow rates across different points in the supply network to ensure consistent distribution.
- Customer Satisfaction KPI: Monitor customer feedback and satisfaction scores to ensure high service quality.
- Water Supply Efficiency KPI: Track overall water supply efficiency, comparing actual water supplied to the amount of water needed by customers.
- Maintenance Cost KPI: Monitor the cost of system maintenance, including repairs, upgrades, and labor, to optimize spending.
How to Use the Water Supply KPI Dashboard in Excel:
1️⃣ Download the Template – Instantly access your Excel file upon purchase.
2️⃣ Input Your Data – Enter data such as water flow, consumption, leakage rates, service interruptions, and customer feedback into the provided fields.
3️⃣ Set Targets – Define KPIs for water supply efficiency, leakage rates, and customer satisfaction to guide your operational goals.
4️⃣ Monitor Performance – Track your performance in real-time and make adjustments to ensure that your water supply system runs smoothly and efficiently.
5️⃣ Generate Reports – Use the dashboard to generate detailed performance reports for internal reviews, management meetings, or regulatory compliance.
Who Can Benefit from the Water Supply KPI Dashboard in Excel:
- Water Utility Companies
- Municipal Water Supply Managers
- Environmental Consultants
- Operations Managers
- Customer Service Teams
- Water Distribution Teams
- Business Owners in Water Management
- Regulatory Affairs Teams
The Water Supply KPI Dashboard in Excel is the perfect solution for organizations in the water supply industry looking to track performance, optimize resources, and enhance customer service.
Click here to read the Detailed blog post
https://www.pk-anexcelexpert.com/water-supply-kpi-dashboard-in-excel/
Visit our YouTube channel to learn step-by-step video tutorials
Youtube.com/@PKAnExcelExpert





























Reviews
There are no reviews yet.