

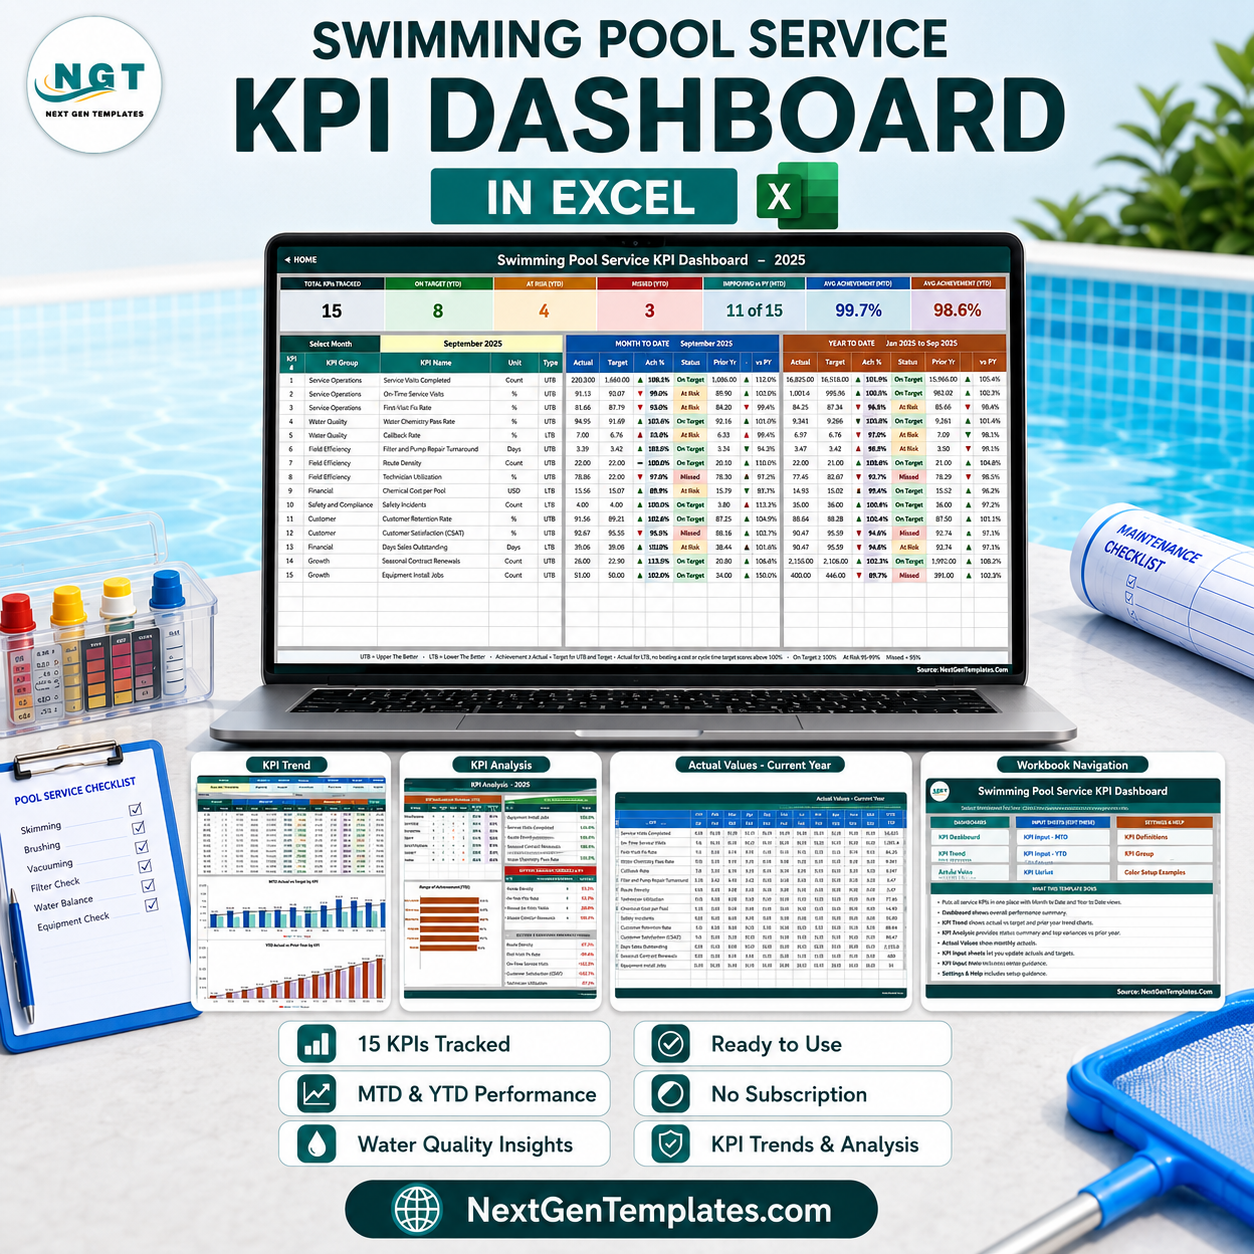
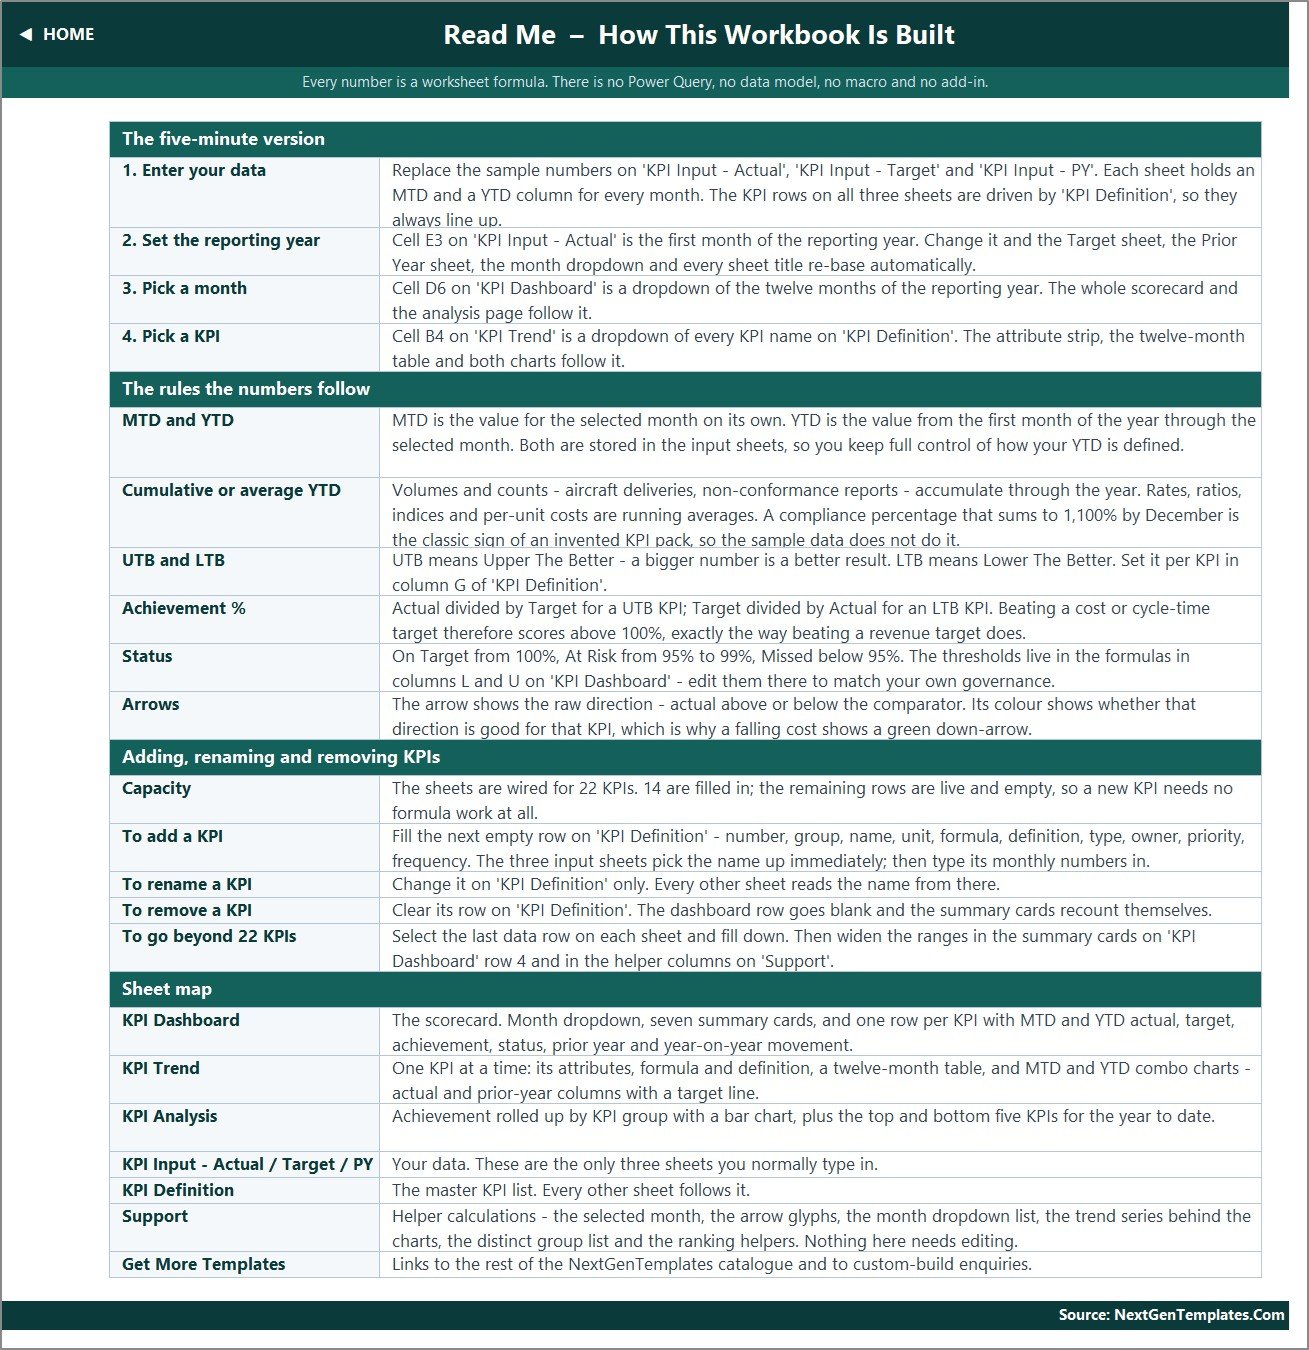
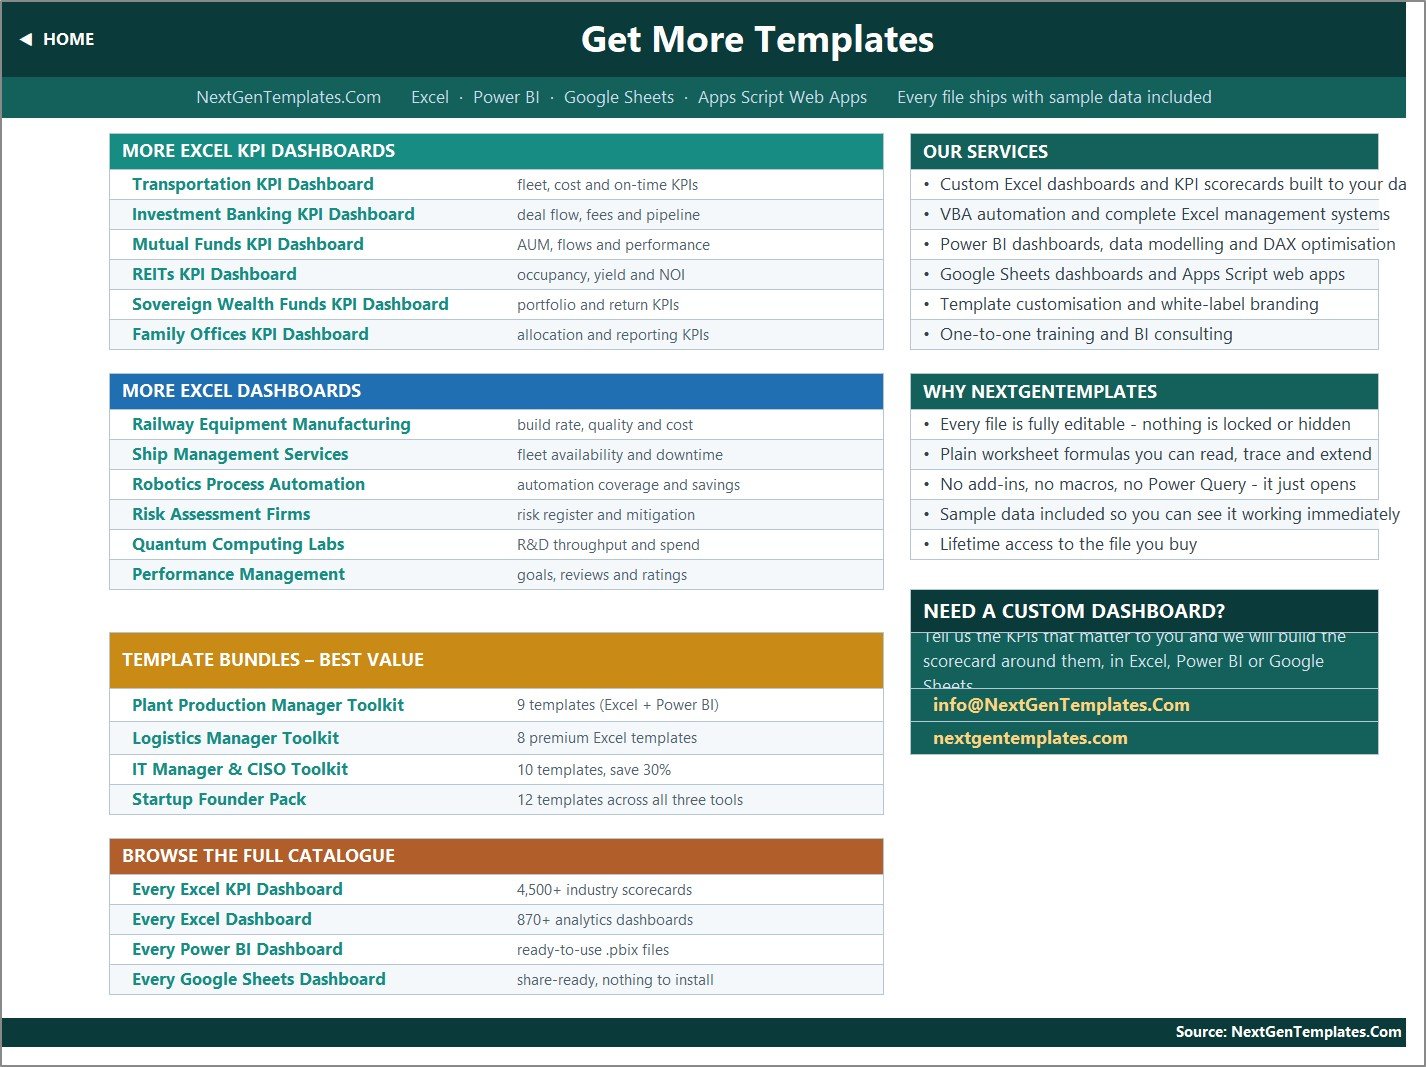

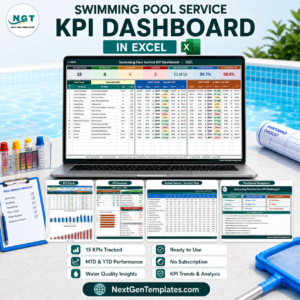
The Swimming Pool Service KPI Dashboard in Excel puts 15 pool-service KPIs across 7 groups onto one month-picker scorecard: route stops, water chemistry, callbacks, technician utilization, chemical cost, safety, retention and seasonal renewals, each with MTD and YTD actual, target, achievement, status and prior-year movement. It is 1,284 worksheet formulas across 11 sheets – no macros, no Power Query, no data model, no add-ins. Built by NextGenTemplates, whose YouTube channels reach 300K+ subscribers. Instant download, lifetime access to the file you buy, and nothing is locked, hidden or password protected: every formula is readable and editable.
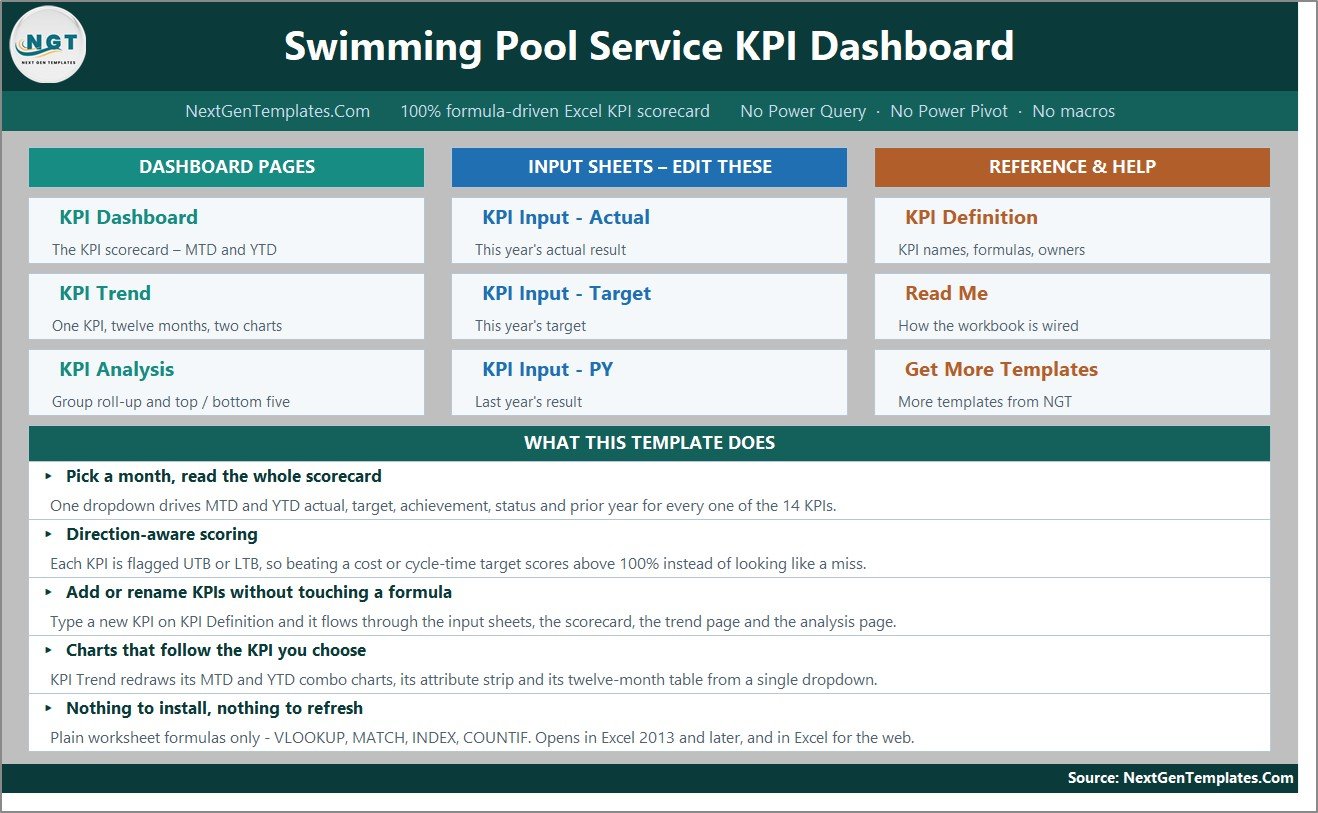
This listing is the KPI Dashboard edition – the 15-KPI, 11-sheet scorecard with a KPI Trend page and a KPI Analysis page. It is not the smaller 10-KPI Swimming Pool Service KPI Scorecard, and it is not one of the pivot-and-slicer analytical dashboards. All three families exist for pool and field-service topics; see the FAQ below for which one to buy.
Key Features of the Swimming Pool Service KPI Dashboard in Excel
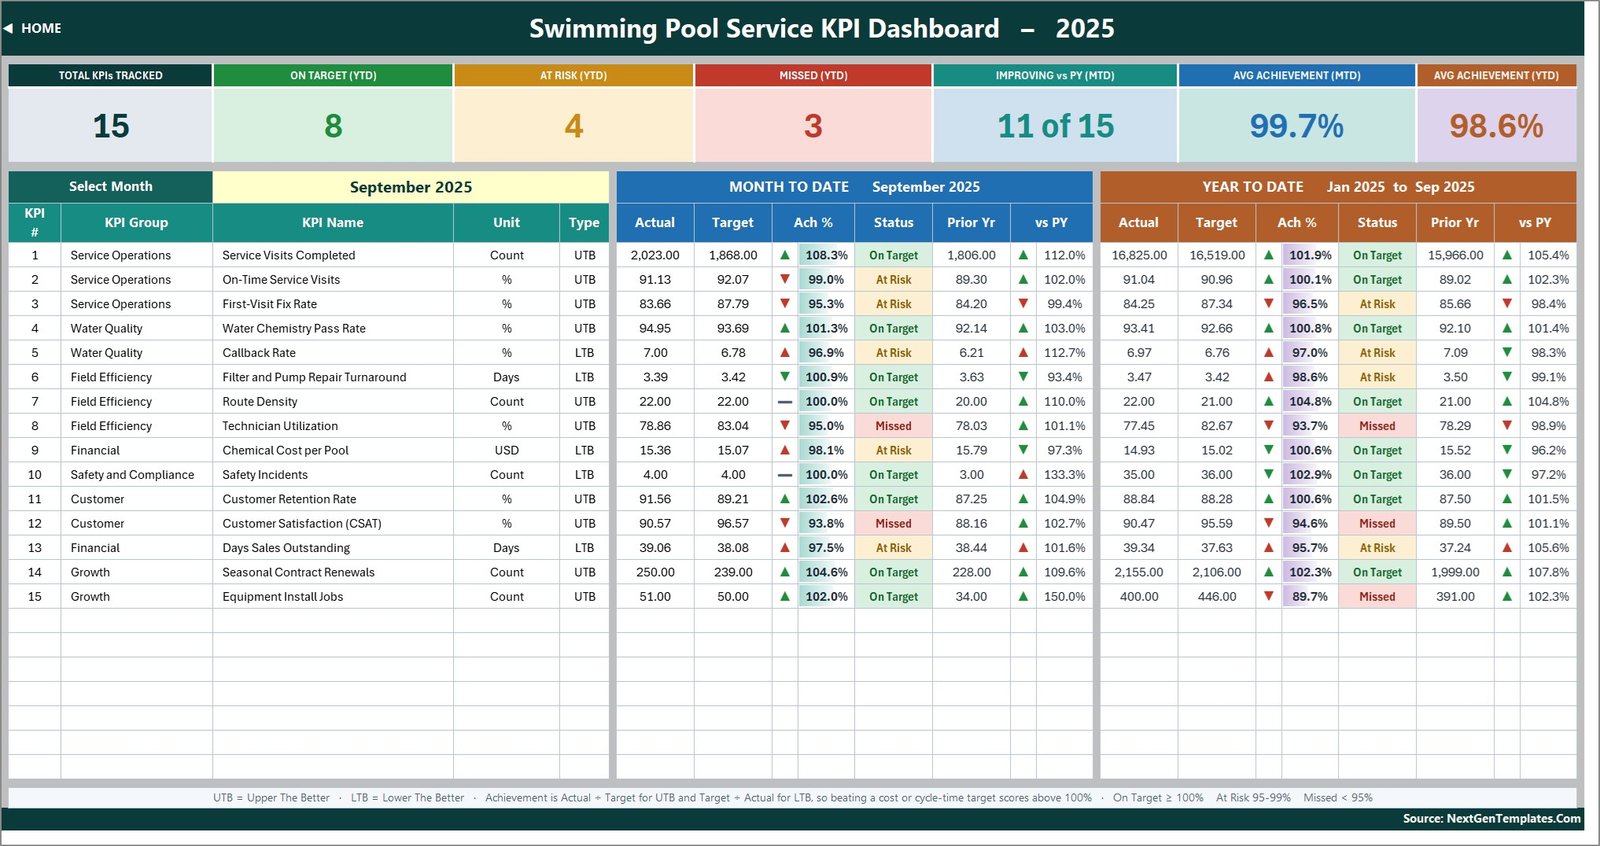
- One dropdown drives everything. Cell D6 on KPI Dashboard picks the reporting month. All 15 rows, both MTD and YTD blocks, the seven summary cards and the whole KPI Analysis page recalculate from it.
- Direction-aware scoring. 10 KPIs are UTB (upper the better) and 5 are LTB (lower the better). Achievement is Actual divided by Target for UTB and Target divided by Actual for LTB, so beating a cost or turnaround target scores above 100% instead of reading as a miss.
- Traffic lights with editable bands. On Target from 100%, At Risk 95-99%, Missed below 95%. The thresholds sit inside the formulas in columns L and U on KPI Dashboard – change them there and the counts, colours and analysis page follow.
- Prior-year comparison built in. Every KPI carries a prior-year column with an arrow whose colour reflects the KPI’s own direction, so a falling chemical cost shows a green down-arrow.
- Room for 22 KPIs. The sheets are wired to row 25 on KPI Definition. Type a new KPI there and it appears on the three input sheets, the scorecard, the trend dropdown and the group roll-up with no formula work.
- Re-bases to your year. Cell E3 on KPI Input – Actual is the first month of the reporting year; change it and the target sheet, the prior-year sheet, the month dropdown and every sheet title move with it.
- Opens anywhere. Plain VLOOKUP, MATCH, INDEX, COUNTIF and SUMPRODUCT in an .xlsx. Excel 2013 and later, Microsoft 365, and Excel for the web.
What’s Inside the Swimming Pool Service KPI Dashboard in Excel
KPI Dashboard – the scorecard. Seven summary cards (Total KPIs Tracked, On Target, At Risk, Missed, Improving vs PY, Avg Achievement MTD, Avg Achievement YTD) sit above one row per KPI with MTD and YTD actual, target, achievement, status, prior year and year-on-year movement. In the shipped September 2025 sample that reads 15 KPIs, 8 On Target, 4 At Risk, 3 Missed, 11 of 15 improving, 99.7% average MTD achievement and 98.6% YTD.
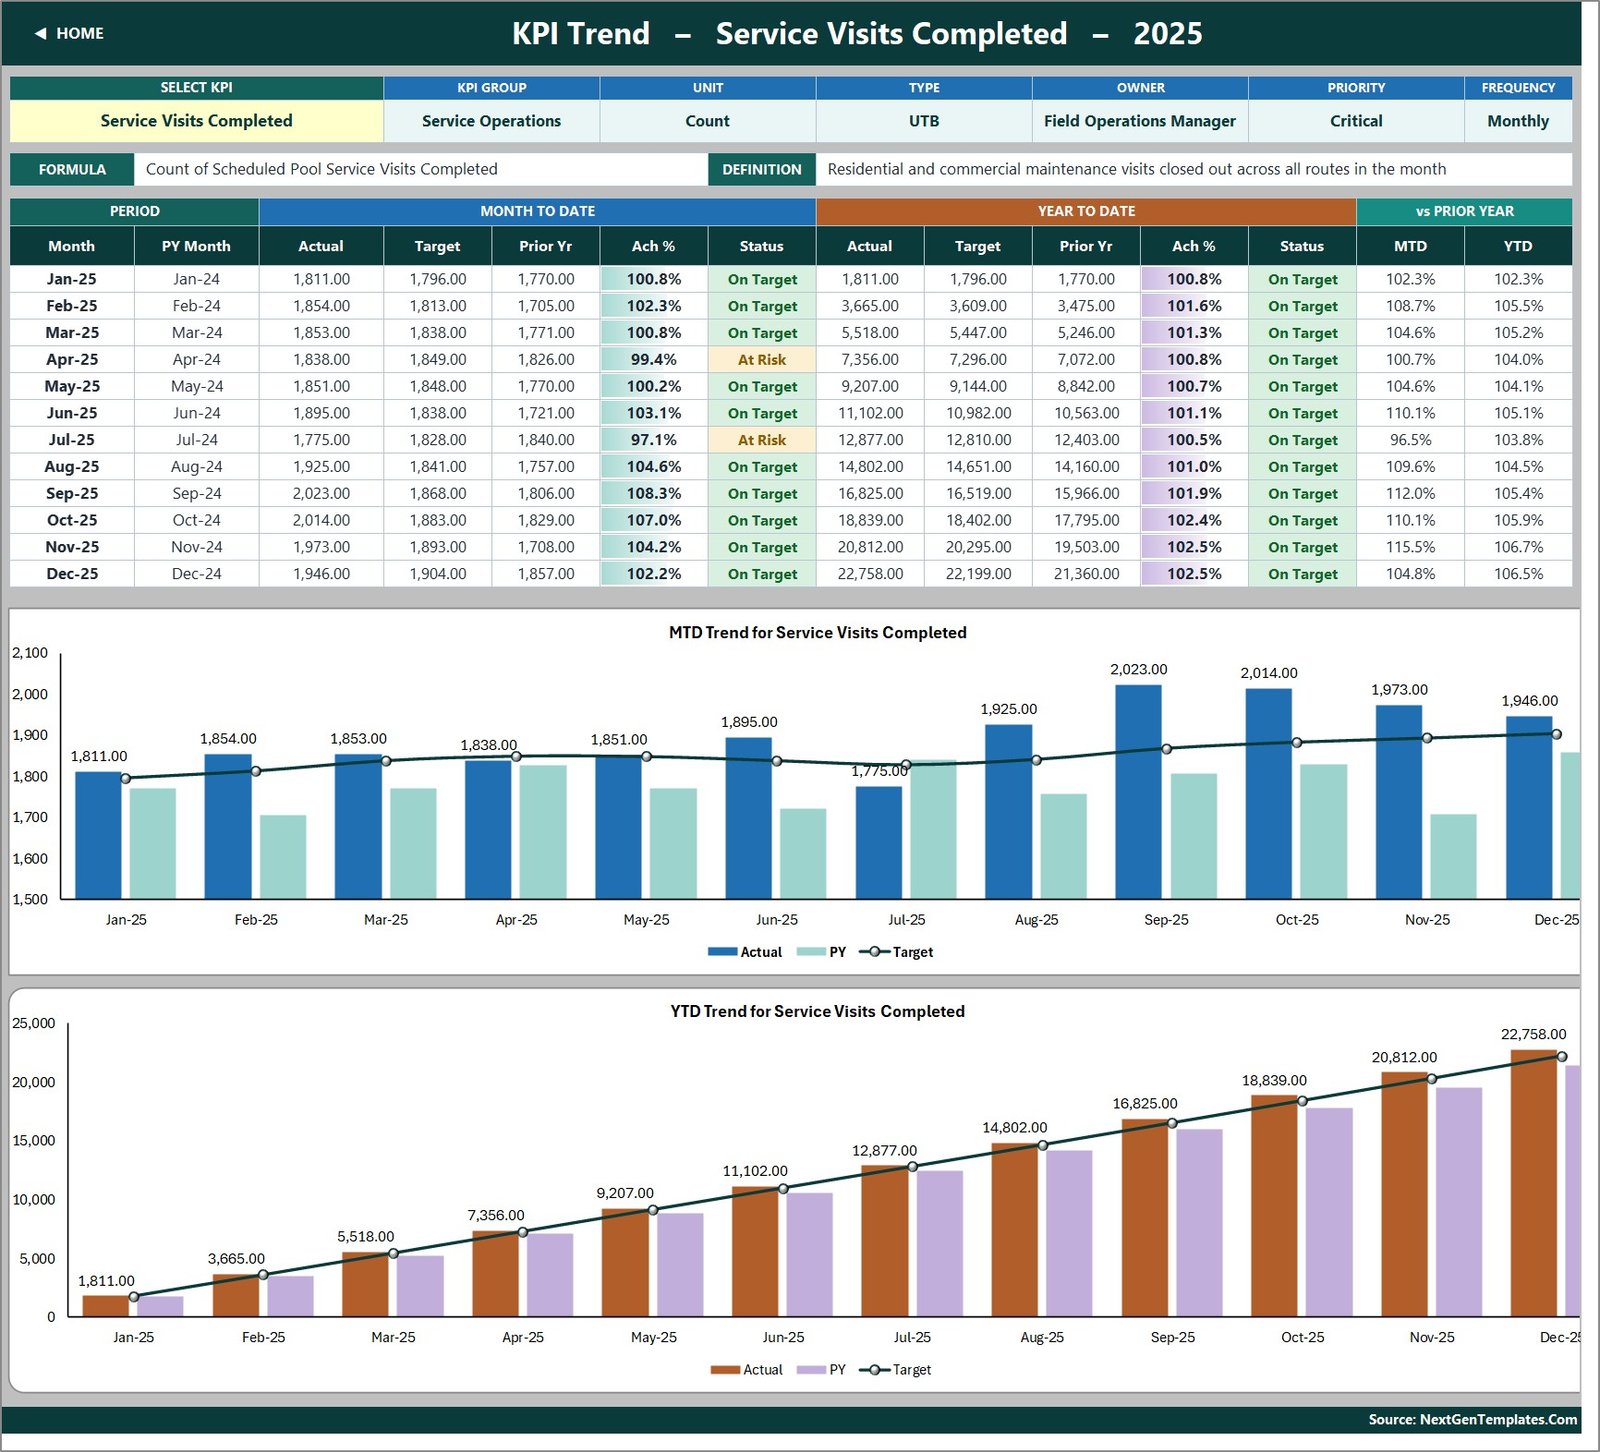
KPI Trend – pick any KPI from the dropdown in B4. Its group, unit, type, owner, priority, frequency, formula and definition fill the attribute strip, a twelve-month table shows MTD and YTD actual, target and prior year, and two combo charts redraw: MTD Trend and YTD Trend, each with actual and prior-year columns against a target line.
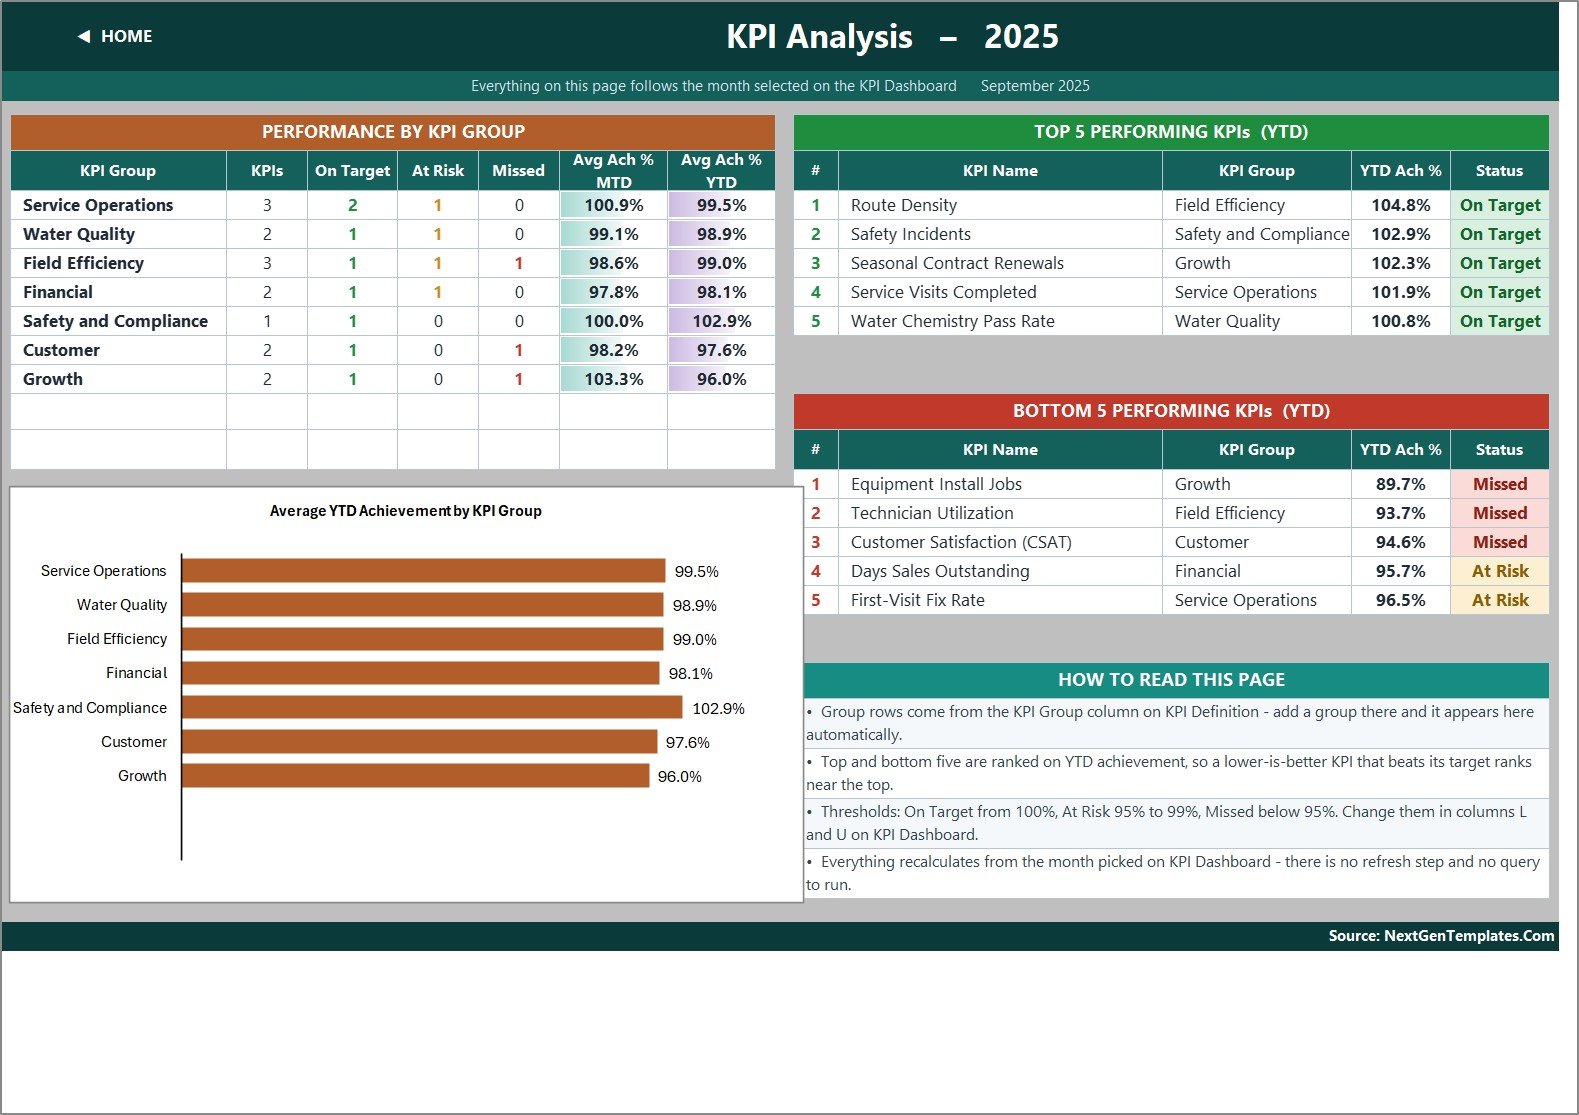
KPI Analysis – achievement rolled up by KPI group with the count of On Target, At Risk and Missed in each, a bar chart of Average YTD Achievement by KPI Group, and the Top 5 and Bottom 5 KPIs ranked on year-to-date achievement.
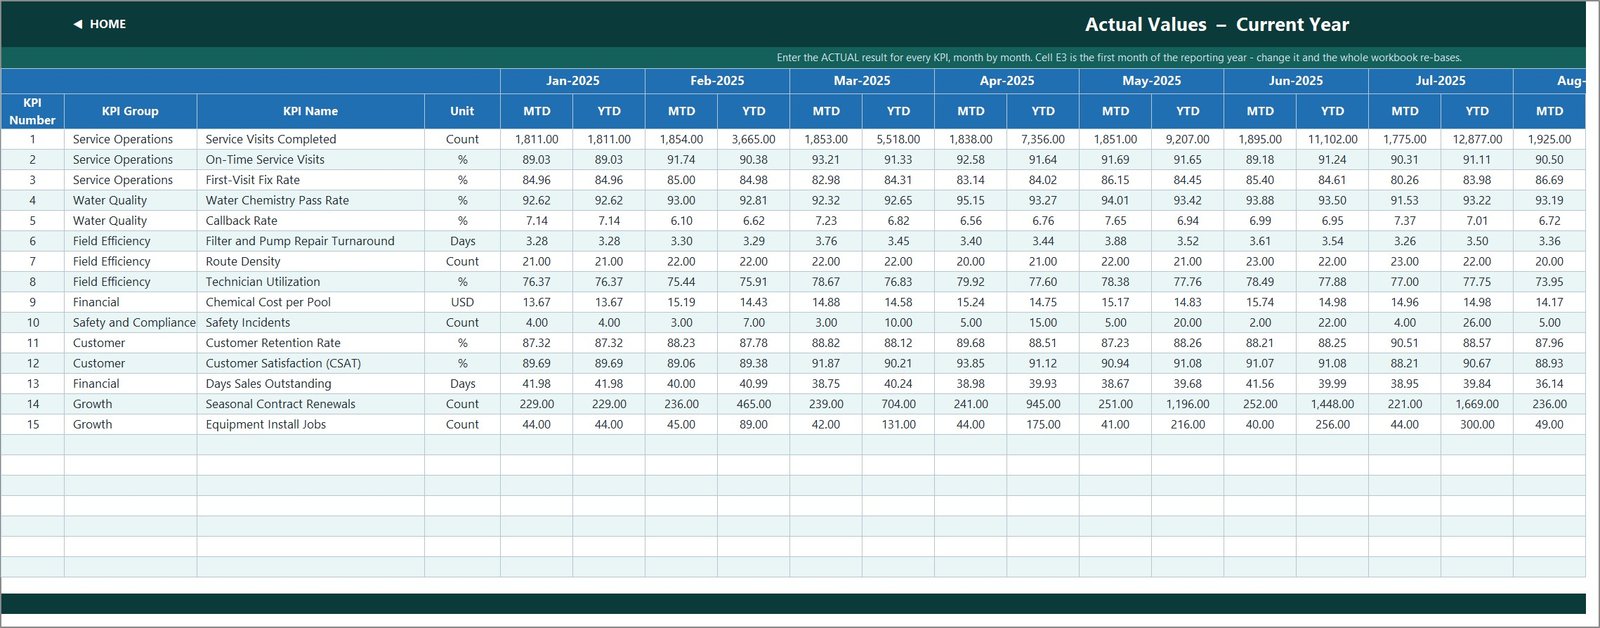
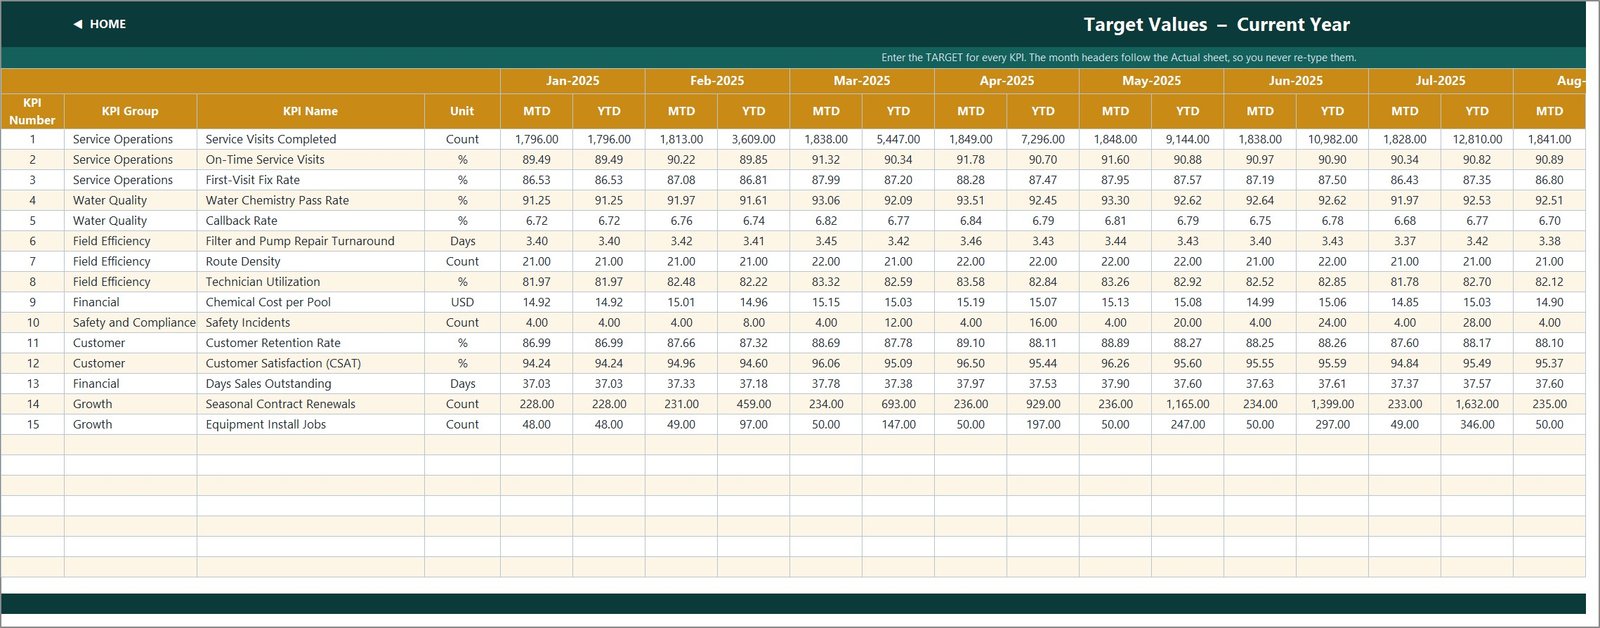
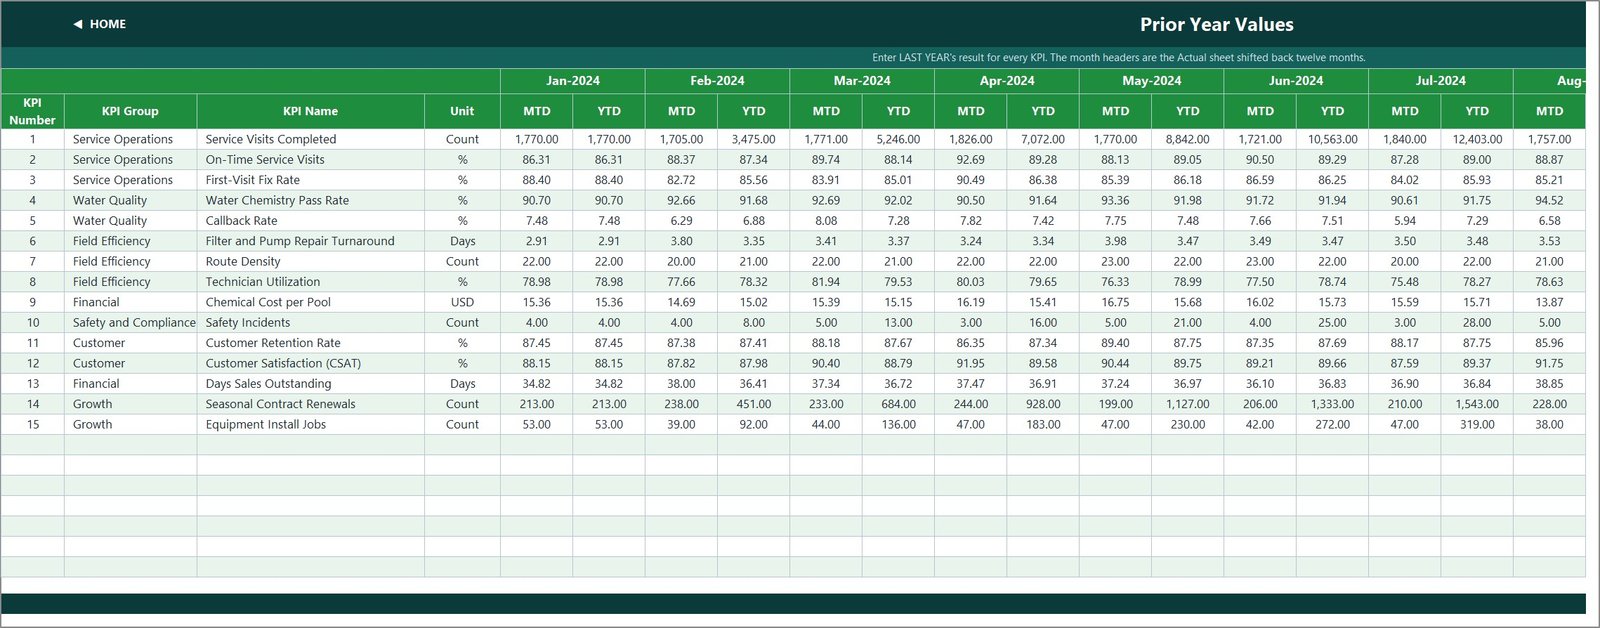
KPI Input – Actual, Target and PY – the only three sheets you normally type into, each with an MTD and a YTD column for all twelve months. The KPI names on all three come from KPI Definition, so the rows can never drift apart.
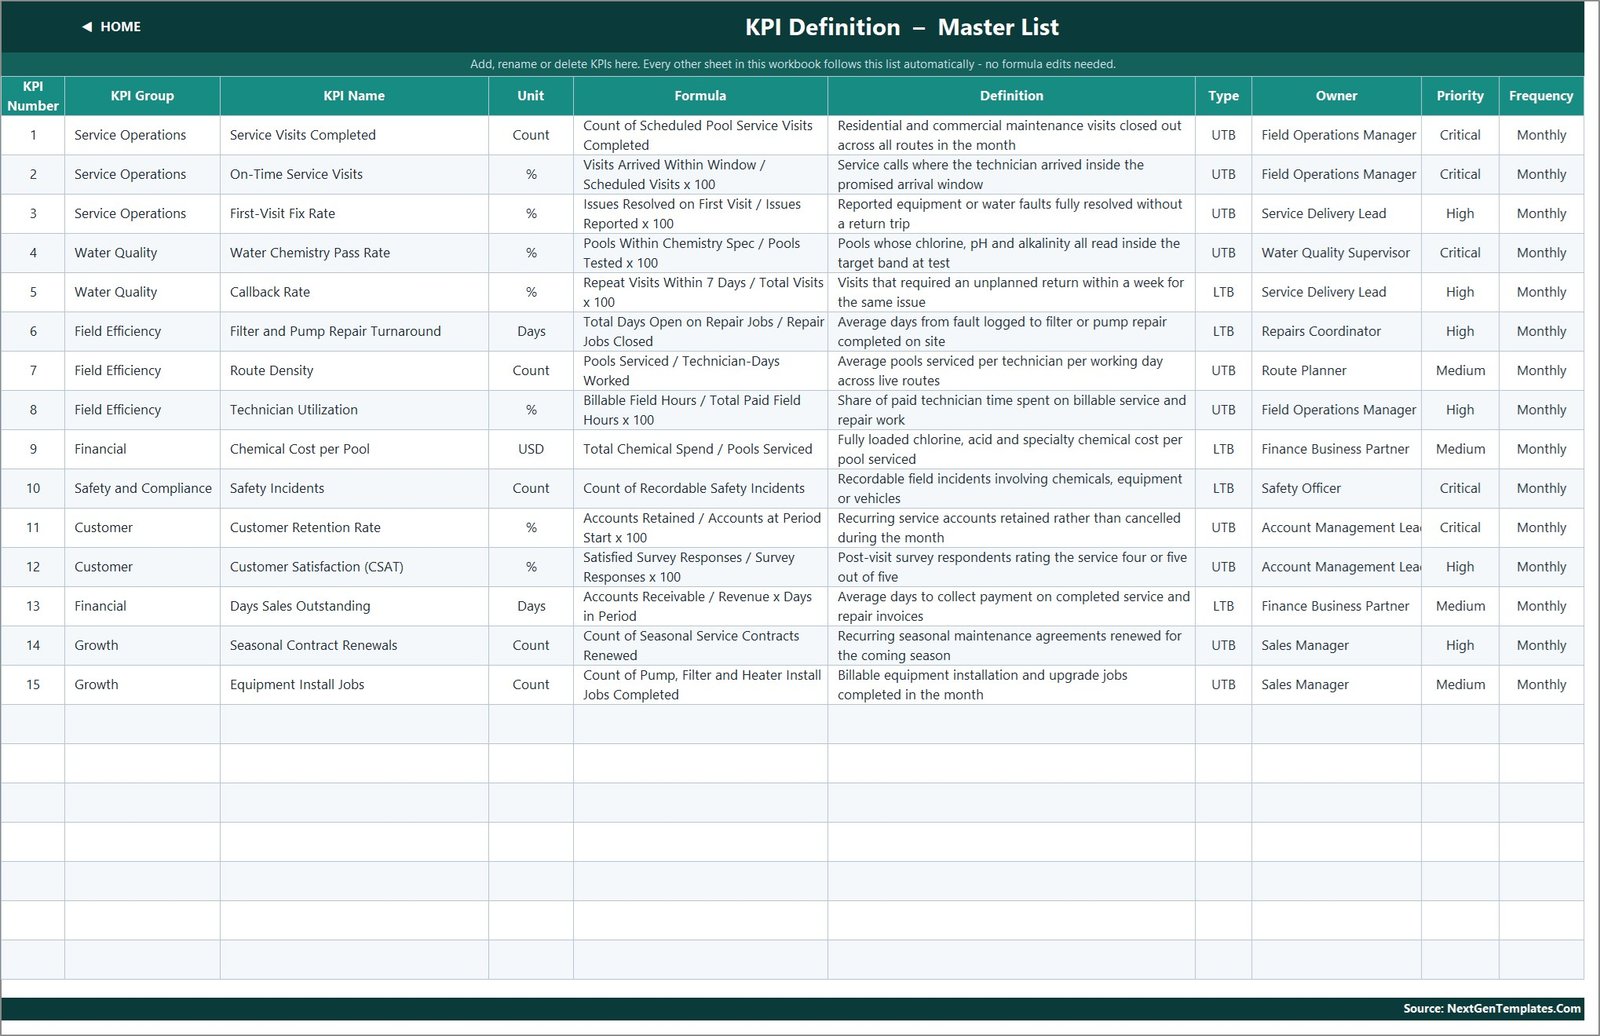
KPI Definition – the master list: number, group, name, unit, formula, definition, UTB/LTB type, owner, priority and frequency for each of the 15 KPIs. Read Me documents how the workbook is wired, and Get More Templates links to the wider catalogue. A hidden Support sheet holds the helper calculations.
Excel Version vs. Google Sheets vs. Paid Pool-Service SaaS – Where This Fits
| This Excel KPI Dashboard | Google Sheets KPI scorecard | Pool/field-service SaaS (Skimmer, Jobber, ServiceTitan) | |
|---|---|---|---|
| Cost | One-time purchase | One-time purchase | Subscription, usually per technician per month |
| Platform | Excel 2013+, Microsoft 365, Excel for the web | Browser, Google account | Vendor web app plus a technician mobile app |
| Setup time | Minutes – replace the sample numbers | Minutes – make a copy | Days to weeks of onboarding and data import |
| Real-time team collaboration | Via OneDrive or SharePoint co-authoring | Native, multi-user | Native, role-based |
| Mobile access | Excel mobile app, read-friendly | Sheets mobile app | Purpose-built technician app |
| Customizable fields | Every cell and formula is open | Every cell is open | Only what the vendor exposes |
| Share with a link | Through OneDrive/SharePoint | Yes, native | Yes, inside the platform |
| Year-1 cost at 5 users | The purchase price, once | The purchase price, once | Recurring per-seat fees for all 12 months |
| Direction-aware KPI scoring (UTB/LTB) | Yes, per KPI on KPI Definition | Yes | Varies by product |
| Prior-year comparison on every KPI | Yes, MTD and YTD | Yes | Usually an add-on report |
| Route scheduling, dispatch and invoicing | No – this is a reporting layer | No | Yes, that is what they are for |
Who This Template Is For – and Who It’s Not For
It is for owner-operators and service managers at residential and commercial pool companies running 2 to 40 technicians who already collect their numbers – in a field-service app, an accounting package or a spreadsheet – and need one page that says whether the month was good. It suits a monthly management review, a weekly leadership huddle, or a franchise reporting a consistent scorecard back to head office.
It is not for anyone who wants the workbook to schedule routes, dispatch technicians, hold customer or pool records, log chemical inventory, or raise invoices – it does none of those, and it does not connect to any field-service platform. It also will not calculate KPIs from raw job tickets: you type the monthly MTD and YTD result for each KPI and the workbook does the scoring, comparison and ranking. If you need automatic aggregation from transaction rows, an analytical dashboard with pivots and slicers is the better fit.
How to Use the Swimming Pool Service KPI Dashboard in Excel
- Unzip the download and open the .xlsx in Excel. The Excel KPI Dashboard User Manual PDF is in the same ZIP.
- Open KPI Definition and edit the 15 supplied KPIs, or add your own down to row 25. Set each one’s unit and UTB/LTB type – the type is what makes the scoring correct.
- Set cell E3 on KPI Input – Actual to the first month of your reporting year. Every other sheet re-bases to it.
- Replace the sample numbers on KPI Input – Actual, KPI Input – Target and KPI Input – PY, filling both the MTD and the YTD column for each month.
- Go to KPI Dashboard, pick your month in D6, and read the scorecard. Use KPI Trend for one KPI over twelve months and KPI Analysis for the group roll-up and the top and bottom five.
Real-World Use Cases
Marisol, owner of a 12-route residential pool company. She reviews the scorecard on the first Monday of the month. Callback Rate and Water Chemistry Pass Rate sit next to Route Density and Technician Utilization, so a route she has been pushing for productivity shows immediately whether the extra stops cost her chemistry quality.
Devin, service manager for a commercial aquatics contractor. He uses KPI Trend on Filter and Pump Repair Turnaround before quarterly supplier reviews – twelve months of actual against target and prior year on one chart is the whole conversation.
Priya, franchise operations lead across nine territories. Each territory keeps its own copy with identical KPI Definition rows, so the Top 5 and Bottom 5 lists on KPI Analysis are directly comparable between them.
Frequently Asked Questions
Is this the KPI Dashboard, the KPI Scorecard, or the analytical dashboard?
This is the KPI Dashboard: 15 KPIs, 11 sheets, a month picker, a KPI Trend page and a KPI Analysis page. The Swimming Pool Service KPI Scorecard is a separate, smaller build – 10 KPIs in 5 groups – and the analytical dashboards are pivot-and-slicer files that aggregate raw transaction rows. Different templates, not different names for the same file.
Is the Power BI edition the same file?
No. The Swimming Pool Service KPI Dashboard in Power BI was built separately and tracks 12 KPIs across 9 groups over 4 report pages. Only two KPI names are common to both – Chemical Cost per Pool and Days Sales Outstanding. The Power BI edition adds revenue and margin KPIs (Revenue per Pool per Month, Service Gross Margin %, Repair & Install Revenue Mix %) that this Excel file does not carry, while this Excel file carries customer and growth KPIs (CSAT, Customer Retention Rate, Seasonal Contract Renewals, Equipment Install Jobs, On-Time Service Visits, First-Visit Fix Rate, Water Chemistry Pass Rate) that the Power BI edition does not. Buy the one whose KPI list matches how you actually report.
Do I need macros, Power Query or a Power BI licence?
None of them. It is an .xlsx driven entirely by worksheet formulas. There is nothing to enable, install or refresh.
Can I add my own KPIs?
Yes – up to 22 without touching a formula. Fill the next empty row on KPI Definition and the three input sheets, the scorecard, the trend dropdown and the group roll-up pick it up. Read Me explains how to go beyond 22.
Does it calculate YTD from my monthly numbers?
No, and that is deliberate. Each input sheet has an MTD and a YTD column per month, so you keep control of how year-to-date is defined – a running average for rates and ratios, a cumulative total for counts. You maintain both columns.
Will it change my technicians’ schedules or send invoices?
No. It is a reporting layer. Scheduling, dispatch, route optimisation, customer records and invoicing stay wherever you do them today.
Can I rebrand it for client reporting?
Yes. Nothing is locked or protected – colours, headers, logos, KPI names and thresholds are all editable.
About the Author
Built by PK – Microsoft Certified Professional with 15+ years of Excel, Google Sheets, and Power BI experience. Founder of NextGenTemplates, reaching 300K+ subscribers across YouTube channels. Every template is hand-built and tested before release.
Explore Related Templates
- Insulation Contractor KPI Dashboard in Excel – the same scorecard engine for an insulation trade
- Plumbing Business KPI Dashboard in Excel – closest field-service neighbour by KPI shape
- Masonry Contractor KPI Dashboard in Excel
- Swimming Pool Service KPI Scorecard in Google Sheets – the 10-KPI scorecard on the same topic
- Landscaping Dashboard in Excel – the pivot-and-slicer analytical style, for comparison
- Browse every Excel KPI Dashboard or the full MS Excel catalogue
Download it, replace three sheets of numbers, and your next monthly review runs off one page. Instant download, lifetime access to the file, and a user manual in the ZIP.
Watch the step-by-step video Demo:
Last updated: 2 September 2026.
Compatibility and Requirements
- Works in Microsoft Excel desktop (Excel 2013 or later, or Microsoft 365) and in Excel for the web. It is an .xlsx file with worksheet formulas only, so there are no macros, Power Query refreshes or add-ins to enable.
- You pick the reporting month from a dropdown in cell D6 on the KPI Dashboard sheet. Microsoft explains dropdown lists in Create a drop-down list.

































Reviews
There are no reviews yet.