

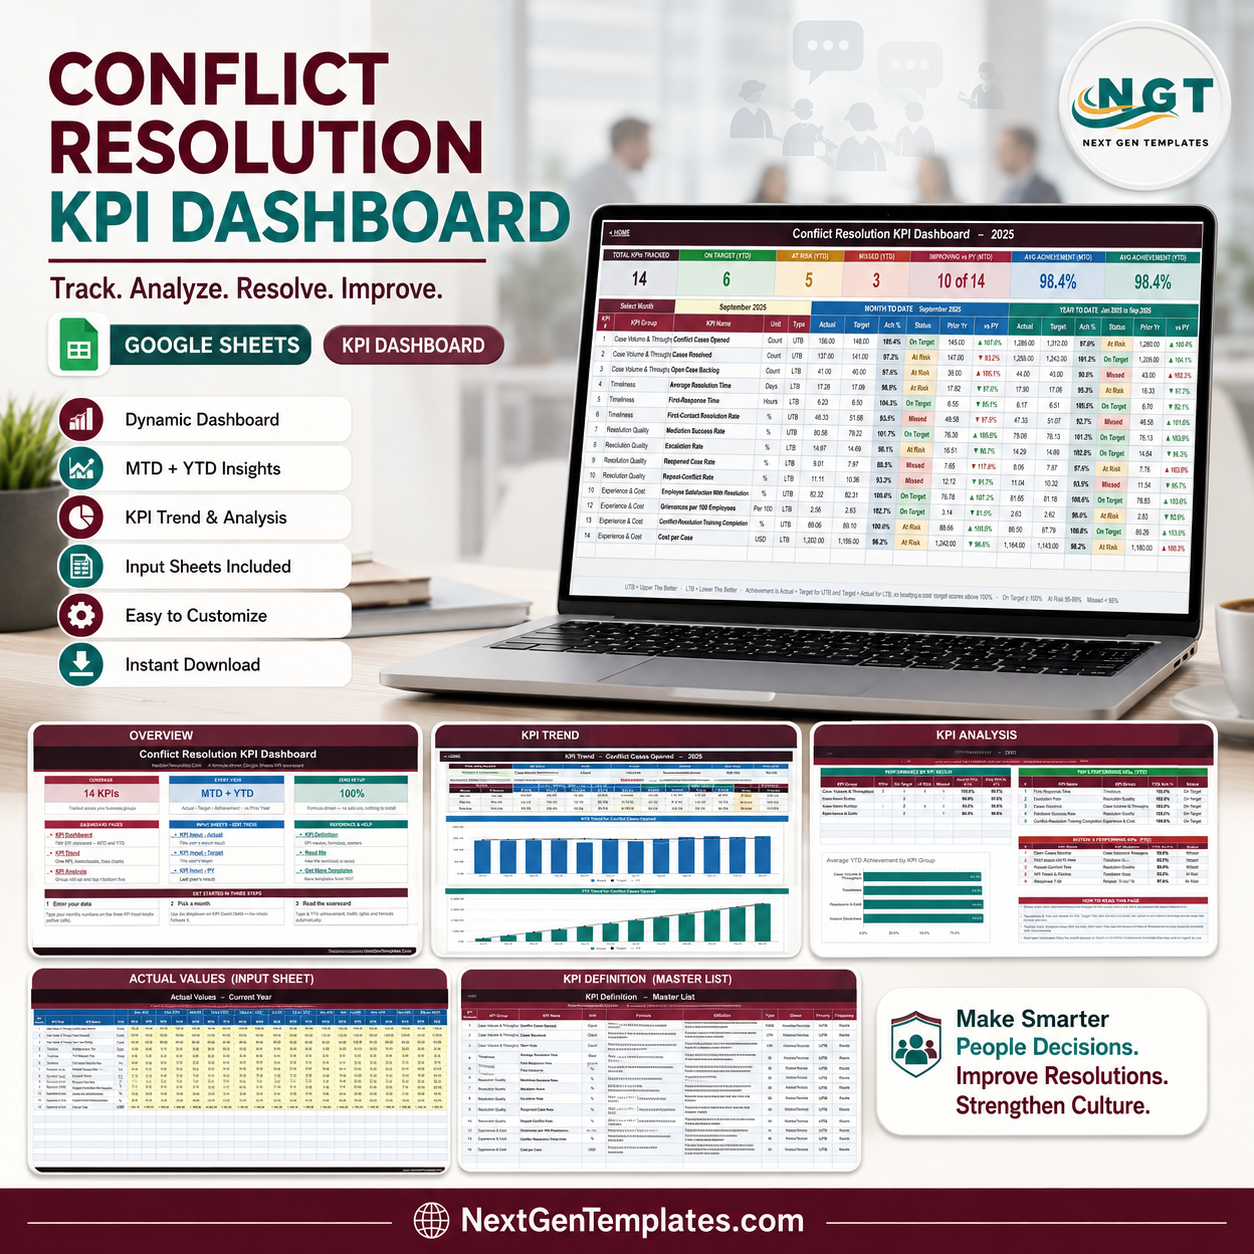
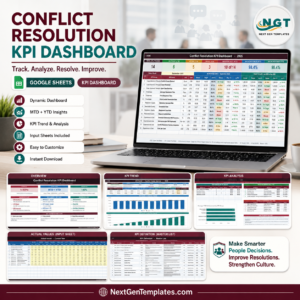
The Conflict Resolution KPI Dashboard in Google Sheets is a formula-driven KPI scorecard that tracks 14 employee-relations KPIs across 4 KPI groups, showing month-to-date and year-to-date achievement, a traffic-light status and a prior-year comparison on every line. Pick one month from a single dropdown and all six sheets re-calculate. There is no add-on to install, no Apps Script to authorise and no query to refresh. Built by NextGenTemplates, whose YouTube channels reach 300K+ subscribers, and delivered as an instant download with a one-time payment and no subscription. This is a manual tracking and visualisation template: you type your own monthly totals and the sheet does the arithmetic.
Key Features of the Conflict Resolution KPI Dashboard in Google Sheets
- 14 KPIs, 4 groups. Case Volume & Throughput (3), Timeliness (3), Resolution Quality (4) and Experience & Cost (4).
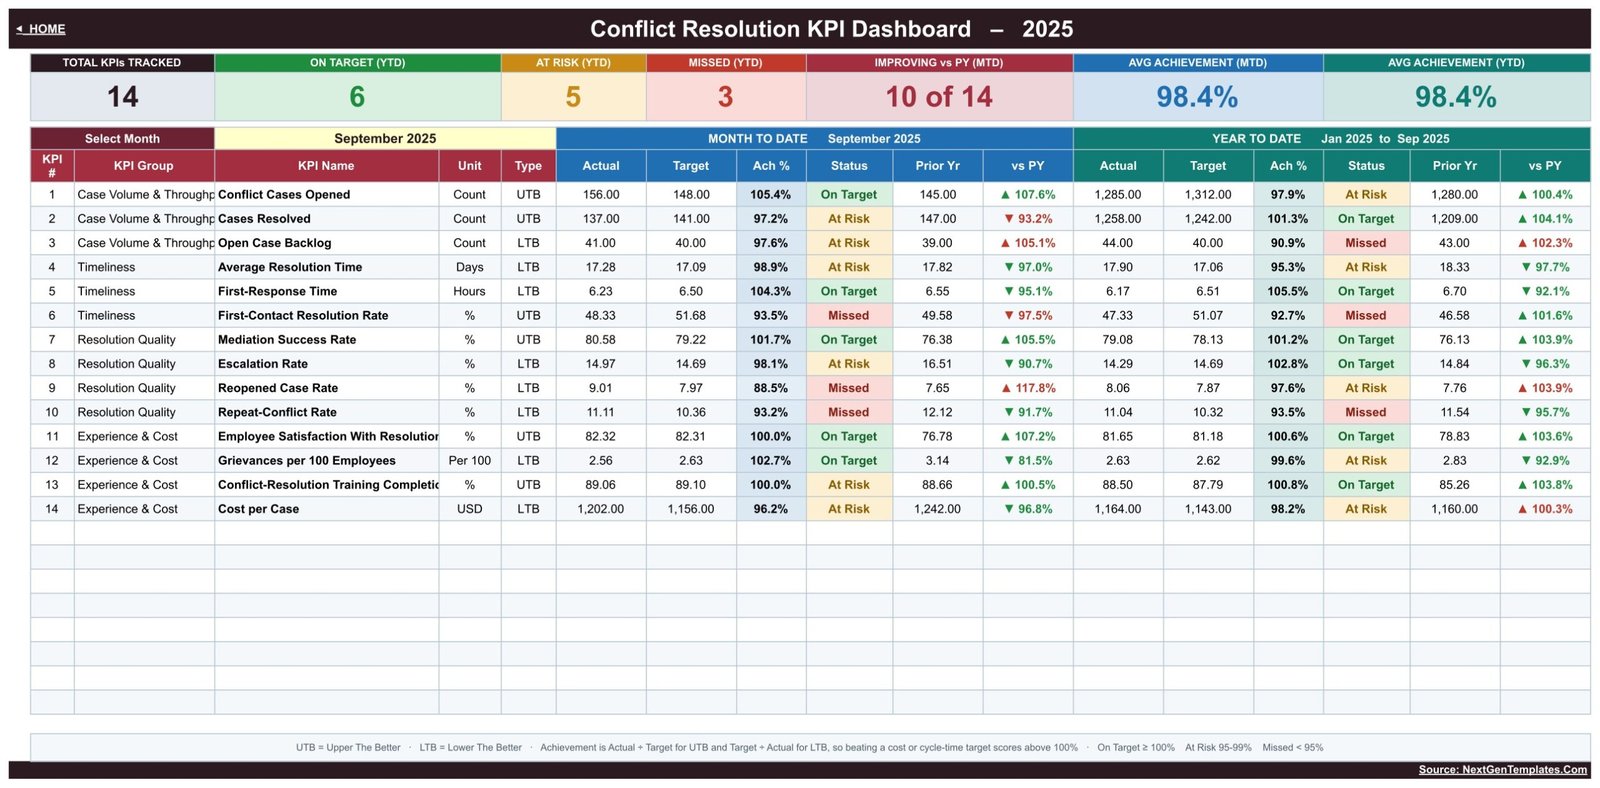
- MTD and YTD in one row. Each KPI shows Actual, Target, Achievement %, Status and Prior Year for the selected month and for the year to date.
- Seven summary tiles. Total KPIs Tracked, On Target (YTD), At Risk (YTD), Missed (YTD), Improving vs PY (MTD), Avg Achievement (MTD) and Avg Achievement (YTD).
- Direction-aware scoring. Upper-the-better KPIs score Actual divided by Target; lower-the-better KPIs such as Average Resolution Time, Escalation Rate and Cost per Case score Target divided by Actual, so beating a cycle-time or cost target reads above 100%.
- Editable thresholds. On Target from 100%, At Risk 95% to 99%, Missed below 95% – all three live in the Status formulas and can be changed.
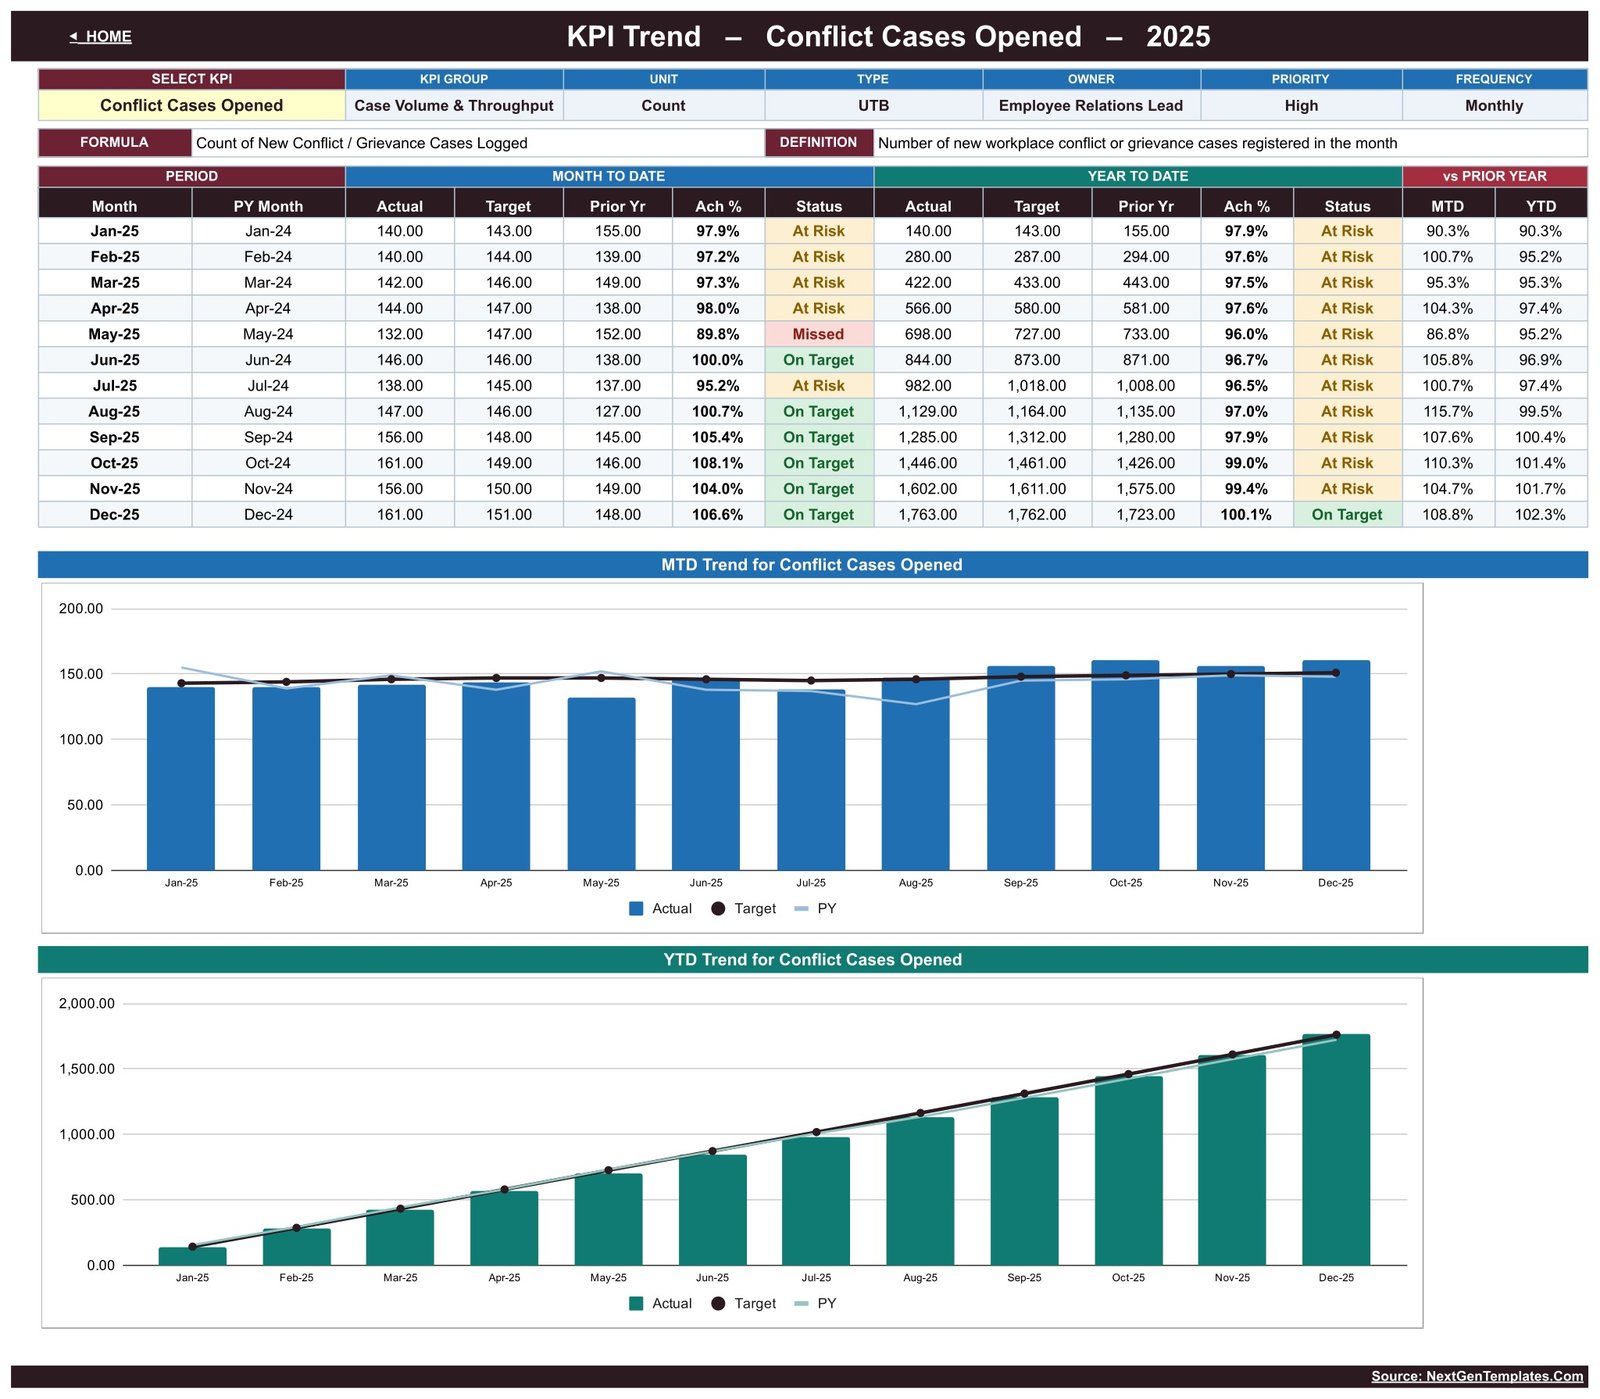
- A trend page for any single KPI. Twelve rows, Jan to Dec, with an MTD chart and a YTD chart plotting Actual against Target and Prior Year.
- An analysis page that ranks itself. Group roll-up, automatic Top 5 and Bottom 5 by YTD achievement, and an Average YTD Achievement by KPI Group bar chart.
- An editable KPI master list. Rename, re-group, add or delete a KPI on one sheet and every other sheet follows without a formula edit.
What’s Inside the Conflict Resolution KPI Dashboard in Google Sheets
Home
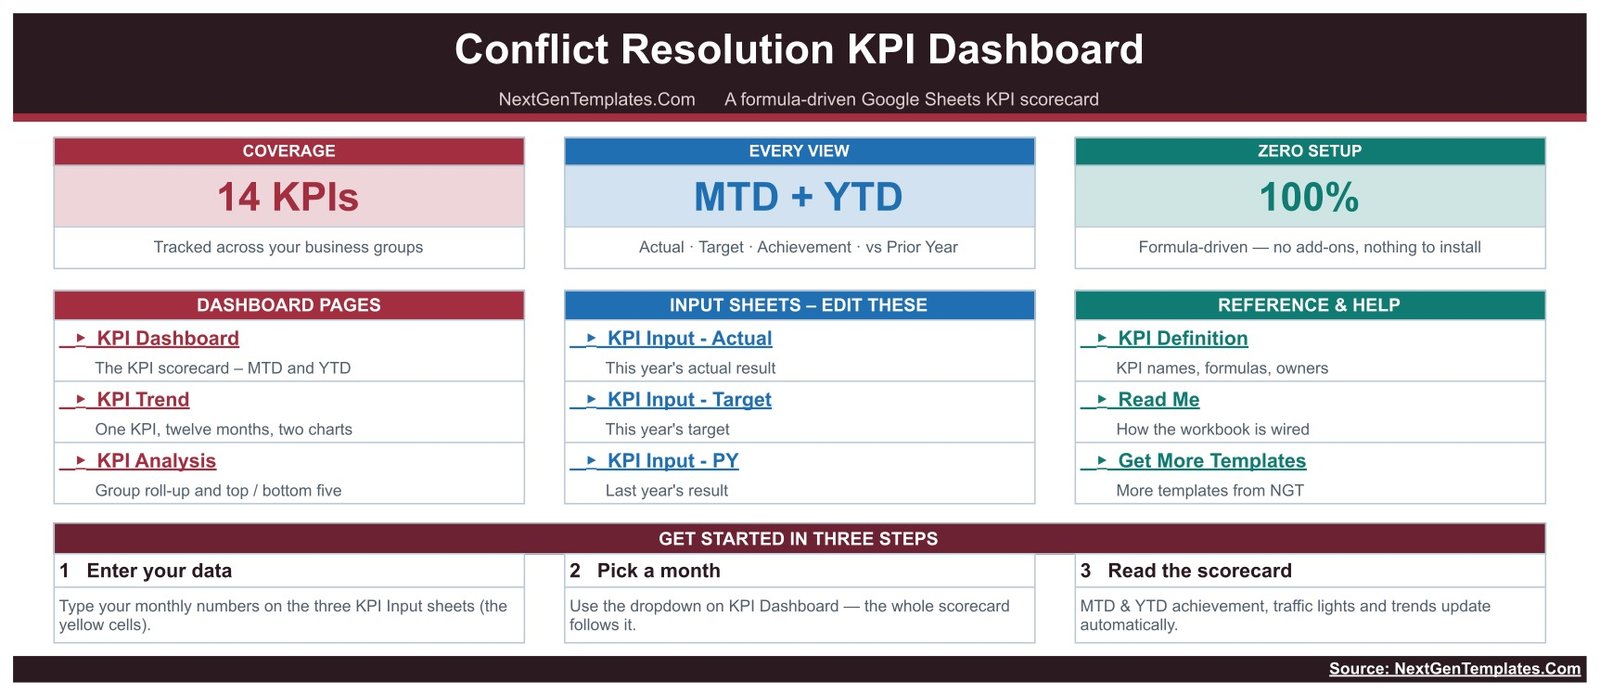
A launch page with three headline tiles – 14 KPIs, MTD + YTD, and 100% formula-driven – plus link blocks for the three dashboard pages, the three input sheets and the reference sheets, and a three-step getting-started strip.
KPI Dashboard
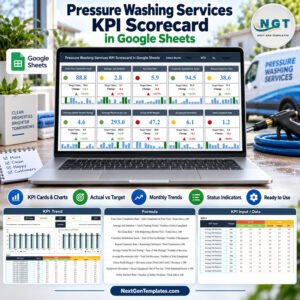
The scorecard itself. The demo month is September 2025, where 6 KPIs sit On Target for the year, 5 At Risk and 3 Missed, 10 of 14 are improving against prior year, and average achievement reads 98.4% for both MTD and YTD. Mediation Success Rate runs 80.58% against an 79.22% target (101.7%, On Target), while Reopened Case Rate at 9.01% against 7.97% scores 88.5% and flags Missed.
KPI Trend
Choose one KPI and read its whole year. The sheet carries the KPI’s group, unit, type, owner, priority, frequency, formula and definition in a header strip, then twelve monthly rows with MTD and YTD blocks and a vs Prior Year pair. Two charts follow – MTD Trend for the selected KPI and YTD Trend for the selected KPI – each plotting Actual bars against Target markers and a Prior Year line.
KPI Analysis
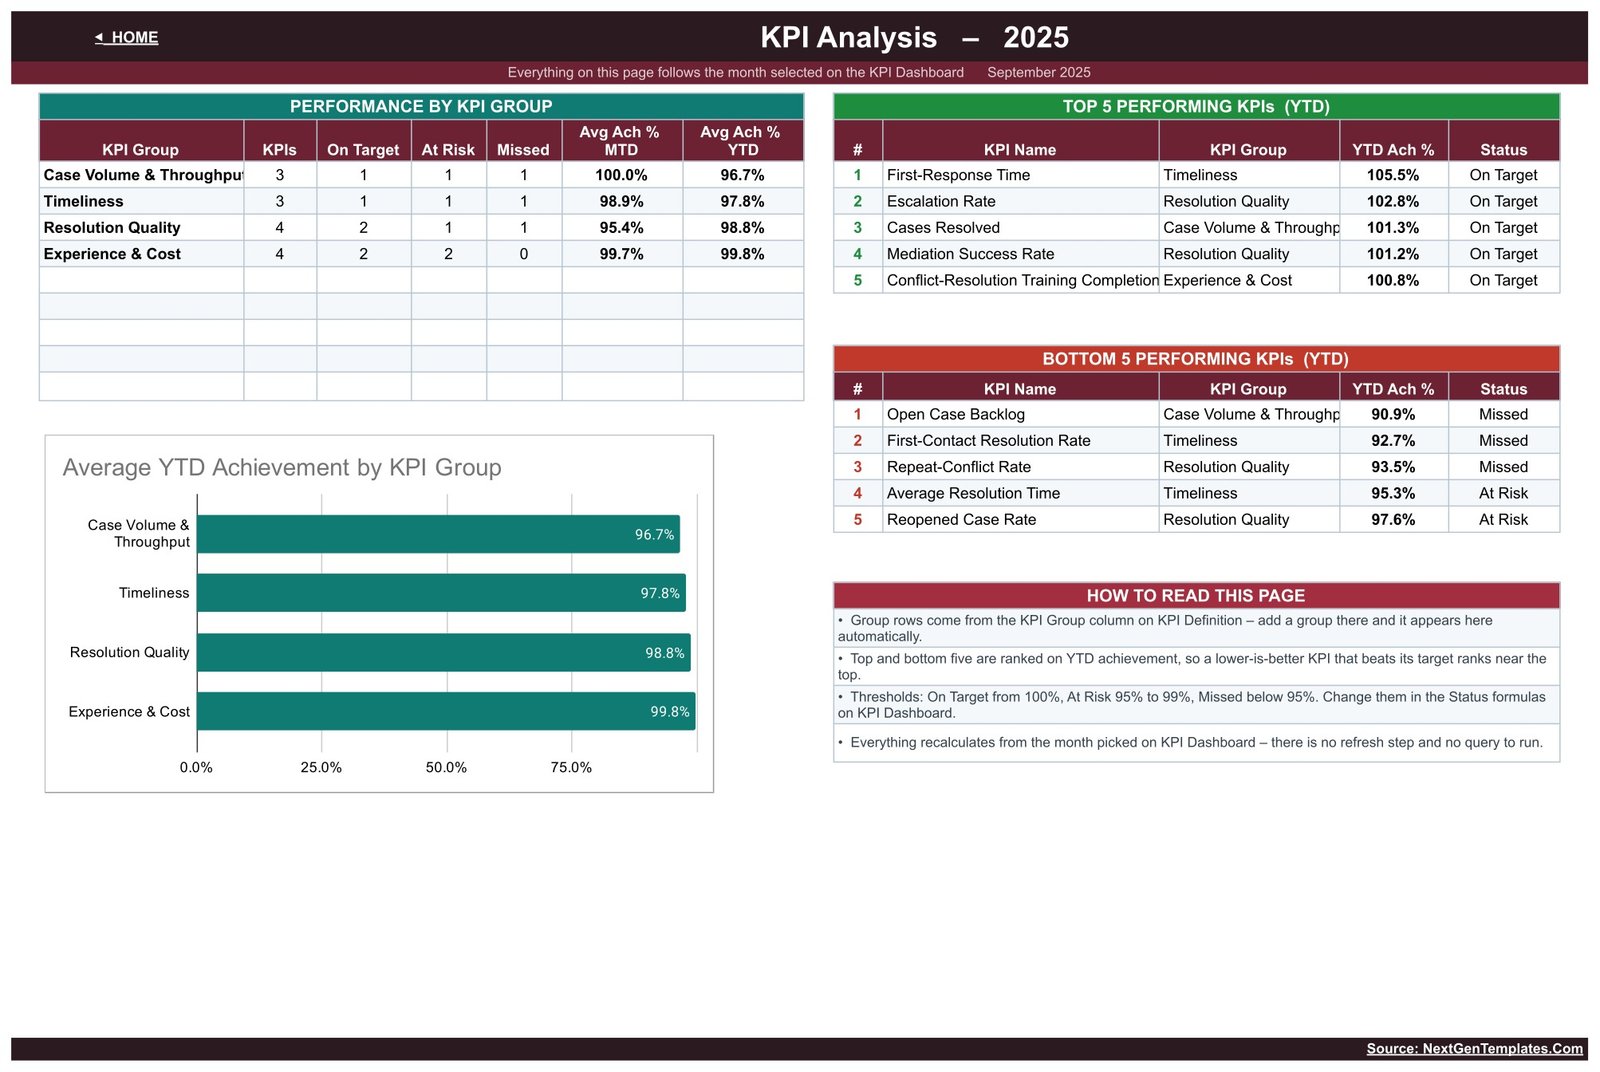
Performance by KPI Group counts how many KPIs in each group are On Target, At Risk or Missed and averages their MTD and YTD achievement. Top 5 and Bottom 5 Performing KPIs rank on YTD achievement – in the demo data First-Response Time leads at 105.5% and Open Case Backlog sits last at 90.9%. An Average YTD Achievement by KPI Group bar chart and a How to Read This Page panel finish the sheet.
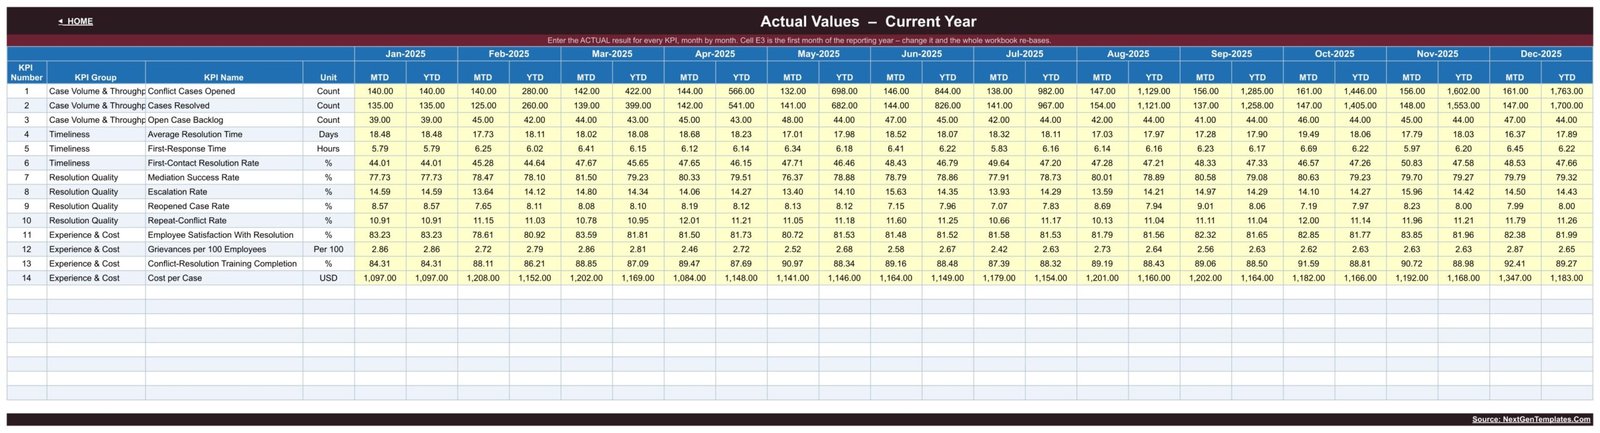
KPI Input – Actual, Target and PY
Three identical input grids: this year’s actual result, this year’s target and last year’s result. Fourteen KPI rows by twelve months, with MTD and YTD columns and yellow cells marking everything you are meant to type. Change the first month in cell E3 and the whole workbook re-bases to your financial year.
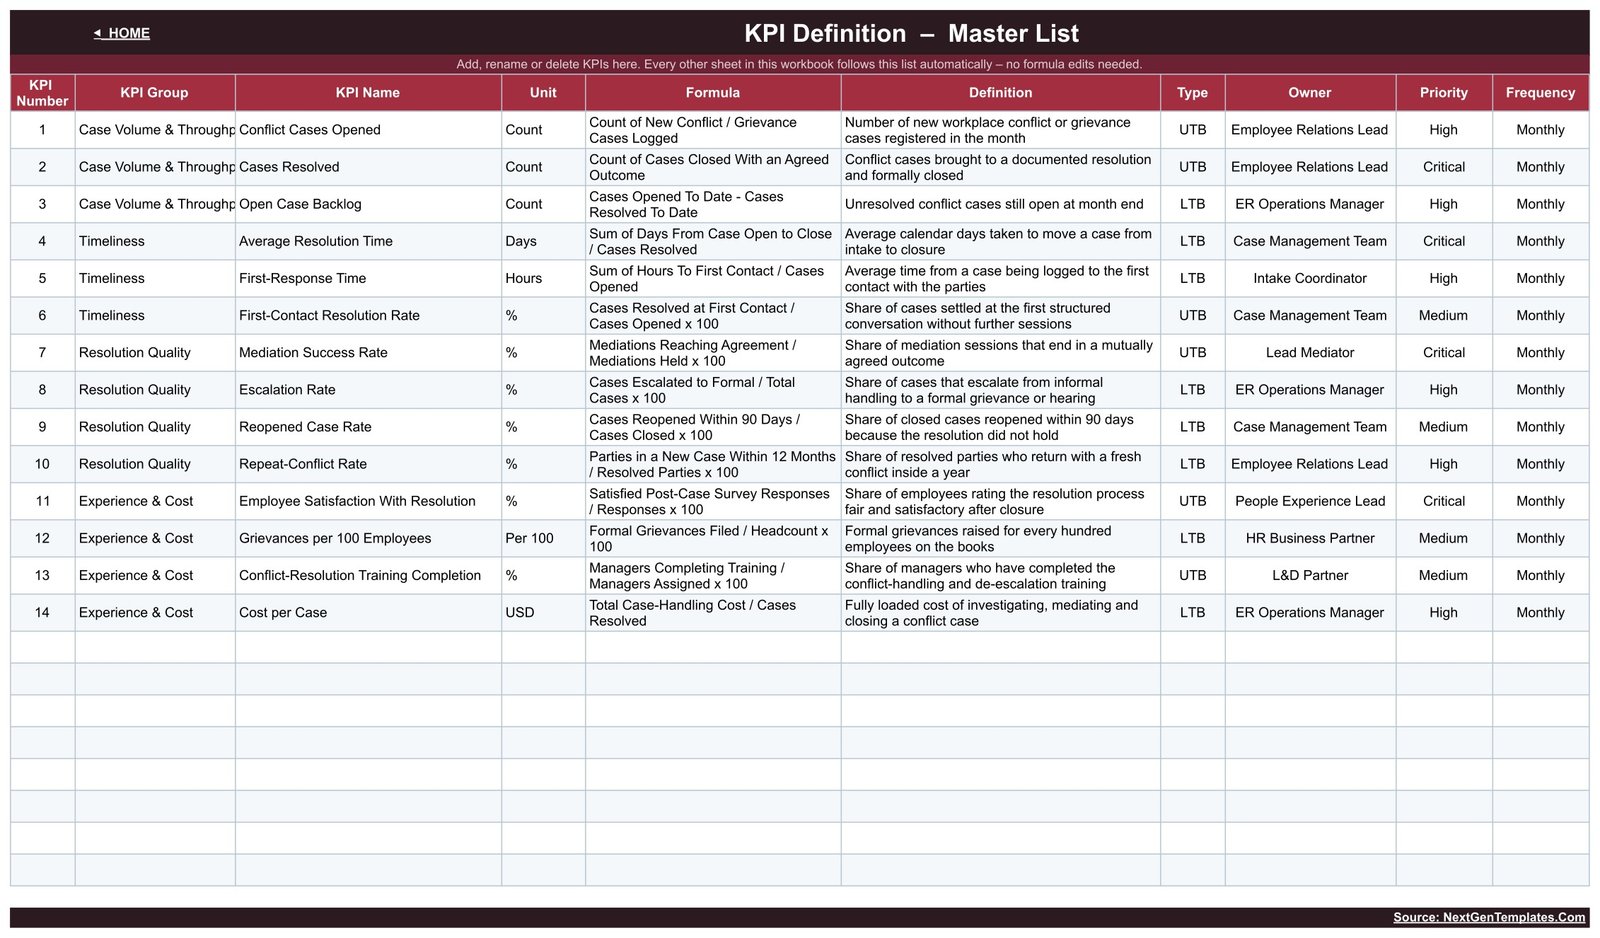
KPI Definition
The master list every other sheet reads from: KPI number, group, name, unit, formula, definition, type (UTB or LTB), owner, priority and frequency. Owners ship as roles – Employee Relations Lead, ER Operations Manager, Case Management Team, Intake Coordinator, Lead Mediator, People Experience Lead, HR Business Partner and L&D Partner – so you can swap in your own without touching a formula.
Google Sheets vs. Excel vs. Paid HR Case Software – Where This Fits
| This template (Google Sheets) | An Excel KPI workbook | Paid HR case software | |
|---|---|---|---|
| Cost | One-time 8.99 | One-time, similar | Per user, per month |
| Platform | Google Sheets in a browser | Desktop Excel | Vendor web app |
| Setup time | Minutes – make a copy and type | Minutes | Weeks, with implementation |
| Real-time team collaboration | Yes, native | Only via OneDrive co-authoring | Yes |
| Mobile access | Yes, Sheets app | Limited | Yes |
| Customisable KPIs | Yes – edit the master list | Yes | Usually fixed by the vendor |
| Share with a link | Yes | No | Account required |
| Year-1 cost at 5 users | 8.99 total | Similar one-off | Typically several thousand |
| KPIs out of the box | 14, in 4 groups | Varies | Vendor-defined |
| Individual case records | No – monthly totals only | No | Yes, that is what it is for |
The honest summary: this is a reporting layer, not a case system. If you need to store, investigate and audit individual grievances, buy software built for that. If you already handle cases somewhere else and simply need a monthly scorecard your HR leadership can read, this is the cheaper and faster option.
Who This Template Is For – and Who It’s Not For
A good fit if you are an employee-relations or HR operations lead who already tracks conflict and grievance cases somewhere, and you need a monthly scorecard with targets, prior-year comparison and traffic lights; if you report to a leadership team that wants one page rather than a case list; or if you want to trial a KPI set before committing to an HR analytics platform.
Not a good fit if you need to store individual case files, log investigation notes, run workflows or produce an audit trail – this sheet holds monthly totals only. It is also not the right tool if you want a live connection to an HRIS or ticketing system; every number here is typed in by you. And it is not an employment-law or compliance product: it makes no claim about any legal obligation, does not check your process against any statute or code of practice, and gives no HR or legal advice.
Looking for a broader people dashboard instead of a scorecard? See the analytical Diversity & Inclusion Dashboard in Google Sheets, which is a different product built on a data table rather than a month picker.
How to Use the Conflict Resolution KPI Dashboard in Google Sheets
- Open the PDF in your download and click the Google Sheets link, then choose File > Make a copy so the file lands in your own Drive.
- Open KPI Definition and edit the master list – rename KPIs to your own wording, change groups, set owners and priorities, or delete rows you do not measure.
- Set your reporting year on KPI Input – Actual by changing the first month in cell E3.
- Type your monthly totals into the yellow cells on KPI Input – Actual, KPI Input – Target and KPI Input – PY. Enter aggregate numbers only – no names, no case identifiers.
- Go to KPI Dashboard and pick a month from the dropdown. The tiles, achievement percentages and traffic lights update immediately.
- Use KPI Trend to inspect one KPI across the year, and KPI Analysis for the group roll-up and the top and bottom five.
- Adjust the 100% / 95% thresholds inside the Status formulas on KPI Dashboard if your organisation grades differently.
Real-World Use Cases
Priya, ER Operations Manager at a 900-person services firm. Cases live in a ticketing tool that produces counts but no targets. Each month Priya pastes six totals into the input sheets and sends leadership the KPI Dashboard tab – backlog, average resolution time and escalation rate against target, with the prior-year column doing the arguing for her.
Daniel, HR Business Partner for two manufacturing sites. He keeps one copy per site and compares Grievances per 100 Employees and Repeat-Conflict Rate side by side. Because the copies share a KPI master list, both sites report the same definitions.
Amara, People Experience Lead at a 40-person startup. No HR platform and no budget for one. She tracks five of the fourteen KPIs, deletes the rest from the master list, and still gets a quarterly board slide out of the KPI Analysis page.
Frequently Asked Questions
Does this template help me comply with employment law or handle grievances correctly?
No. It makes no employment-law, HR-compliance or employee-relations assurance claim of any kind. It is a spreadsheet that charts numbers you type in. Decisions about how to run a grievance or conflict process should be taken with your own qualified HR and legal advisers.
Is this a case-management or investigation system?
No. There is no case record, no notes field, no workflow and no audit trail. The template holds one aggregate figure per KPI per month.
What about confidentiality – can I put case details in here?
Please do not. Grievance and conflict records are confidential personal data, and how they are stored, shared and retained is your responsibility as the data controller. Enter monthly totals only, and apply your normal Google Drive sharing controls to your copy.
Does it connect to my HRIS or ticketing system?
No. There is no integration, no API call and no scheduled refresh. That is deliberate – it is why the file needs no add-on and no permissions.
Can I change the KPIs?
Yes. The KPI Definition sheet is the master list. Rename, re-group, add or delete rows and the dashboard, trend and analysis sheets follow automatically.
Why does a lower Cost per Case score above 100%?
Because it is marked LTB – lower the better. For those KPIs achievement is Target divided by Actual, so coming in under a cost or cycle-time target correctly reads as over-performance.
Do I need Excel or any paid add-on?
Neither. It runs entirely on native Google Sheets formulas and charts. A free Google account is all you need.
About the Author
Built by PK – Microsoft Certified Professional with 15+ years of Excel, Google Sheets, and Power BI experience. Founder of NextGenTemplates, reaching 300K+ subscribers across YouTube channels. Every template is hand-built and tested before release.
Explore Related Templates
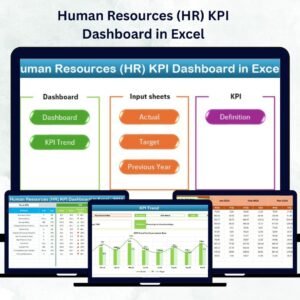
- Human Resources (HR) KPI Dashboard in Excel – the same scorecard idea across a wider HR KPI set.
- Corporate Governance KPI Dashboard in Google Sheets – identical scorecard mechanics for board and policy metrics.
- Internal Communications KPI Dashboard in Google Sheets – a natural companion when conflict volumes track communication gaps.
- Employee Benefits Utilization KPI Dashboard in Google Sheets – benefits uptake on the same month-picker layout.
- Leadership Development KPI Dashboard in Google Sheets – manager capability metrics that sit alongside conflict handling.
- Browse the whole Google Sheets KPI Dashboard category or every Google Sheets template.
Read the full walkthrough on the blog: Conflict Resolution KPI Dashboard in Google Sheets.
Get the Conflict Resolution KPI Dashboard in Google Sheets today – one-time payment, instant download, and the PDF in your order carries the Make a copy link so you are typing your own numbers within minutes.
Watch the step-by-step video Demo:
Last updated: 20 August 2026.





























Reviews
There are no reviews yet.