

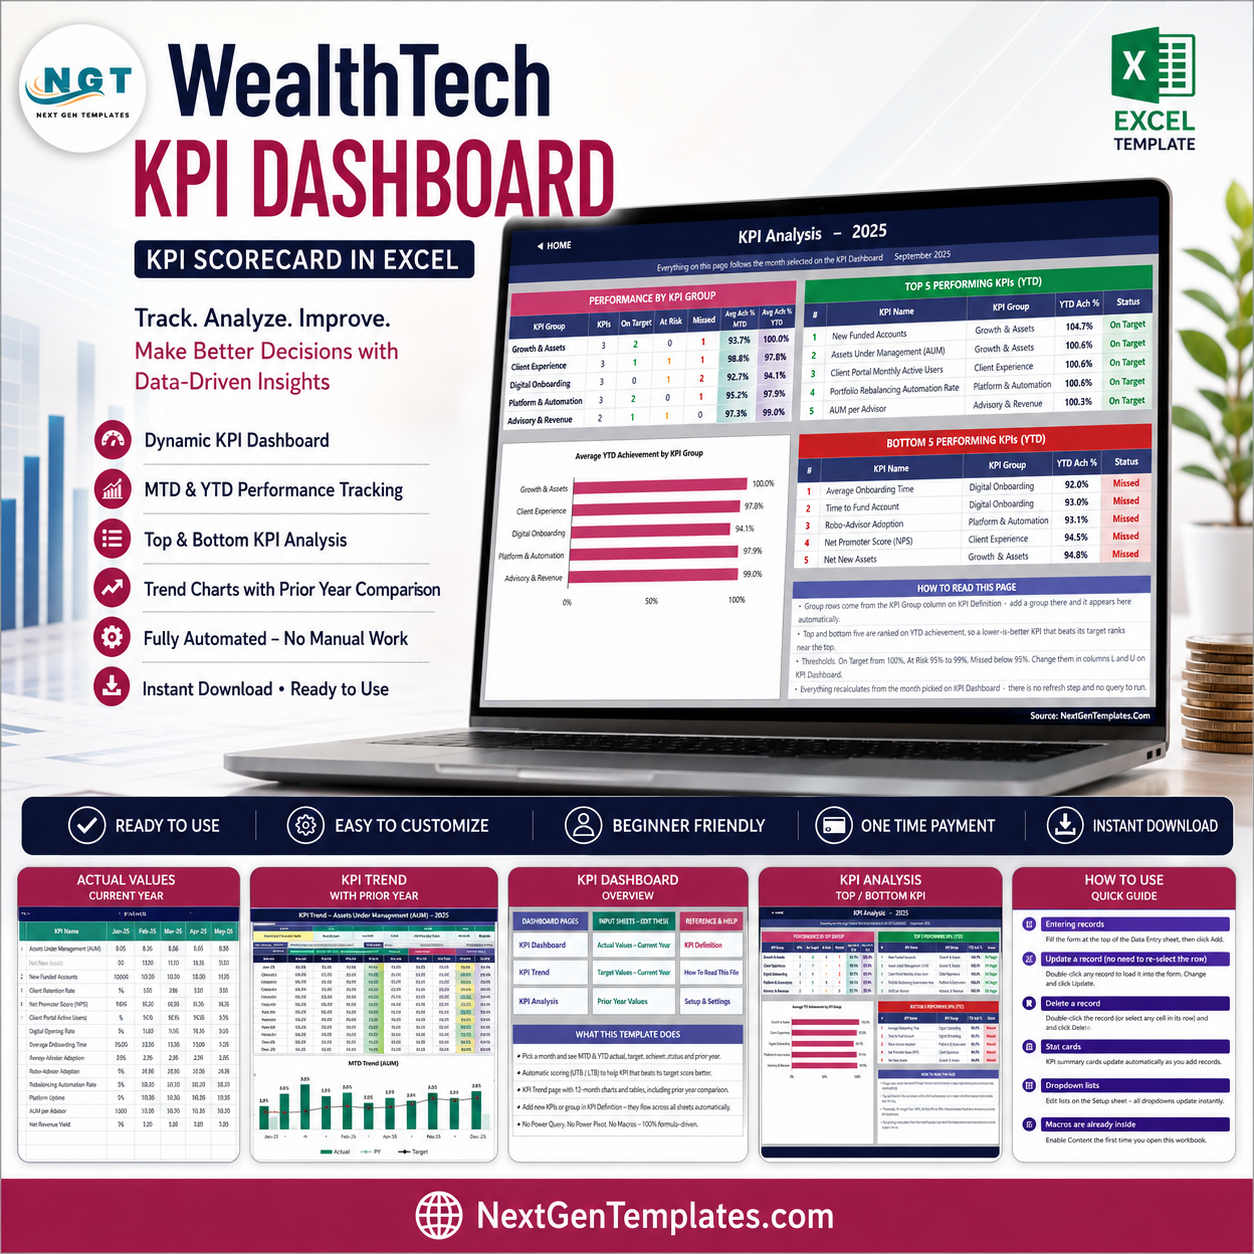
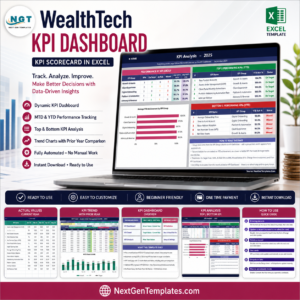
The WealthTech KPI Dashboard in Excel turns 14 sample KPIs across 5 operating groups into one formula-driven scorecard covering 12 months, MTD and YTD results, targets, prior-year values, status and achievement. Select a month to review 7 summary cards, every KPI row, a single-KPI trend and top/bottom performance without Power Query, Power Pivot or macros. Built by a Microsoft Certified Professional with 15+ years of spreadsheet and BI experience, it is an instant digital download with a one-time payment and lifetime access.
Important: This is a manually maintained KPI reporting workbook with sample data. It does not connect to broker, custodian, CRM, bank, market-data or portfolio-accounting systems; calculate returns; execute trades; provide investment advice; or create regulatory filings.
Key Features of the WealthTech KPI Dashboard in Excel
- 14 editable sample KPIs grouped into Growth & Assets, Client Experience, Digital Onboarding, Platform & Automation, and Advisory & Revenue.
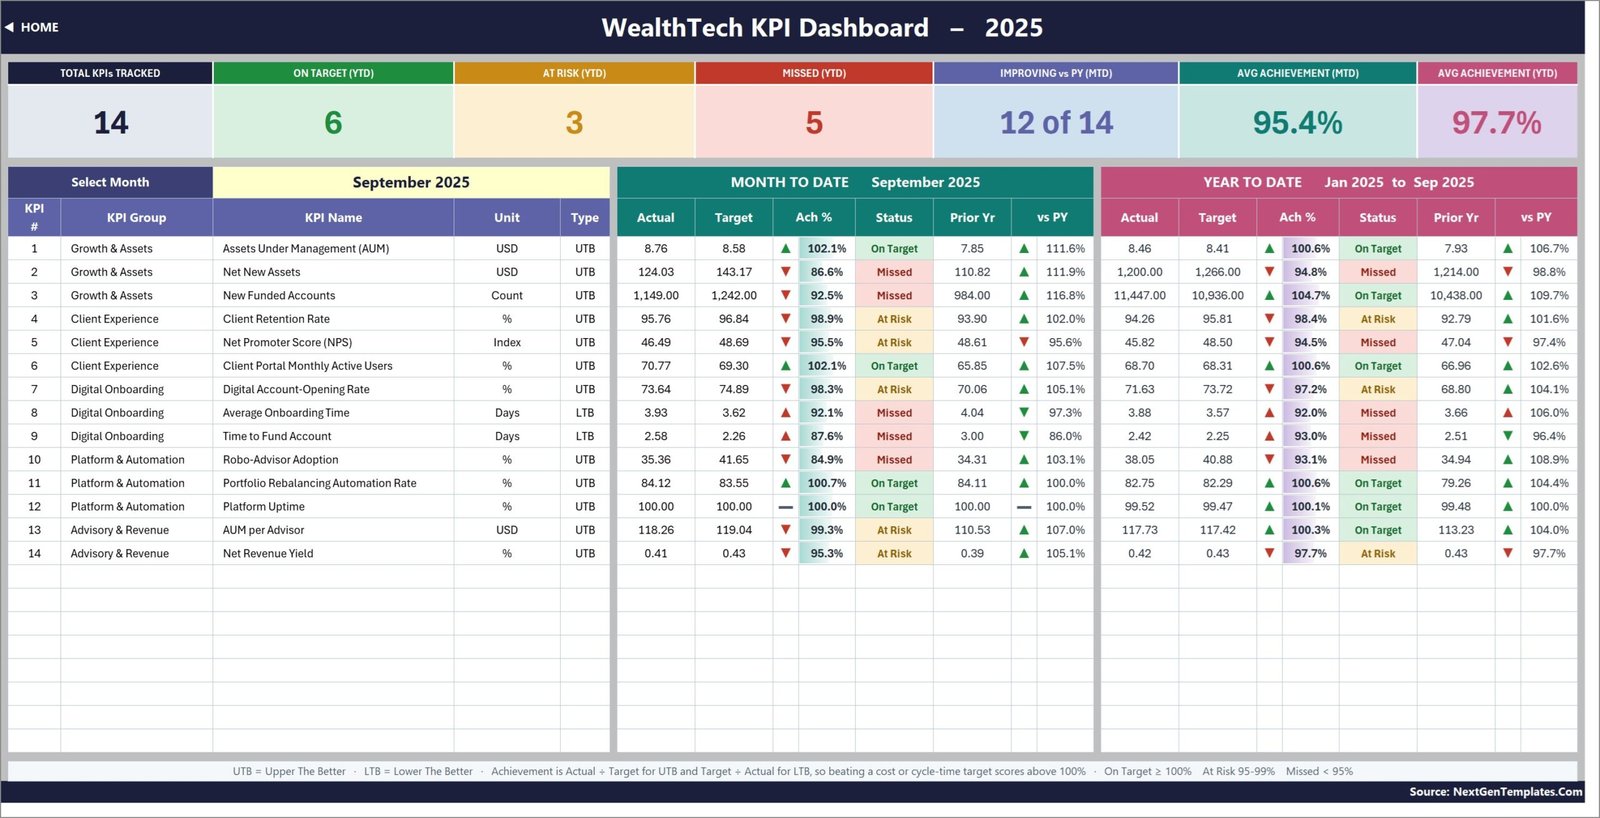
- MTD and YTD scorecard with Actual, Target, Achievement %, Status, Prior Year and year-over-year movement.
- Direction-aware scoring for Upper the Better and Lower the Better KPIs, with thresholds for On Target, At Risk and Missed.
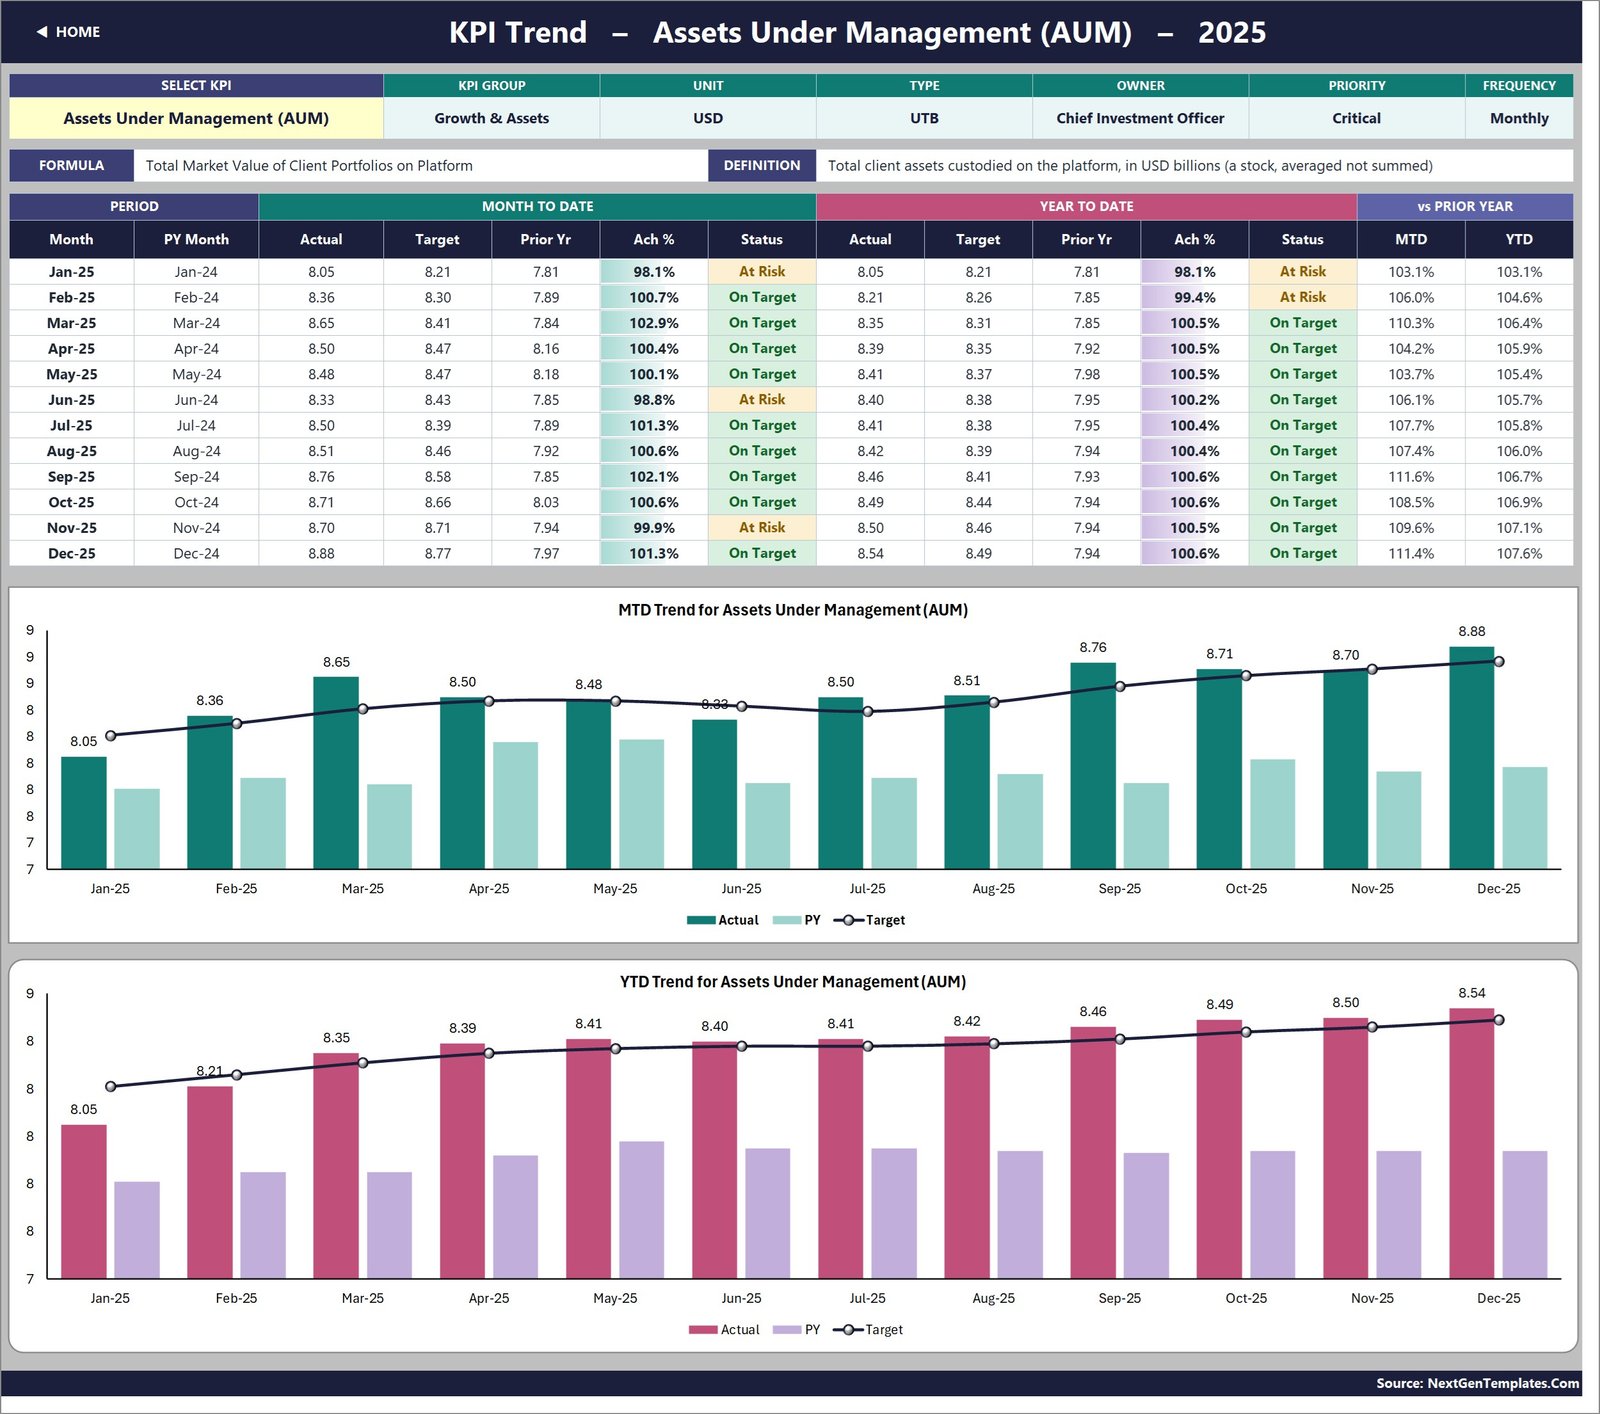
- Single-KPI trend page showing 12-month MTD and YTD tables plus Actual, Prior Year and Target charts.
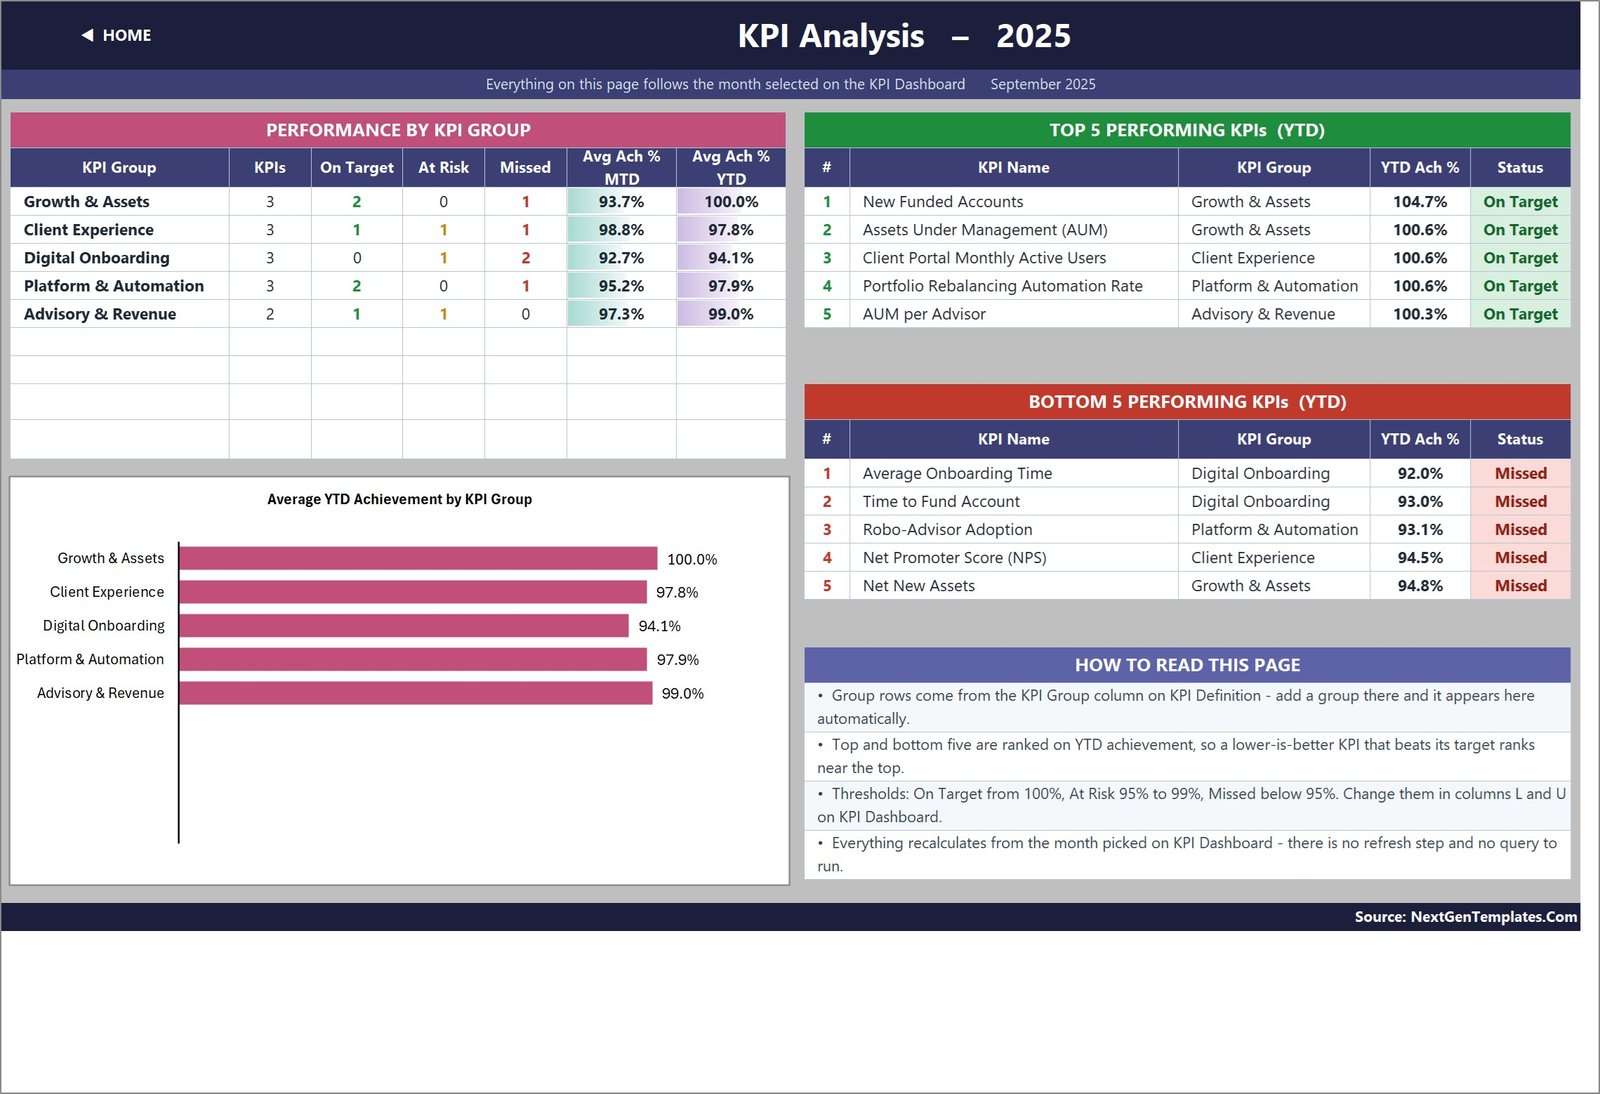
- Group and ranking analysis with average achievement by KPI group and top/bottom five YTD KPIs.
- 22-row capacity in the supplied structure: 14 rows are populated and 8 remain available for additional KPIs.
- Plain Excel formulas using familiar worksheet functions; no data model, add-in or refresh step.
What’s Inside the WealthTech KPI Dashboard in Excel
Home and Workbook Map
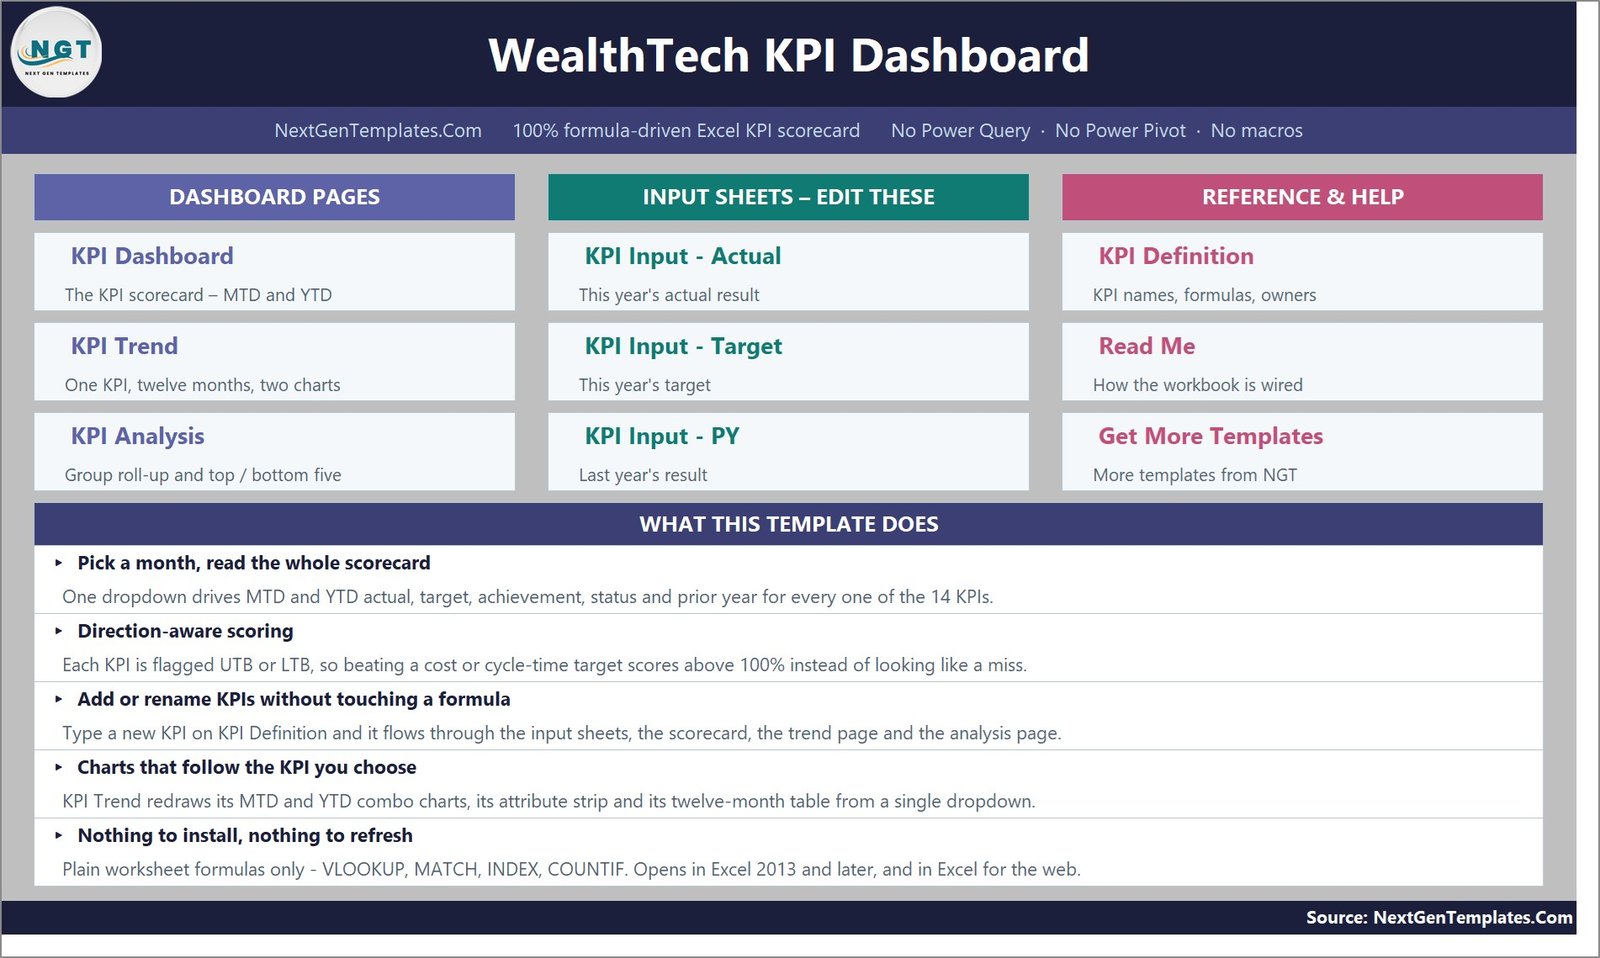
The Home page maps the three reporting pages, three input sheets and reference/help area, and explains the formula-driven design.
KPI Dashboard Scorecard
The main scorecard tracks all 14 KPIs for the selected month. Its seven cards summarize KPI count, YTD status counts, prior-year improvement and average MTD/YTD achievement.
KPI Trend
Choose one KPI to see its group, unit, type, owner, priority, frequency, formula and definition, followed by 12-month MTD and YTD comparisons.
KPI Analysis
This page rolls achievement up by KPI group and ranks the top and bottom five YTD KPIs so review meetings can focus on exceptions.
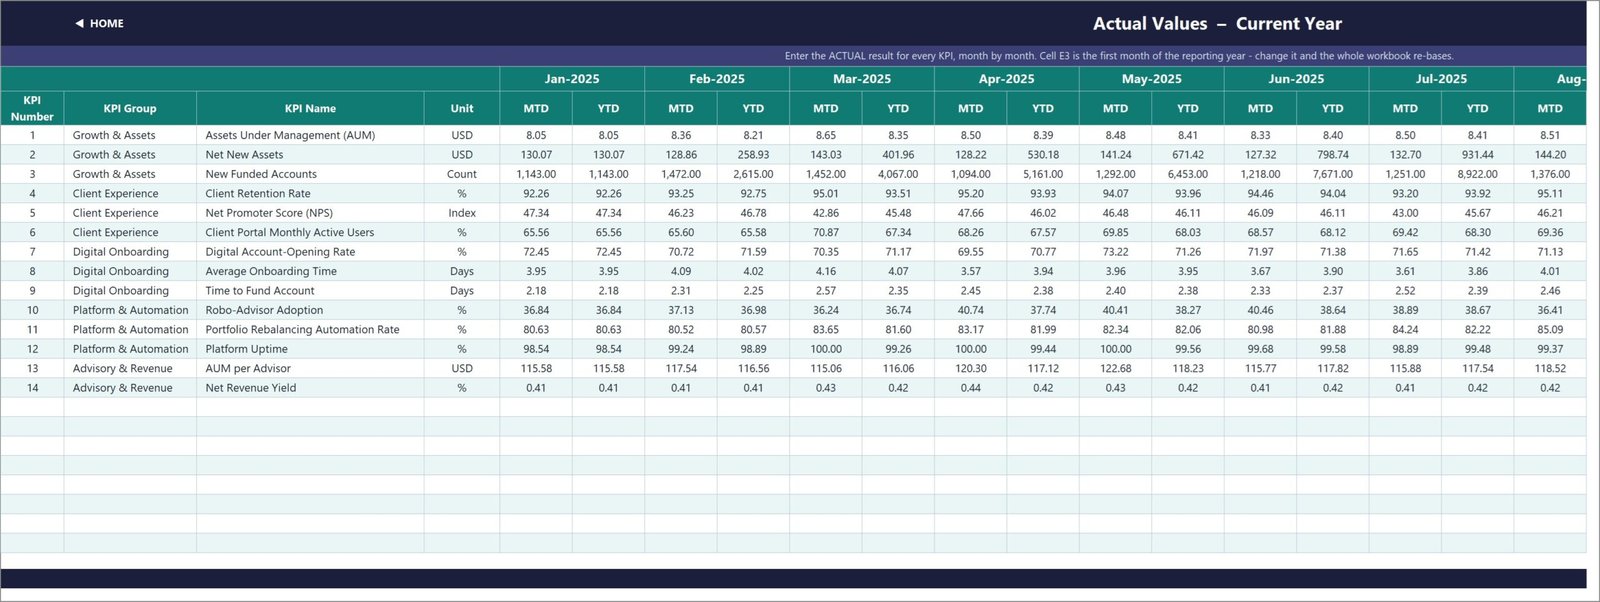
Actual Values – Current Year
Enter each KPI’s monthly MTD and YTD actual values. The reporting year begins from the first month entered on this sheet.
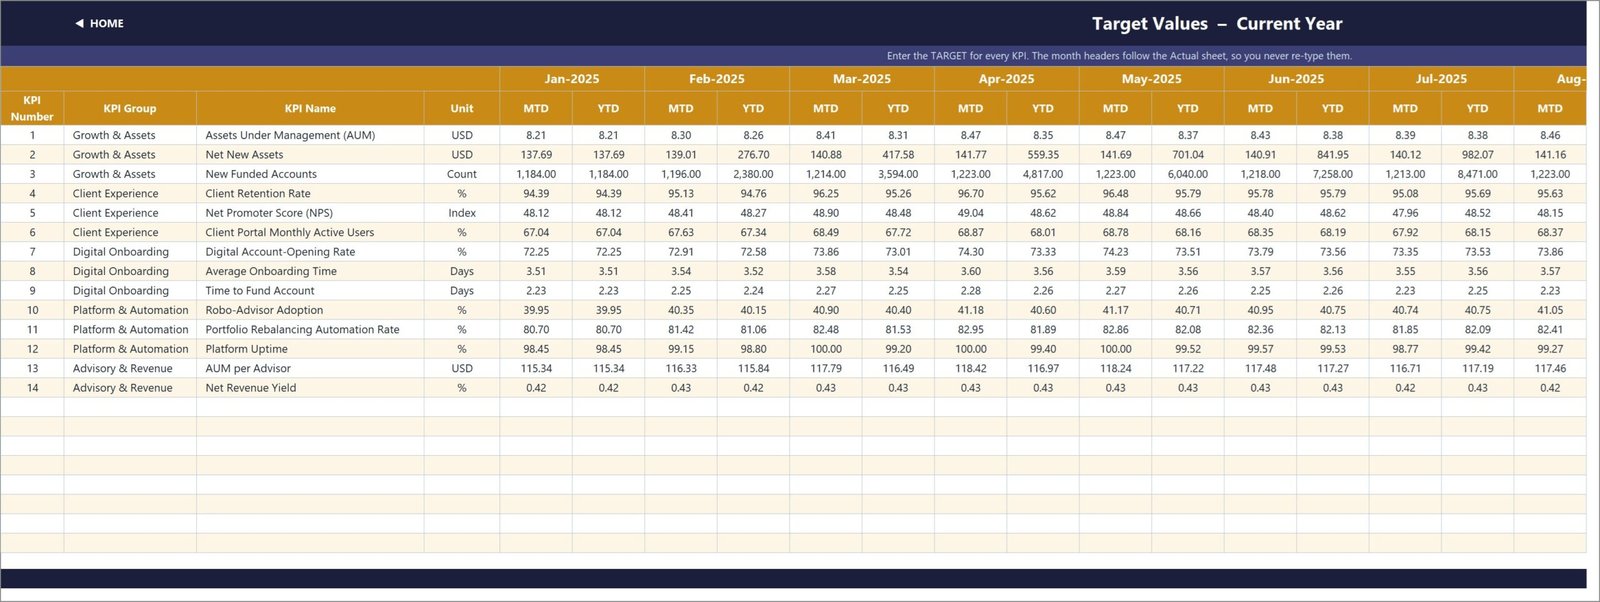
Target Values – Current Year
Maintain monthly targets using the same KPI rows and units; month headers follow the Actual sheet.
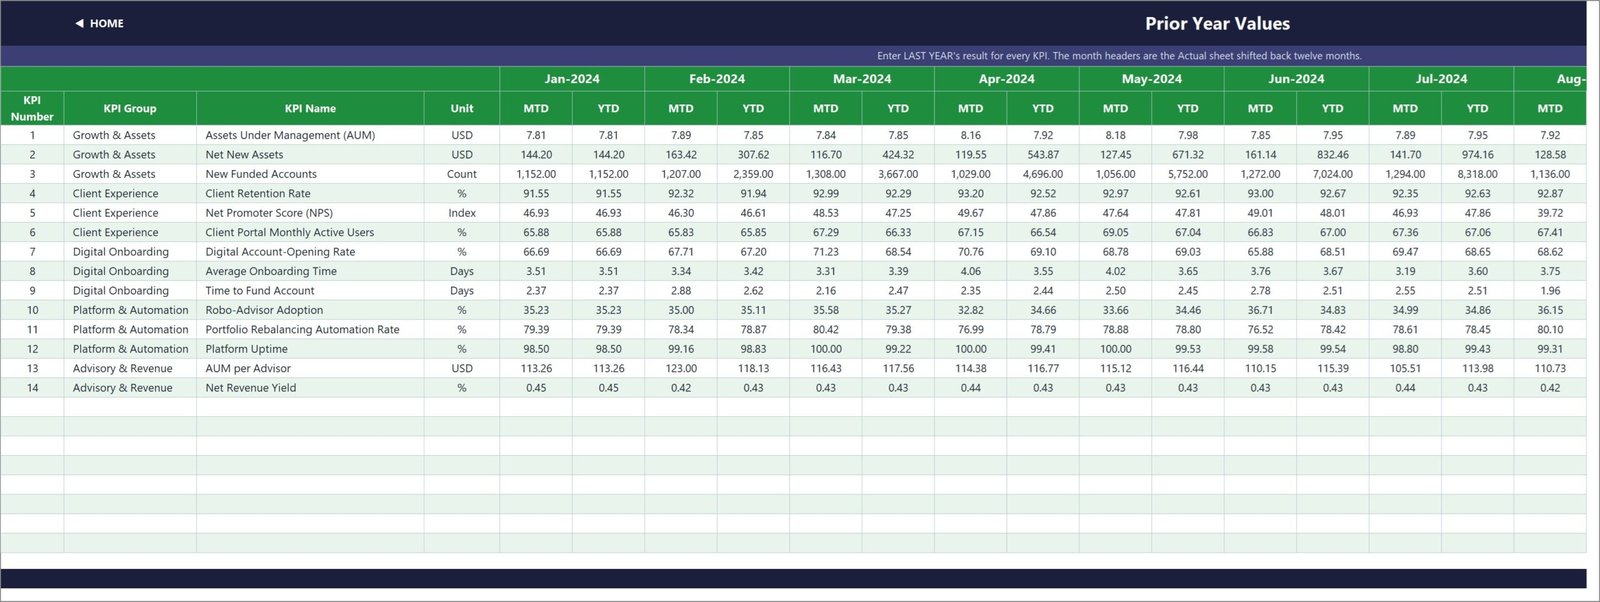
Prior Year Values
Add previous-year MTD and YTD values to power the comparison arrows and the trend-page prior-year series.
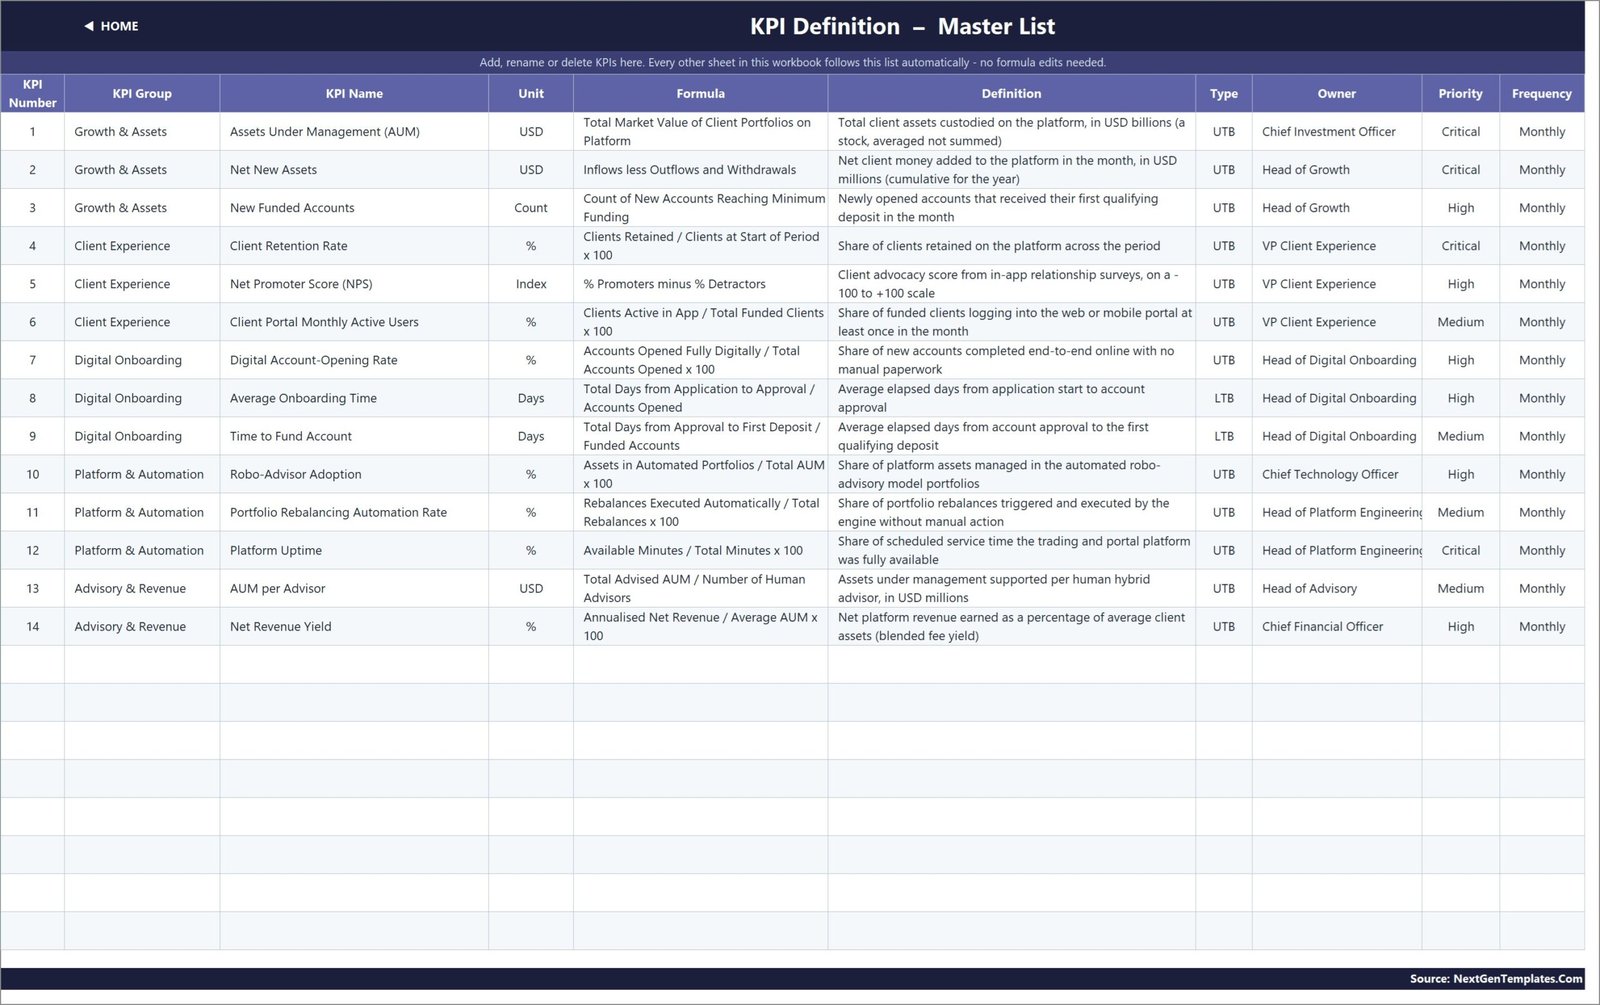
KPI Definition – Master List
Configure KPI number, group, name, unit, formula description, definition, UTB/LTB type, owner, priority and frequency in one master list.
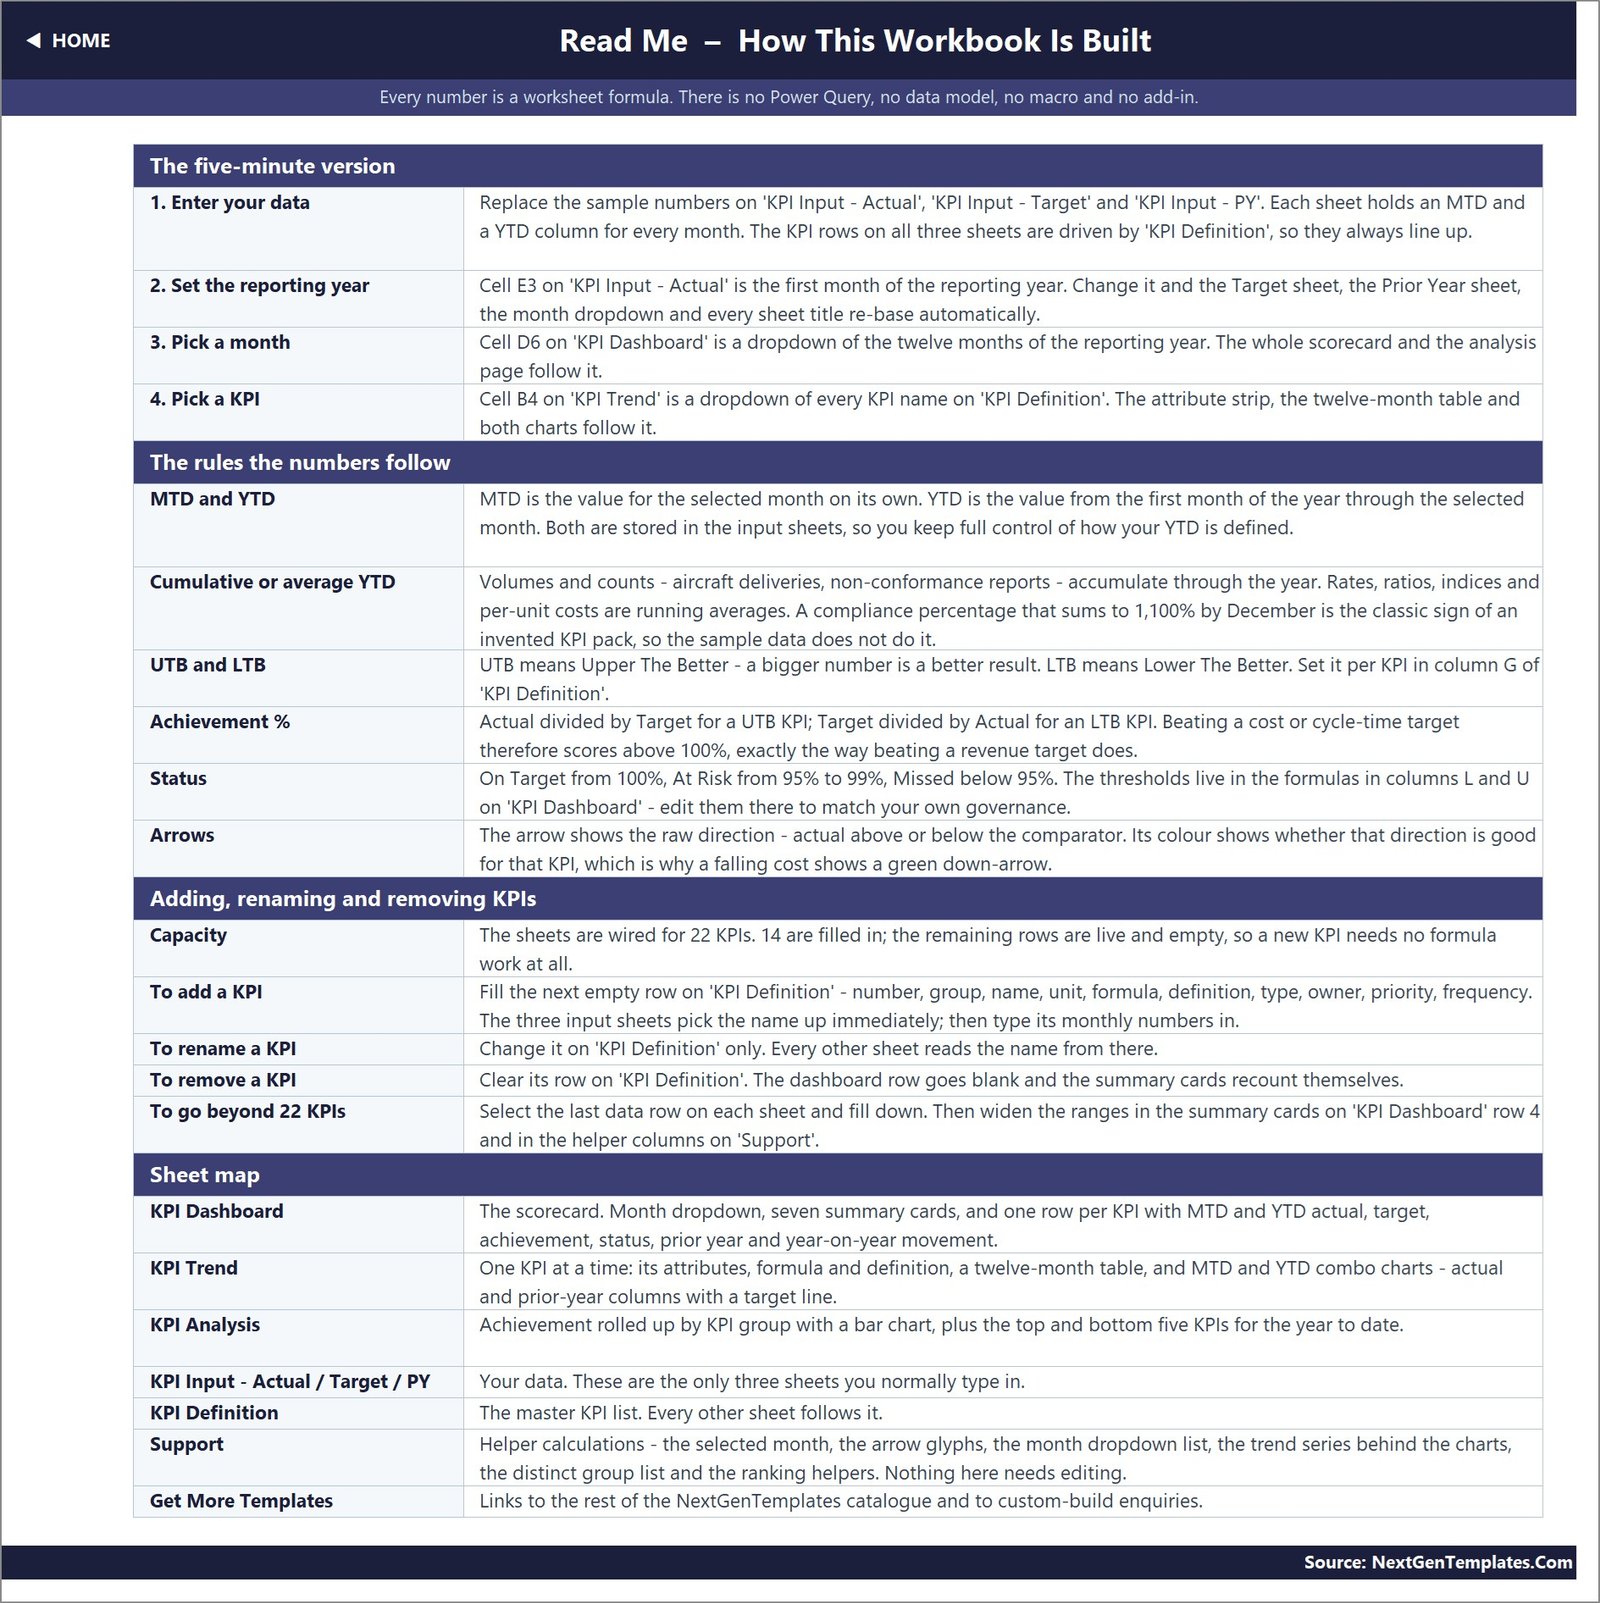
Read Me Guide
The guide explains data entry, year and month controls, scoring rules, row capacity and the sheet map. One generic example line still mentions aircraft deliveries and non-conformance reports; it is explanatory text only and should be replaced with WealthTech examples if you customize the workbook.
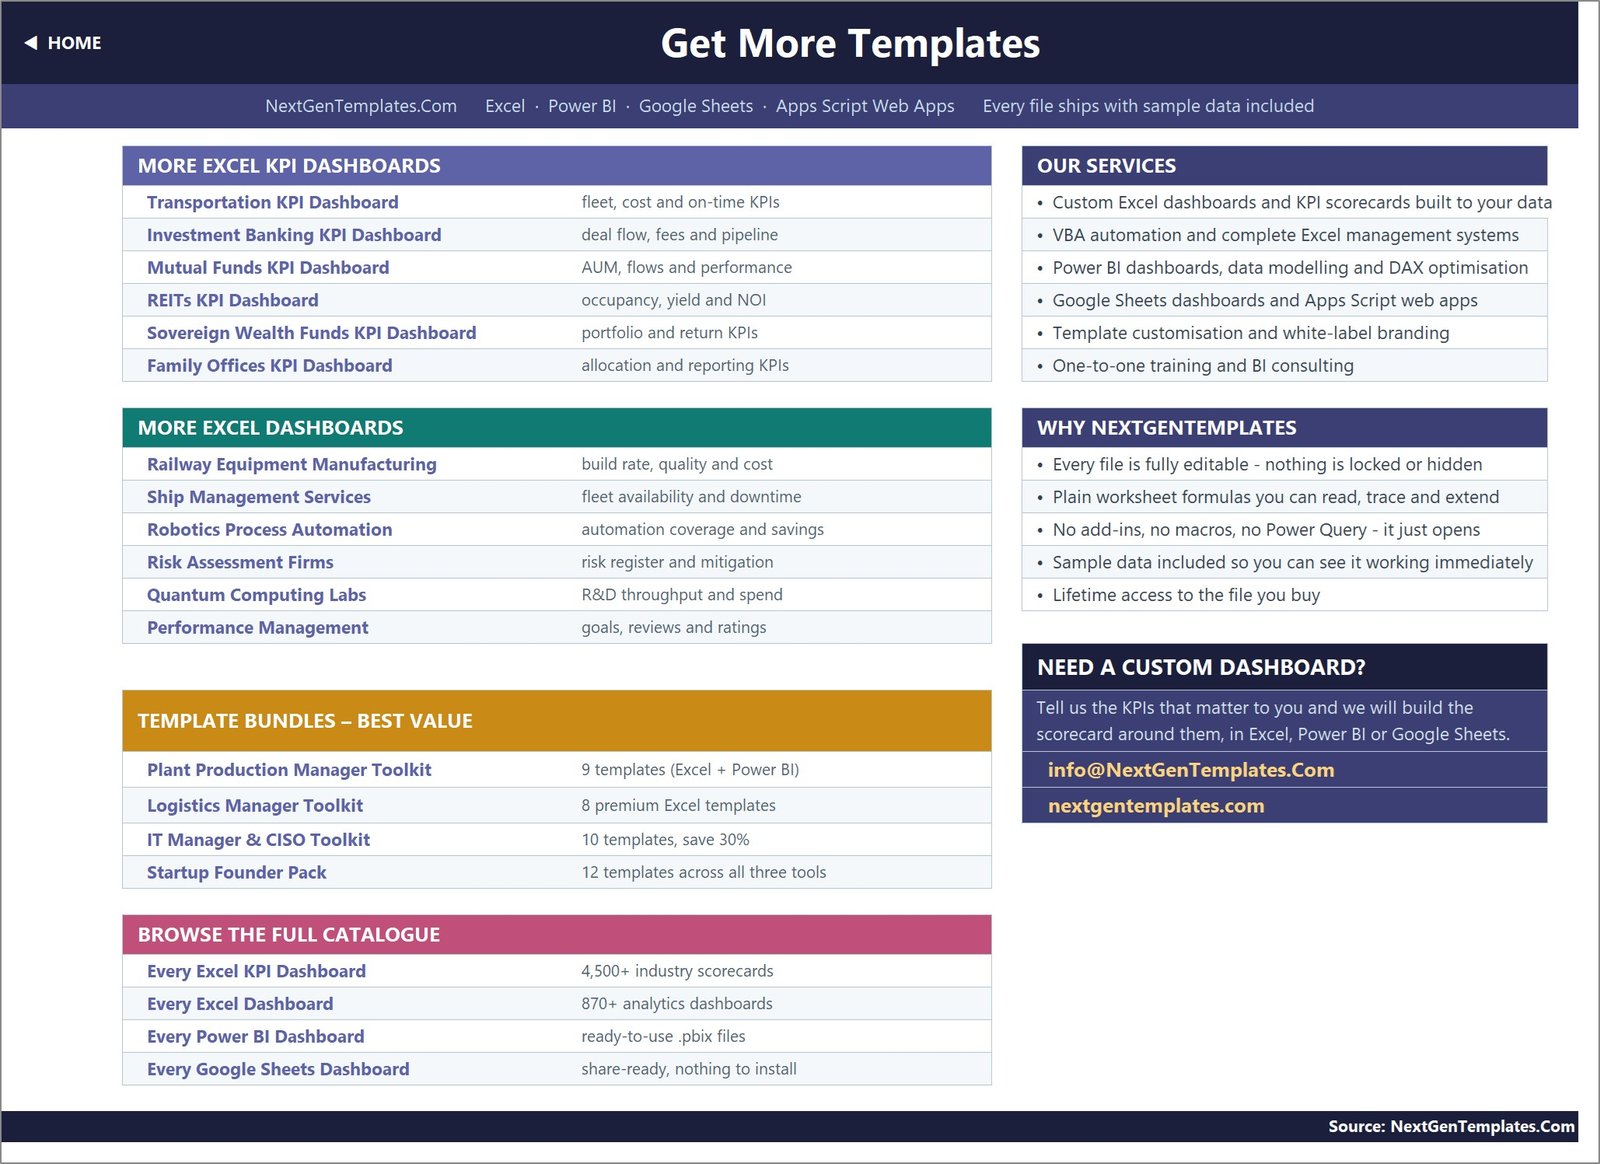
Get More Templates
The final worksheet links to related templates, service options and the broader NextGenTemplates catalogue.
WealthTech KPI Dashboard in Excel vs. Google Sheets vs. Paid Wealth Management SaaS – Where This Fits
| Consideration | This Excel template | Google Sheets alternative | Paid wealth-management SaaS |
|---|---|---|---|
| Cost | $12.99 sale price, one time | Build or migrate manually | Vendor pricing and recurring fees |
| Platform | Microsoft Excel | Browser spreadsheet | Vendor-hosted application |
| Setup | Replace sample KPI definitions and monthly values | Rebuild formulas, formatting and charts | Implementation and data mapping |
| Team collaboration | Share through OneDrive or SharePoint | Native link sharing | Role-based collaboration varies |
| Live integrations | No | No unless separately built | May be available |
| Custom KPI definitions | Yes, up to 22 rows in the supplied structure | Yes, if built | Depends on vendor schema |
| Year-1 cost at 5 users | $12.99 for the file | Spreadsheet plan and build time | Vendor quote |
| Portfolio accounting or trading | No | No | May be available |
Who This Template Is For – and Who It’s Not For
Best for: WealthTech operations leads, digital onboarding managers, client-experience teams, platform leaders, advisory operations teams and finance analysts who already have monthly KPI values and need a consistent management scorecard.
Not for: live portfolio valuation, securities research, client suitability, trade execution, performance attribution, custody reconciliation, regulatory reporting, audit evidence or compliance with SEC, FINRA, FCA, MiFID II, SEBI or any other regime.
How to Use the WealthTech KPI Dashboard in Excel
- Open the downloaded workbook and review the Read Me sheet.
- Replace the sample master list on KPI Definition with your approved KPIs, units, owners and UTB/LTB types.
- Enter current-year actuals, targets and prior-year values month by month.
- Select the reporting month on KPI Dashboard and review status and year-over-year movement.
- Select individual KPIs on KPI Trend and use KPI Analysis for group and exception reviews.
- Validate every formula definition and input against your source systems before decisions or distribution.
Real-World Use Cases
Maya, a digital onboarding lead, tracks account-opening rate, onboarding time and time to fund, then uses the bottom-five list to focus her monthly improvement meeting.
Daniel, a platform operations manager, compares uptime and automation adoption against targets while keeping the source data in approved internal systems.
Priya, a client-experience analyst, summarizes retention, NPS and portal activity for management without exposing client-level records in the dashboard.
Frequently Asked Questions
Does this workbook connect to a CRM, broker, bank or custodian?
No. You enter summarized KPI values manually. There are no APIs, queries or data connectors.
Does it calculate investment performance or recommend investments?
No. It is a management reporting template, not investment advice, portfolio accounting or a return-calculation engine.
How many KPIs can I track?
The supplied structure has 22 live rows, with 14 sample KPIs populated. Going beyond 22 requires extending formulas and helper ranges.
Are macros required?
No. The workbook uses worksheet formulas and dropdowns, with no VBA macros or add-ins.
Can I change the KPIs and groups?
Yes. Edit the KPI Definition master list, then add the matching monthly values in the three input sheets.
Can this prove regulatory compliance?
No. It does not create filings, test controls or provide evidence of compliance with financial-services regulations.
Is the included data real?
No. The displayed figures are sample data for demonstration and must be replaced and validated.
About the Author
Built by PK – Microsoft Certified Professional with 15+ years of Excel, Google Sheets, and Power BI experience. Founder of NextGenTemplates, reaching 300K+ subscribers across YouTube channels. Every template is hand-built and tested before release.
Explore Related Templates
- Wealth Tech Dashboard in Excel for analytical views beyond the KPI scorecard format.
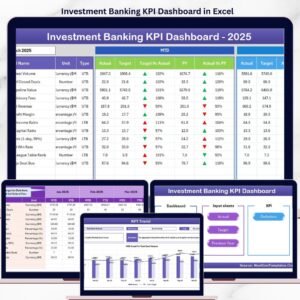
- Investment Banking KPI Dashboard in Excel.
- Mutual Funds KPI Dashboard in Excel.
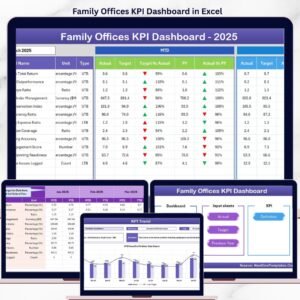
- Family Offices KPI Dashboard in Excel.
- Browse all Excel KPI Dashboards and Excel Financial Tools.
Read the detailed WealthTech KPI Dashboard guide
Ready to replace scattered KPI updates with one consistent scorecard? Download the WealthTech KPI Dashboard in Excel and adapt the sample master list to your reporting process.
Last updated: August 18, 2026.








Reviews
There are no reviews yet.