

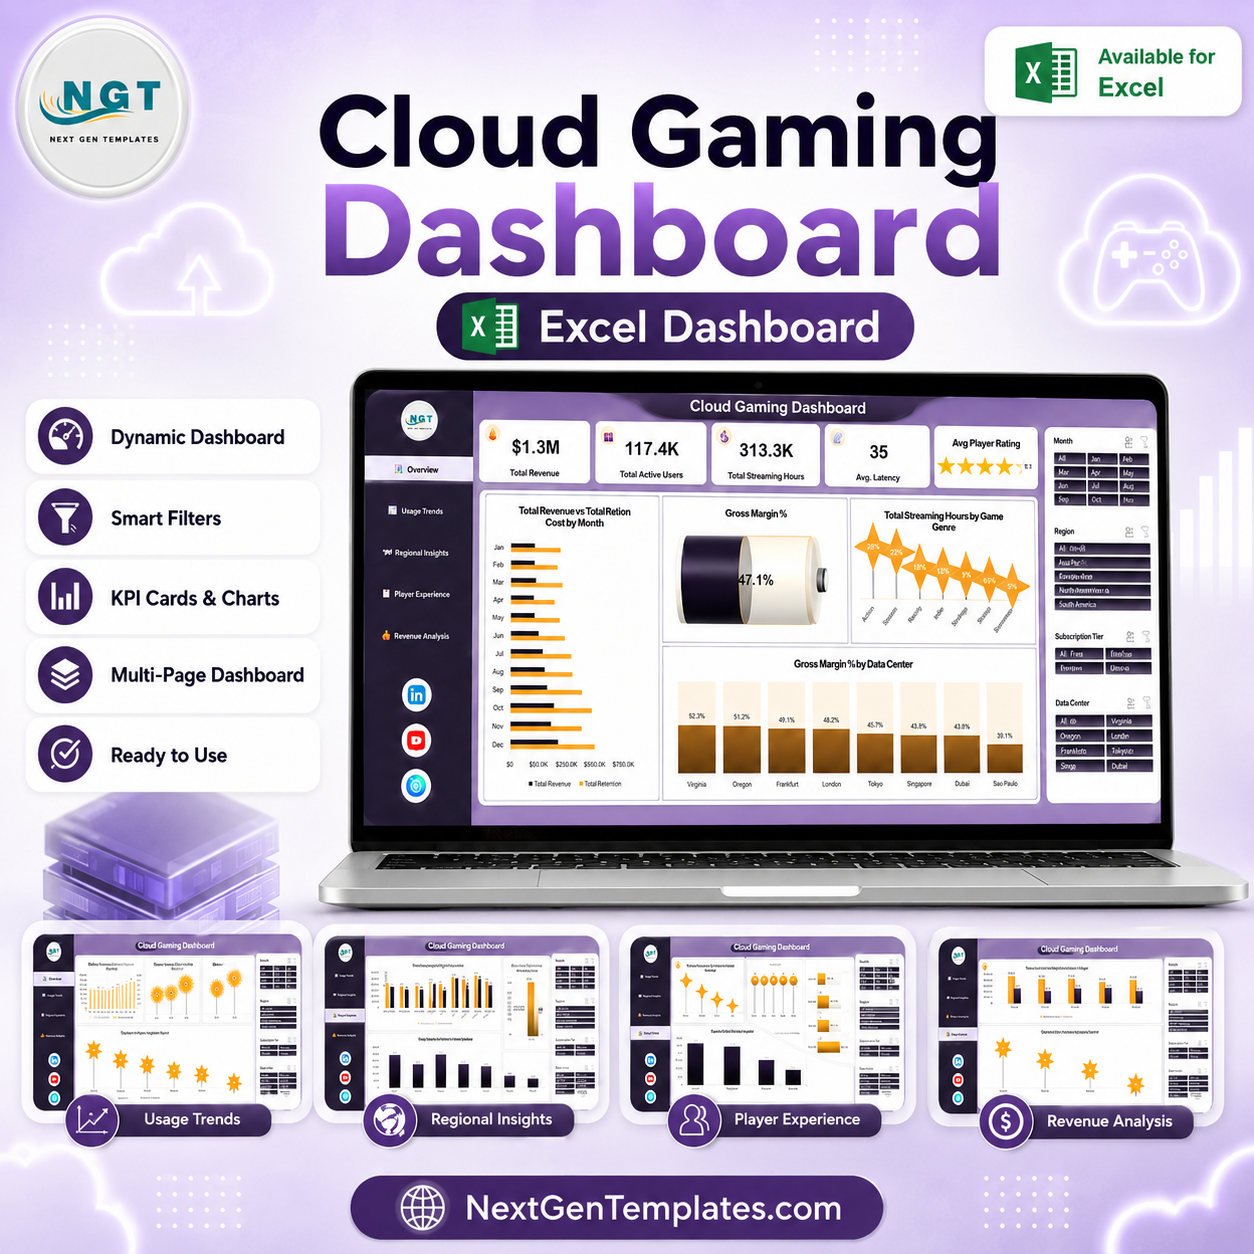
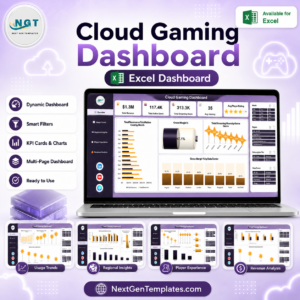
A Cloud Gaming Dashboard in Excel that turns your own subscription, session and billing exports into five linked reporting pages – 19 pivot-driven charts, 5 KPI cards and 4 synced slicers (Month, Region, Subscription Tier, Data Center) that filter every page at once. It ships with 500 rows of fictional demo data so you can see the layout working before you paste a single record of your own. Built and hand-tested by PK, a Microsoft Certified Professional with 15+ years in Excel, Google Sheets and Power BI, and downloaded across a catalogue that reaches 300K+ subscribers. No add-ins, no macros, no subscription. If the workbook does not open on your machine, reply to your order email and we will make it right.
Important: this is a reporting template for data you already hold. It does not connect to any gaming platform, does not measure latency or stream quality on its own, and makes no claim about how any real service performs. Every figure you see in the screenshots is demo data.
Key Features of the Cloud Gaming Dashboard in Excel
- Five pages, one click apart. A left-hand navigation rail links Overview, Usage Trends, Regional Insights, Player Experience and Revenue Analysis so nobody has to hunt through sheet tabs.
- Slicers that stay in sync. The same four slicers – Month, Region, Subscription Tier and Data Center – appear on all five pages and are connected to every pivot, so filtering to Europe, Ultimate, Q4 once reshapes the whole report.
- Pivot tables underneath everything. Charts read from pivot tables on a Support sheet rather than from hard-coded ranges, which is why adding six months of new rows and hitting Refresh All is all the maintenance this workbook needs.
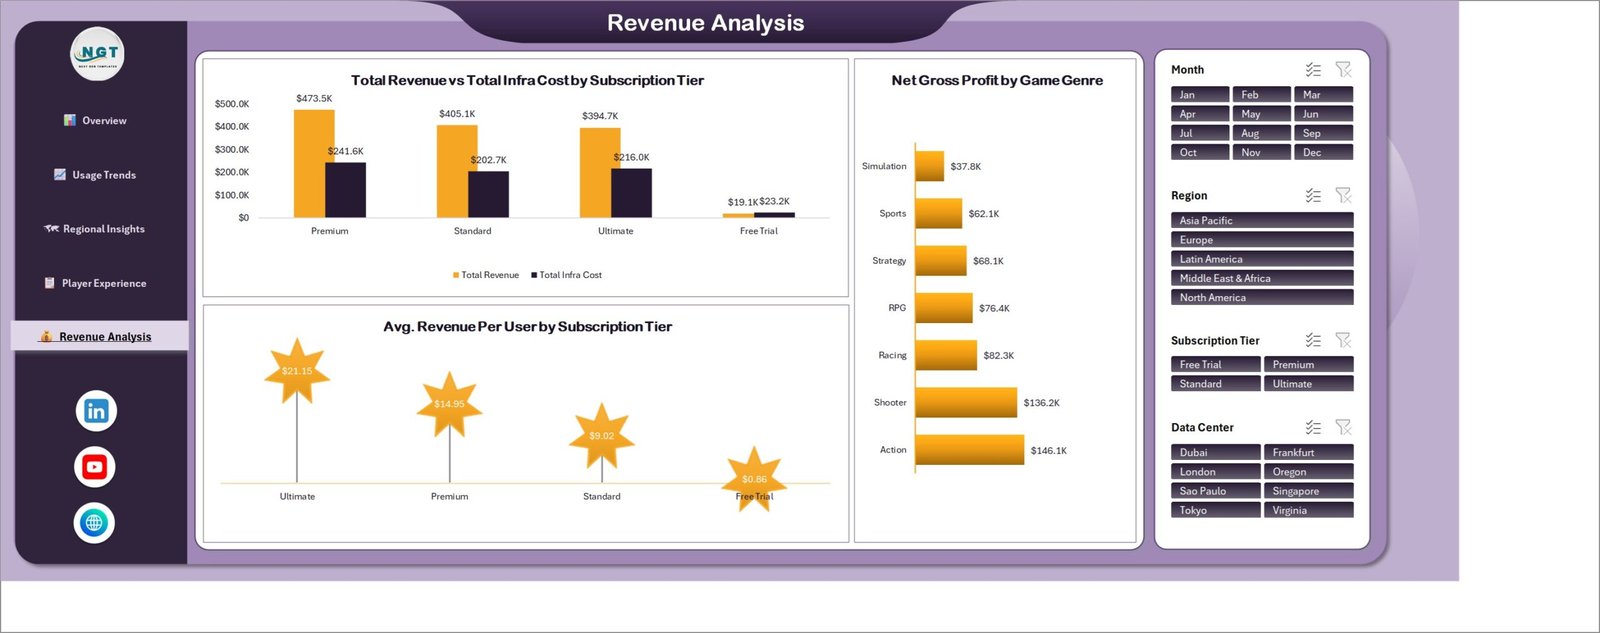
- Cost sits next to revenue. Three separate paired charts compare Total Revenue against Total Infra Cost – by month, by region and by subscription tier – so a growing top line and a growing cost line are visible in the same frame.
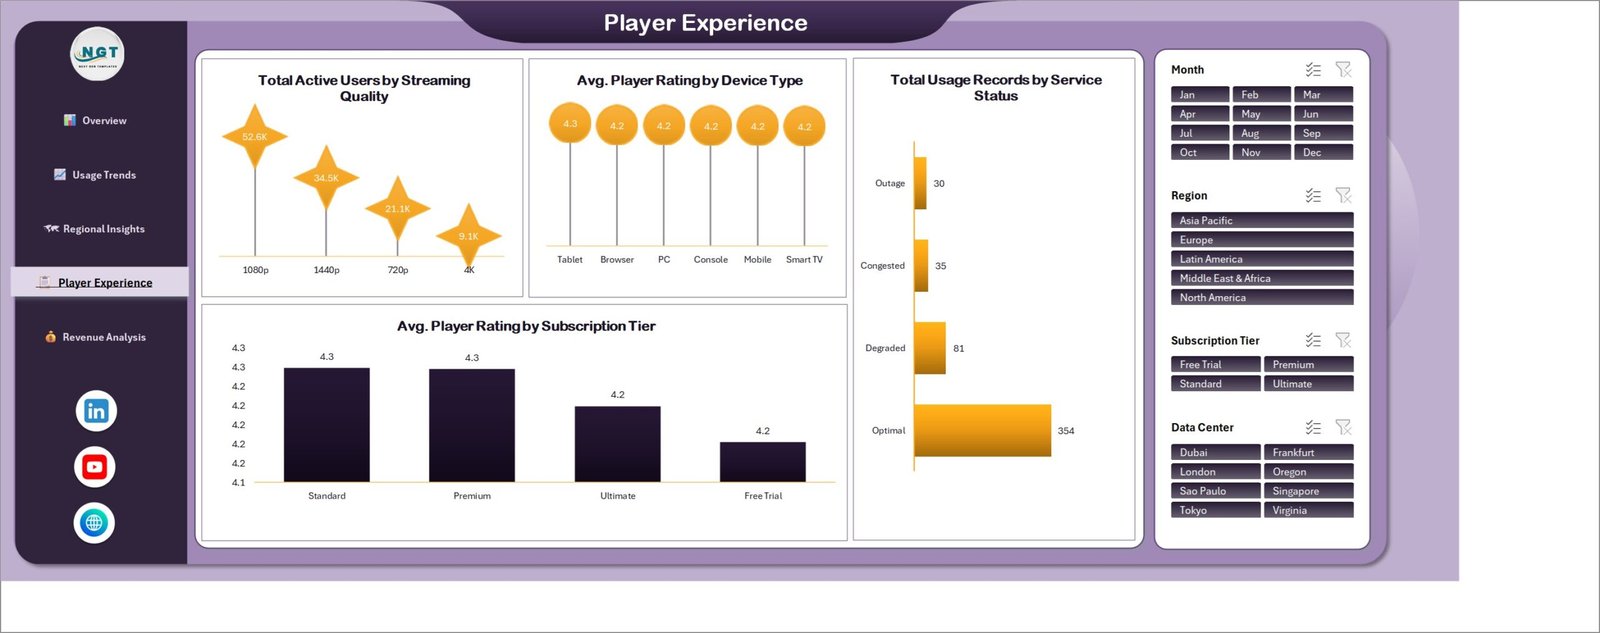
- Player-side metrics, not just money. Avg. Player Rating by Device Type, Avg. Player Rating by Subscription Tier and Total Usage Records by Service Status give the experience side of the story its own page.
- Unit economics. Avg. Revenue Per User by Subscription Tier and Net Gross Profit by Game Genre are calculated from your figures, not typed in.
- Nothing to install. One .xlsx file. It works offline, in Excel 2016 and later, and there is no VBA in it.
What’s Inside the Cloud Gaming Dashboard in Excel
Overview
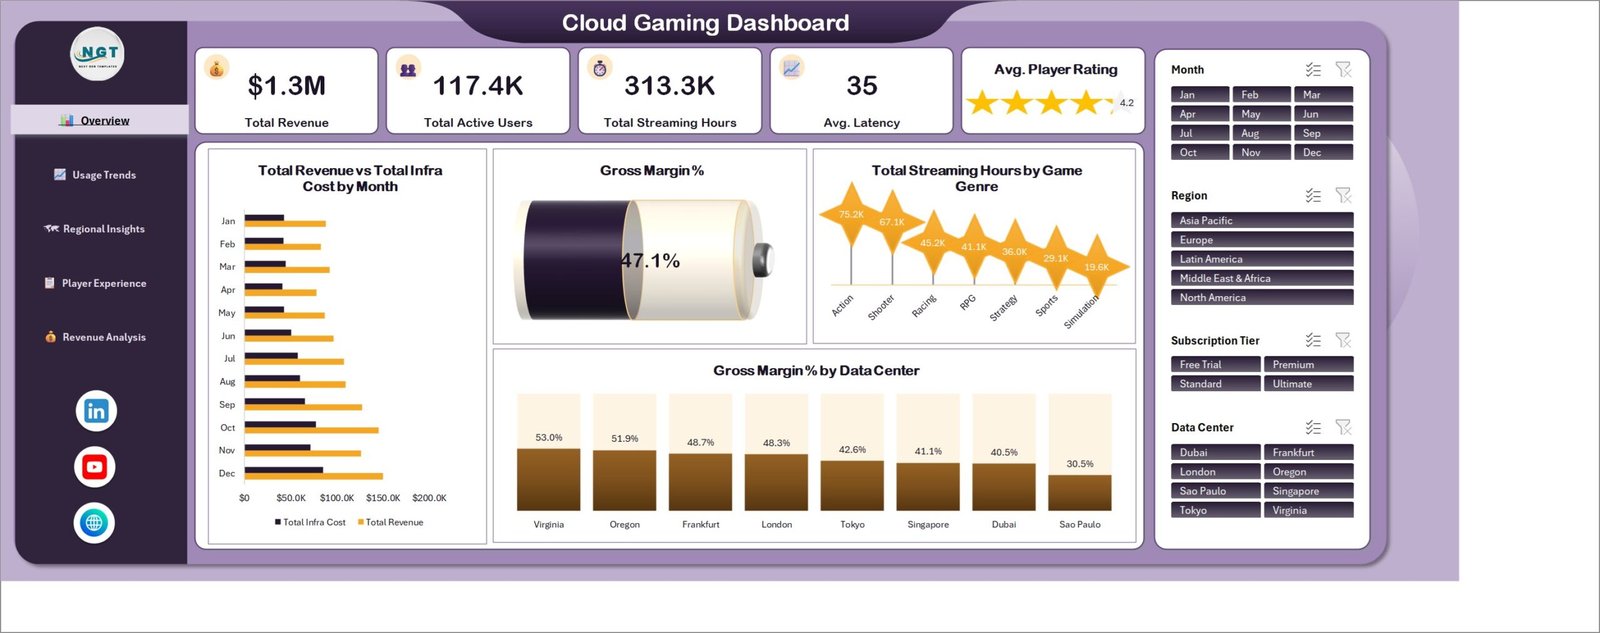
The landing page. Five KPI cards run across the top – Total Revenue, Total Active Users, Total Streaming Hours, Avg. Latency and Avg. Player Rating (shown as a star card). Below them sit Total Revenue vs Total Infra Cost by Month, a Gross Margin % dial, Total Streaming Hours by Game Genre and Gross Margin % by Data Center. In the demo file the Genre split runs from Action at the top down to Simulation, and margin varies visibly across the eight demo data centers.
Usage Trends
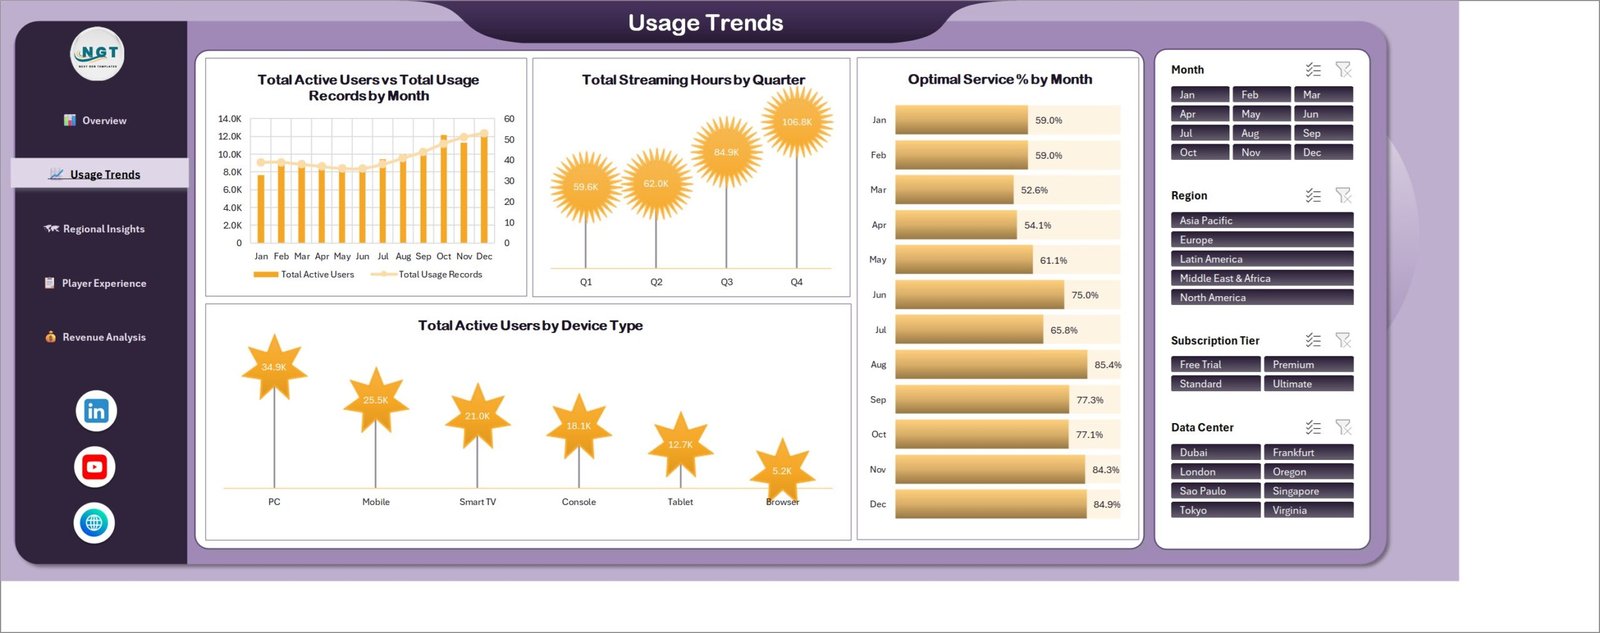
The time-series page. Total Active Users vs Total Usage Records by Month puts a column series and a line series on twin axes so volume and engagement can be read together. Beside it, Total Streaming Hours by Quarter rolls the same data up to Q1-Q4, Optimal Service % by Month gives a month-by-month bar of how much of your logged usage was recorded as optimal, and Total Active Users by Device Type ranks PC, Mobile, Smart TV, Console, Tablet and Browser.
Regional Insights
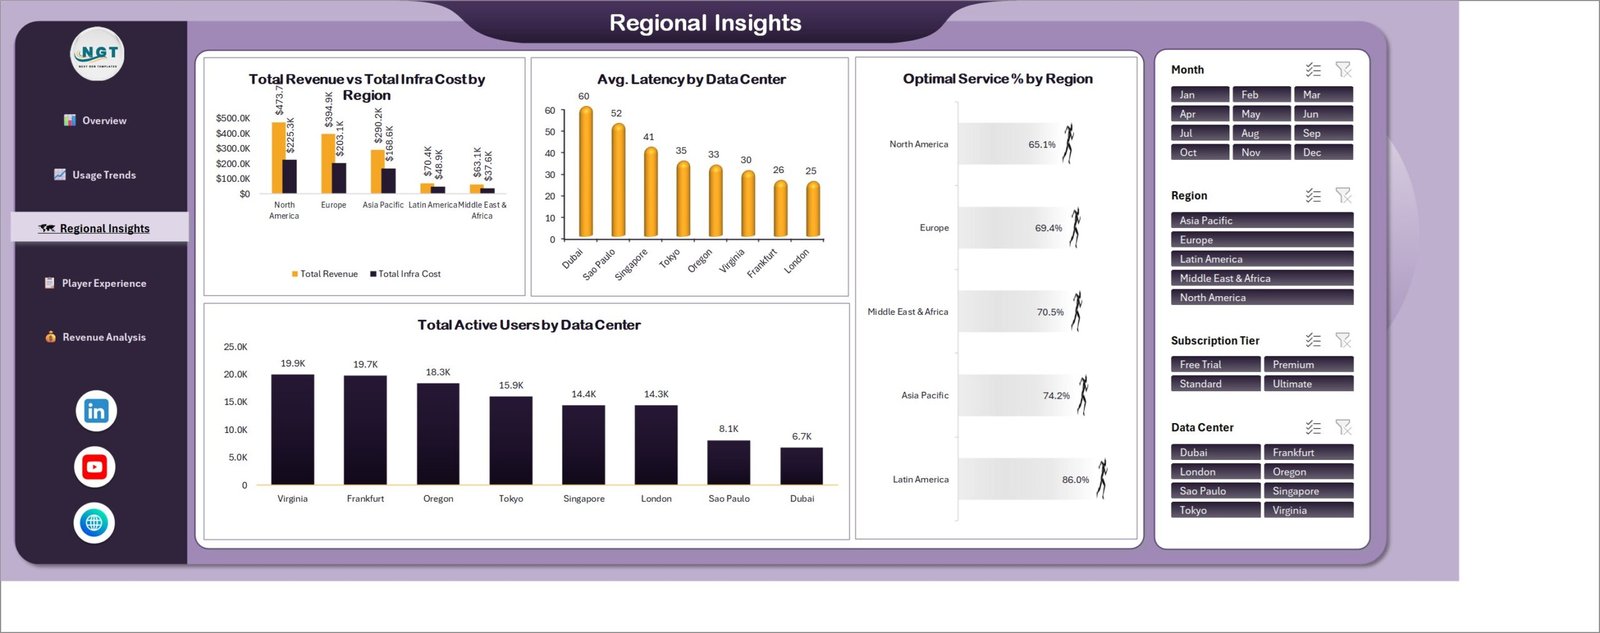
Geography and infrastructure. Total Revenue vs Total Infra Cost by Region pairs the two money series across five demo regions; Avg. Latency by Data Center ranks your eight demo sites; Optimal Service % by Region and Total Active Users by Data Center complete the page. The latency figures here are whatever you record in your own data – the template charts them, it does not measure them.
Player Experience
The quality page. Total Active Users by Streaming Quality splits users across 720p, 1080p, 1440p and 4K; Avg. Player Rating by Device Type and Avg. Player Rating by Subscription Tier show whether the rating you collect moves with hardware or with plan; and Total Usage Records by Service Status counts your sessions across Optimal, Degraded, Congested and Outage labels. Those status labels are columns in your data – you decide what they mean.
Revenue Analysis
The commercial page. Total Revenue vs Total Infra Cost by Subscription Tier lines the four demo plans up side by side, Net Gross Profit by Game Genre ranks the seven demo genres, and Avg. Revenue Per User by Subscription Tier gives a per-user figure for each plan. In the demo data the Free Trial tier costs more to serve than it earns, which is exactly the kind of thing this page is meant to surface in your own numbers.
Data and Support sheets
Behind the five pages sit a flat Data sheet – the 500 demo rows you replace – and a Support sheet holding every pivot table. You only ever type on Data.
Cloud Gaming Dashboard in Excel vs. Google Sheets vs. a Paid Analytics SaaS – Where This Fits
| This template (Excel) | Google Sheets equivalent | Paid analytics SaaS | |
|---|---|---|---|
| Cost | One payment, 17.99 | One payment, ~9.99 | Typically 50-300 per user / month |
| Platform | Excel 2016+ / Microsoft 365, offline | Browser, Google account | Browser, vendor cloud |
| Setup time | Paste your data, Refresh All – about 15 minutes | Copy the file, paste data – about 15 minutes | Days to weeks (connectors, modelling, onboarding) |
| Real-time team collaboration | Via OneDrive / SharePoint co-authoring | Yes, native | Yes, native |
| Mobile access | Excel mobile app (view and light edit) | Sheets mobile app | Vendor mobile app |
| Customizable fields | Full – it is your workbook | Full | Only what the vendor exposes |
| Share with link | Yes, once stored in OneDrive | Yes | Yes |
| Year-1 cost at 5 users | 17.99 total | ~9.99 total | 3,000-18,000 |
| Live platform connection | No – you paste exports | No | Yes, via connectors |
| You own the file forever | Yes | Yes | No – access ends with the subscription |
Who This Template Is For – and Who It’s Not For
A good fit if you run or analyse a cloud gaming, game streaming or subscription entertainment service and already export session, subscription and billing data to CSV or Excel; if you need a monthly management pack rather than a live monitoring wall; if you want the file to stay yours with no seat licence; or if you are a consultant or analyst who needs a presentable starting layout instead of a blank workbook.
Not a good fit if you need a live feed from your platform – this template has no connectors and never calls an API. It is not a network monitoring tool: it charts the latency and service-status values you record, it does not measure them. It is not a billing system, a player-support desk, or a content-licensing tracker. It will not tell you how any named streaming service performs, and it is not a benchmark of the industry. And if your dataset runs to millions of session rows, load it into Power BI instead – Excel pivots will feel slow long before that point.
How to Use the Cloud Gaming Dashboard in Excel
- Unzip and open. One .xlsx file, Excel 2016 or later. Click Enable Editing.
- Look around first. Click through the five pages with the demo data still in place so you can see what each chart expects.
- Replace the Data sheet. Delete the 500 demo rows and paste your own, keeping the column headers exactly as they are. Match the dimension spellings you want to see on the axes.
- Refresh. Data > Refresh All. Every pivot, chart and KPI card updates together.
- Filter. Use the Month, Region, Subscription Tier and Data Center slicers on any page – the other four pages follow.
- Share it. Save to OneDrive or SharePoint for co-authoring, or export the pages to PDF for a monthly pack.
Real-World Use Cases
Priya, subscriptions analyst at a regional game-streaming service. She exports the previous month’s subscription and session tables on the first working day, pastes them into the Data sheet and refreshes. The Revenue Analysis page gives her the ARPU-by-tier slide her finance lead asks for, and the Free Trial column is the one she gets questioned about every month.
Daniel, infrastructure lead. He does not care about revenue. He filters to one region and reads Avg. Latency by Data Center and Optimal Service % by Region straight off the Regional Insights page, using his own monitoring exports as the source, then screenshots it into the capacity review.
Meera, an independent consultant. She keeps one copy per client. Because the file is a plain workbook with no add-ins, she can rename the tiers, drop the genre charts a client does not use, and hand the file over at the end of the engagement with nothing left behind.
Frequently Asked Questions
Does this connect to my cloud gaming platform automatically?
No. There are no connectors, no API calls and no internet requirement. You export your data and paste it into the Data sheet. That is deliberate – it keeps the file portable and keeps your data on your machine.
Are the numbers in the screenshots real?
No. Every figure, region, data center and genre in the shipped workbook is fictional demo data generated to fill the layout. Any platform or brand name that appears in sample columns is placeholder text, not a statement about that company. Nothing in this file should be read as a measurement of any real service.
Does it measure latency or stream quality?
No. The Avg. Latency card and the Avg. Latency by Data Center chart display whatever you record in your own data. The template is a reporting layer, not a monitoring agent.
Do I need macros or add-ins enabled?
No. It is a plain .xlsx workbook with pivot tables, pivot charts and slicers. No VBA, no Power Query connectors, nothing to whitelist.
Can I add my own pages or metrics?
Yes. Add a column to the Data sheet, refresh, and build a new pivot on the Support sheet. The existing pages are ordinary Excel objects you can copy, move or delete.
Will it work in Excel for Mac or Excel Online?
It opens and refreshes in Excel for Mac. Excel Online will display the pages, but slicer behaviour and some chart formatting are limited in the browser, so the desktop app is recommended for editing.
What exactly do I get in the download?
A single zip containing the .xlsx workbook with all five dashboard pages, the Data sheet and the Support sheet. Unlimited re-downloads and free minor updates.
About the Author
Built by PK – Microsoft Certified Professional with 15+ years of Excel, Google Sheets, and Power BI experience. Founder of NextGenTemplates, reaching 300K+ subscribers across YouTube channels. Every template is hand-built and tested before release.
Explore Related Templates
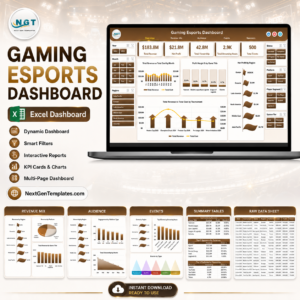
- Gaming Esports Dashboard in Excel – tournament, team and viewership reporting in the same pivot-and-slicer style.
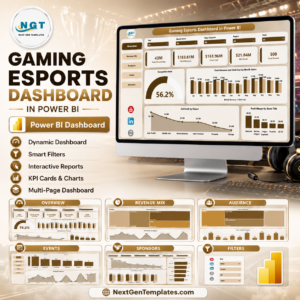
- Gaming Esports Dashboard in Power BI – the Power BI build, for larger datasets.
- Gaming KPI Scorecard in Google Sheets – a monthly scorecard rather than an analytics dashboard.
- Gaming Console KPI Dashboard in Google Sheets – hardware-side KPIs.
- Board Game Startups Dashboard in Power BI – an adjacent games-industry build.
Browse more in Excel Dashboards or the full MS Excel catalogue.
Download the Cloud Gaming Dashboard in Excel now – one payment, lifetime access, unlimited re-downloads, and free minor updates. Read the full walkthrough on the Cloud Gaming Dashboard in Excel blog post.
Last updated: 17 August 2026.




























Reviews
There are no reviews yet.