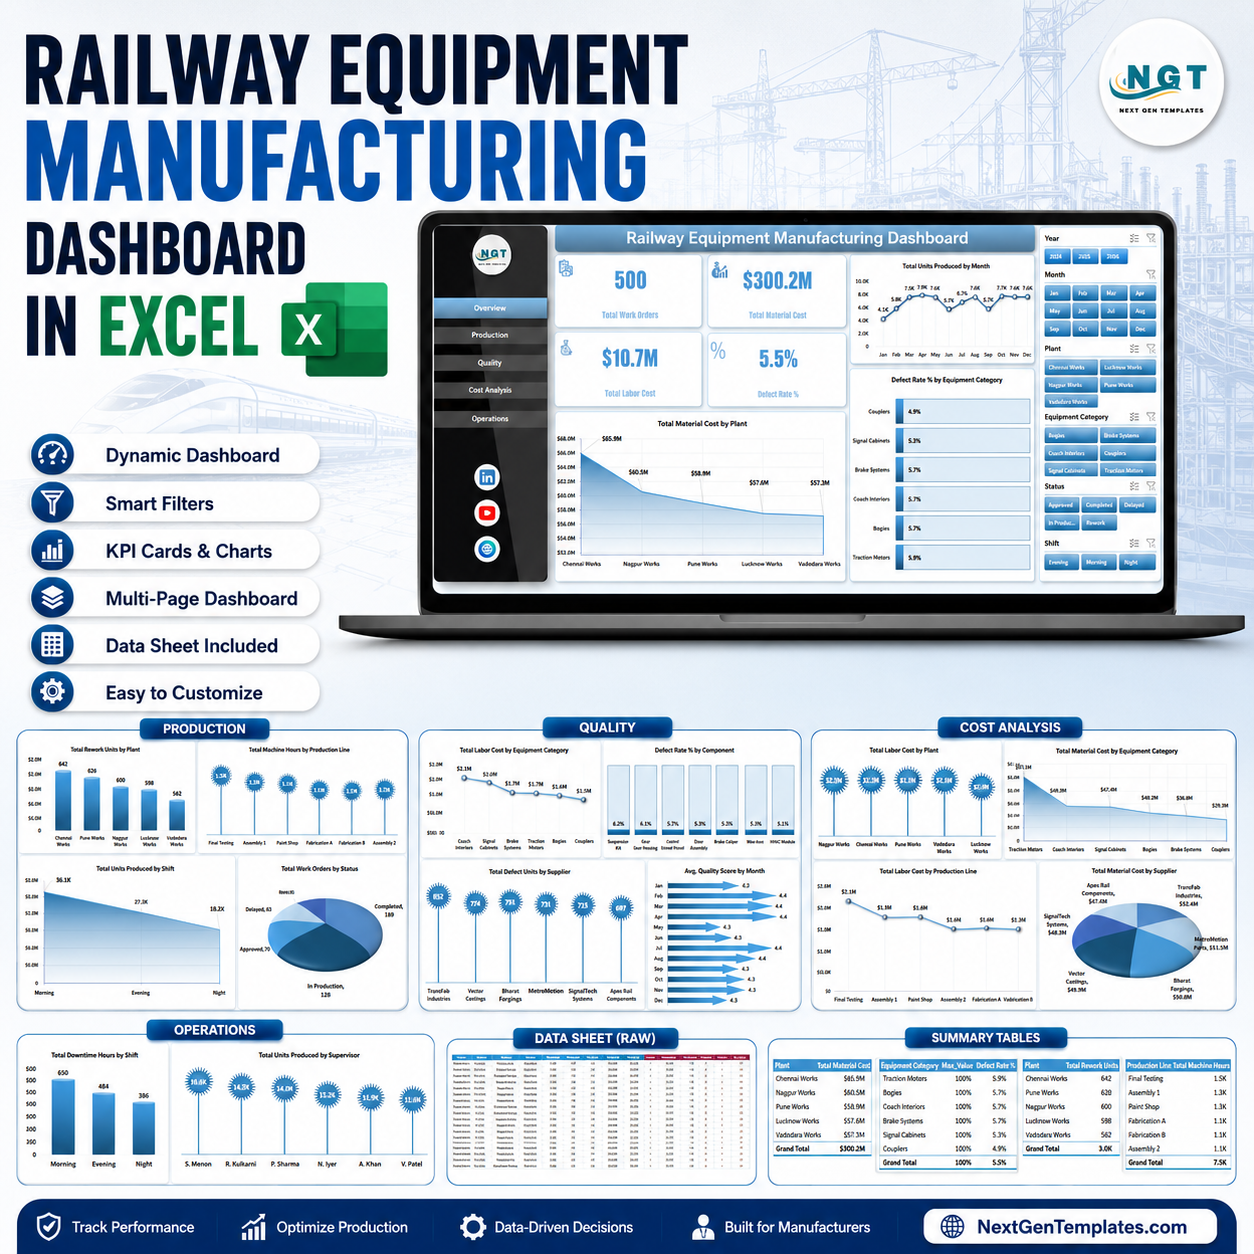


Last updated: July 31, 2026. Railway equipment manufacturers work with hundreds or thousands of work orders, material lines, labor hours, defects, suppliers, plants, shifts, and supervisors every month. The Railway Equipment Manufacturing Dashboard in Excel turns that production data into 7 ready-to-use Excel sheets with 4 executive KPI cards, 18 focused charts, slicers, a structured data sheet, and a support sheet powered by pivot tables. It is an instant download, one-time payment, no subscription, no per-user fee, and fully editable in Microsoft Excel.
Join 8,400+ teams in 40+ countries using NextGenTemplates to replace slow manual reporting with practical Excel, Google Sheets, Power BI, and HTML templates.
Instant download. One-time payment. Editable Excel workbook. Built for manufacturing and operations reporting.
Key Features of Railway Equipment Manufacturing Dashboard in Excel
- 7 Excel sheets covering Overview, Production, Quality, Cost Analysis, Operations, Data, and Support.
- 4 high-level KPI cards for Total Work Orders, Total Material Cost, Total Labor Cost, and Defect Rate %.
- Multiple slicers to filter the dashboard quickly by plant, period, category, supplier, shift, production line, status, and related fields.
- Production analysis for units produced, rework units, machine hours, shifts, work order status, and supervisors.
- Quality tracking for defect rate, defect units, quality score, components, suppliers, and equipment categories.
- Cost analysis views for labor cost and material cost by plant, category, line, and supplier.
- Pivot-powered support sheet keeps the workbook dynamic after users update the data sheet and click Refresh All.
What’s Inside the Railway Equipment Manufacturing Dashboard in Excel
The Overview Page gives leadership a fast view of total work orders, total material cost, total labor cost, and defect rate percentage. These cards help users understand volume, spend, and quality risk before reviewing the detailed pages.
Total Units Produced by Month: Shows monthly production movement so planners can spot demand peaks, capacity pressure, and low-output months. Use it to compare production rhythm across the reporting period.
Total Material Cost by Plant: Compares material spend by manufacturing plant and highlights where component, raw material, or procurement costs are concentrated. This supports plant-level cost review and purchasing conversations.
Defect Rate % by Equipment Category: Identifies which railway equipment categories carry higher quality risk. It helps quality teams focus inspections, supplier checks, and process improvement work where defects are more visible.
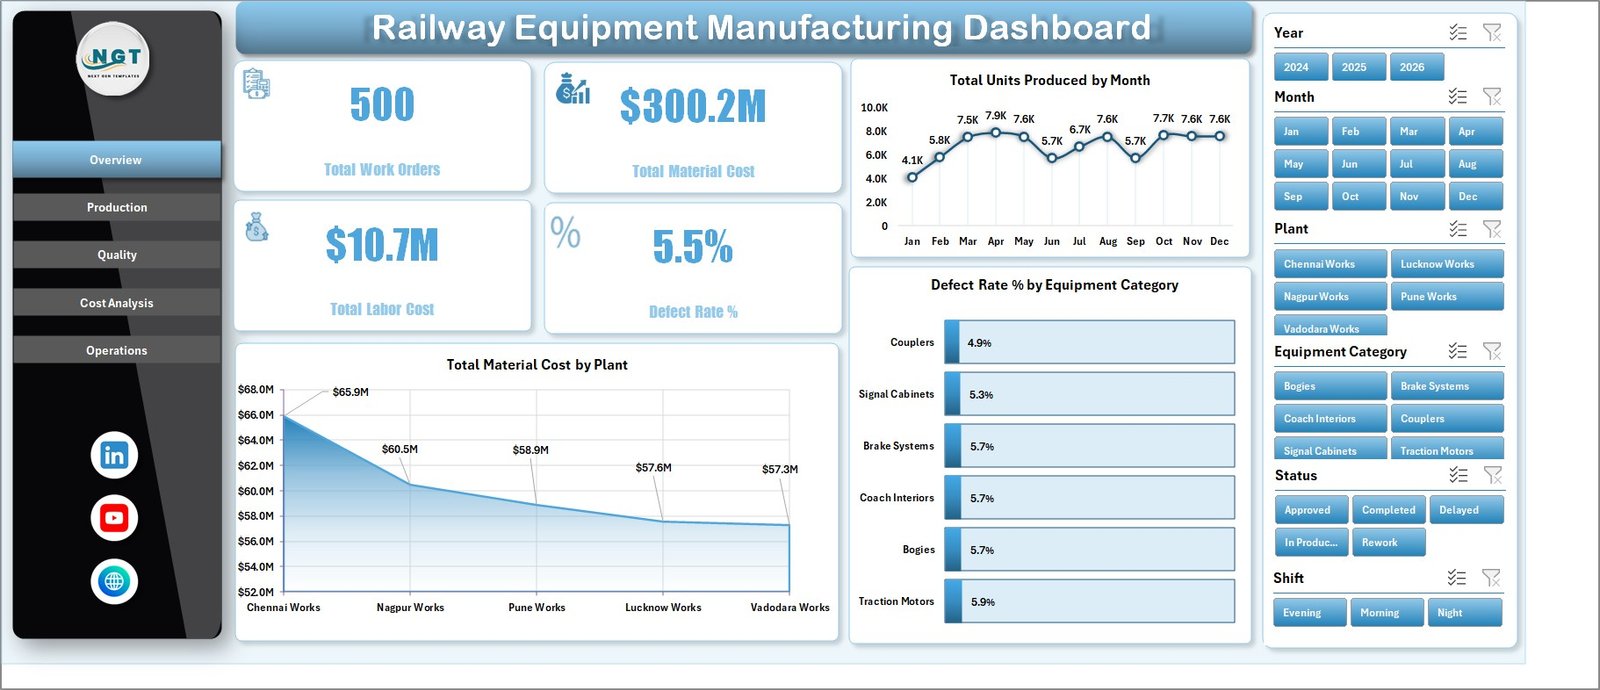
Railway Equipment Manufacturing Dashboard in Excel
Production Sheet
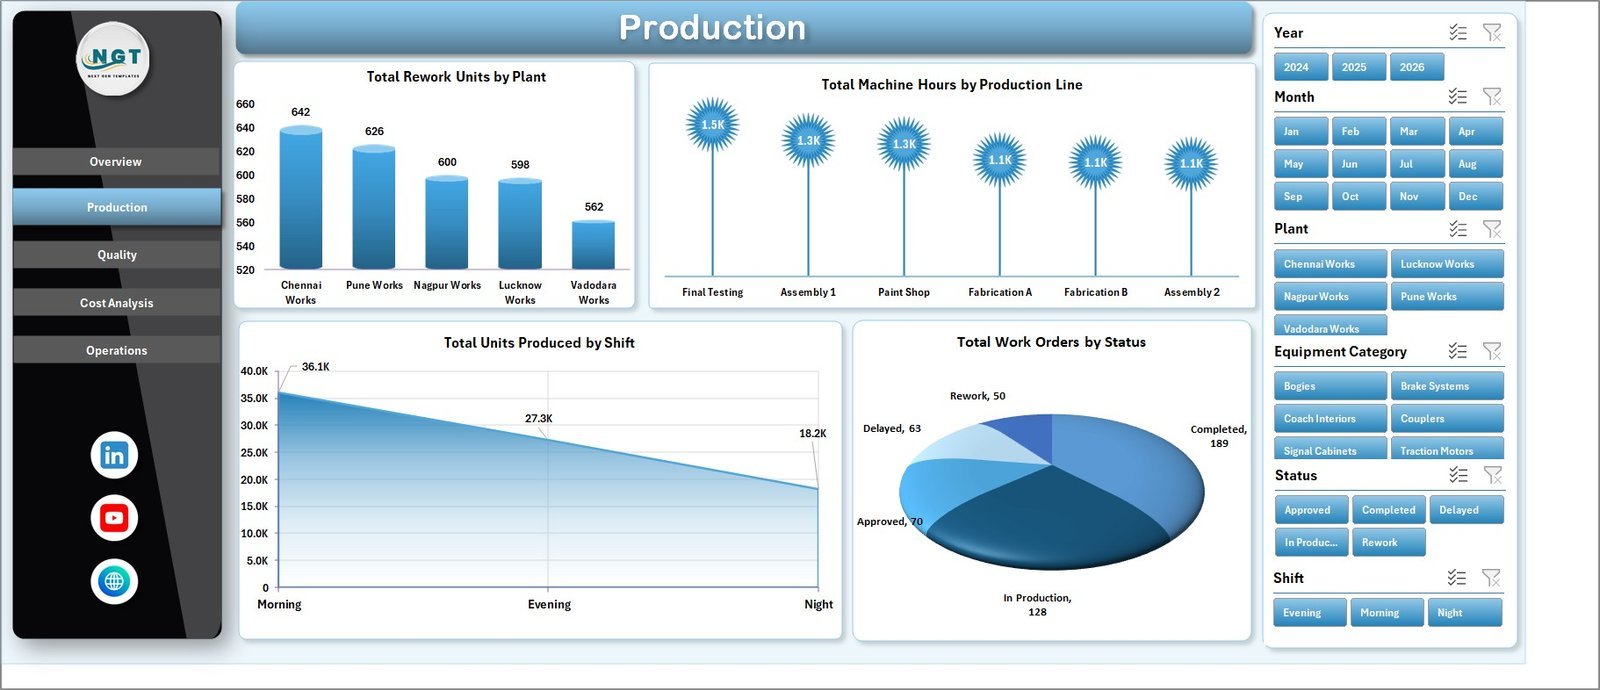
The Production page analyzes Total Rework Units by Plant, Total Machine Hours by Production Line, Total Units Produced by Shift, and Total Work Orders by Status. Production managers can compare plant output, capacity usage, shift performance, and open-versus-completed work order flow in one screen.
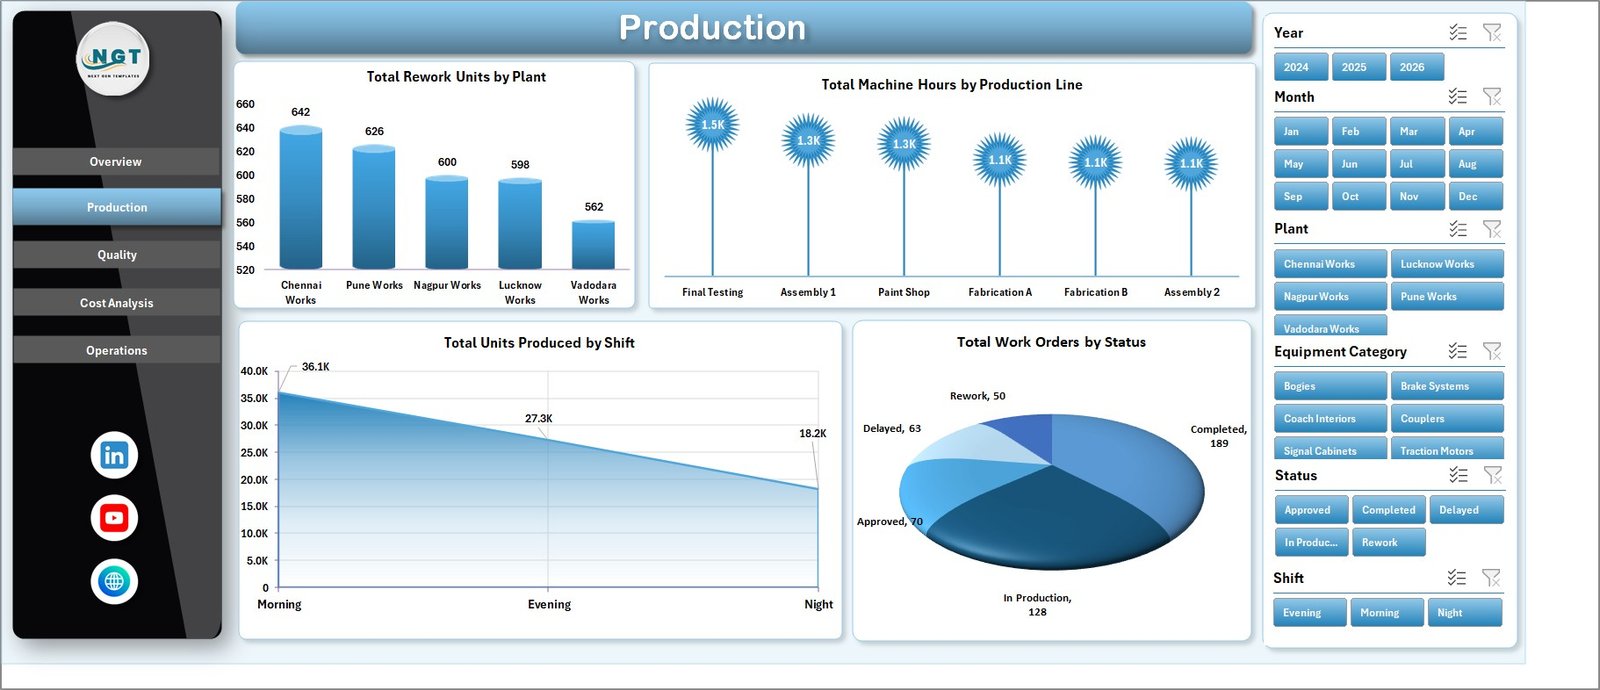
Production
Quality Sheet
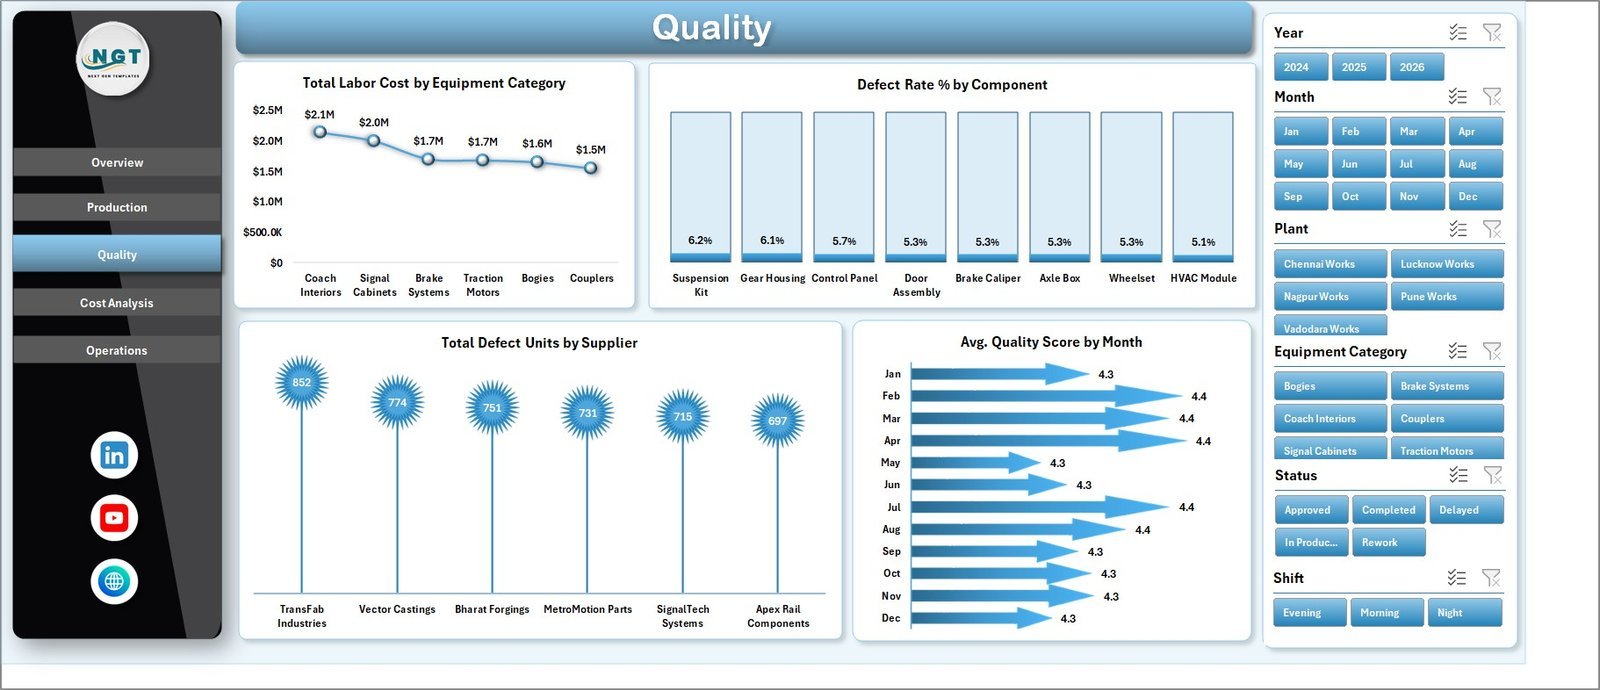
The Quality page includes Total Labor Cost by Equipment Category, Defect Rate % by Component, Total Defect Units by Supplier, and Avg. Quality Score by Month. It connects quality outcomes with cost, supplier performance, component reliability, and monthly quality movement.
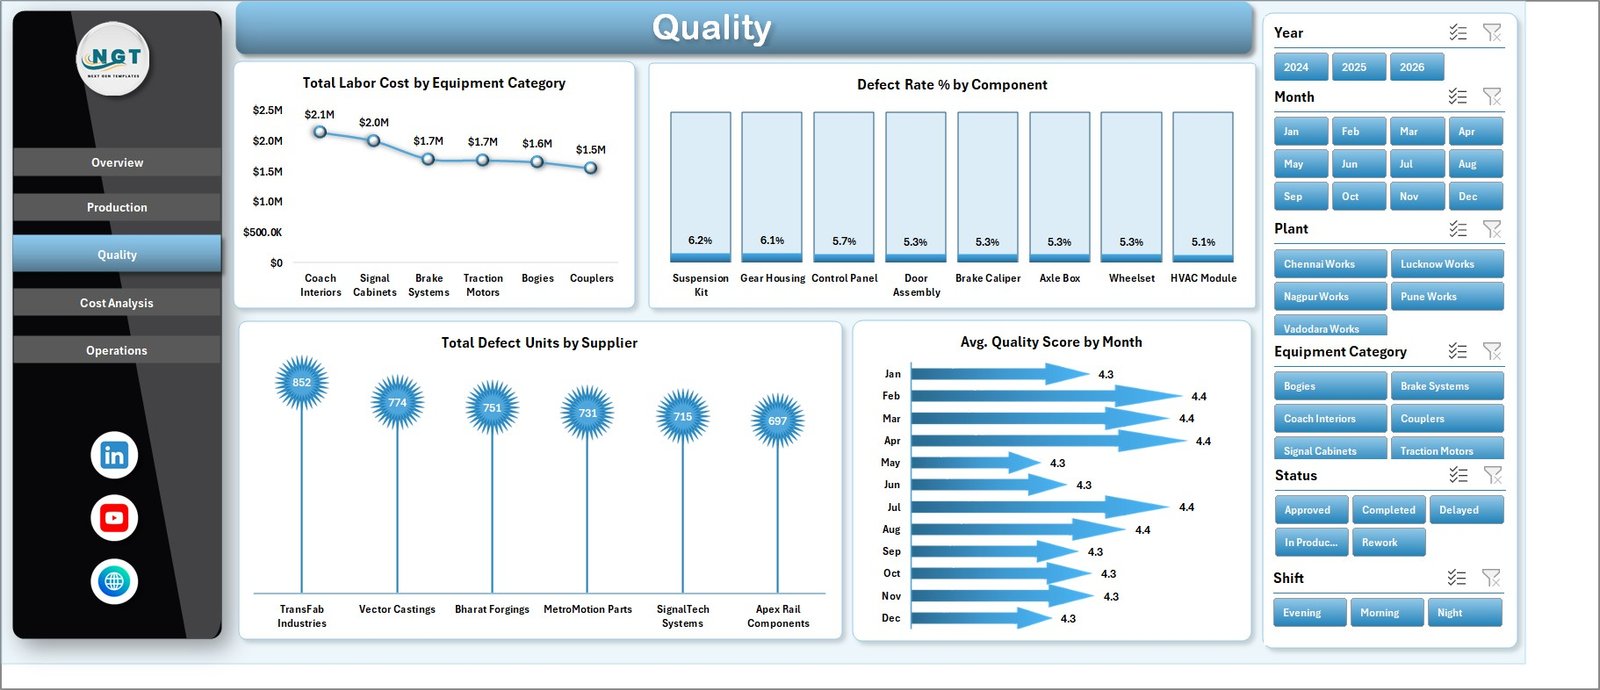
Quality
Cost Analysis Sheet
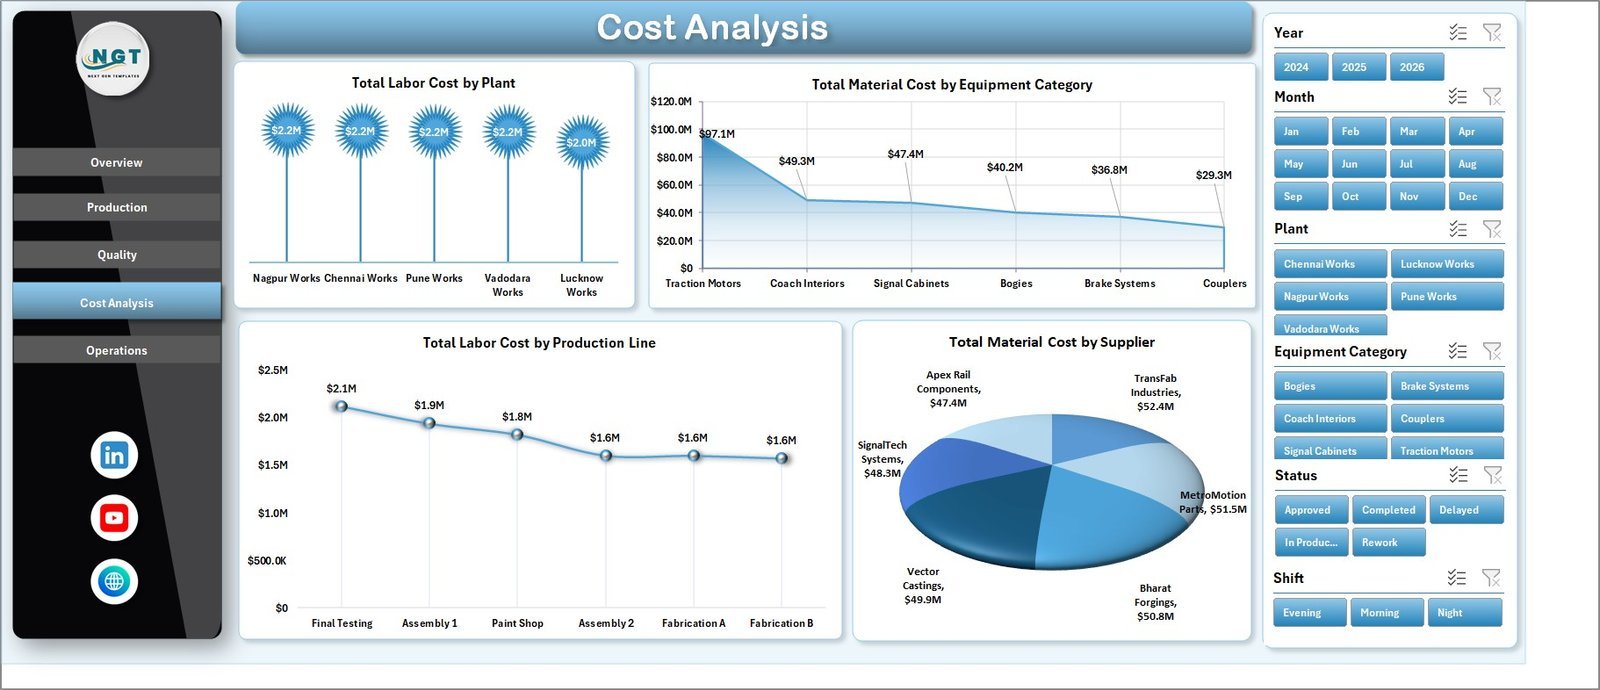
The Cost Analysis page breaks down Total Labor Cost by Plant, Total Material Cost by Equipment Category, Total Labor Cost by Production Line, and Total Material Cost by Supplier. Finance, operations, and procurement teams can see where cost pressure starts and which lines or suppliers need deeper review.
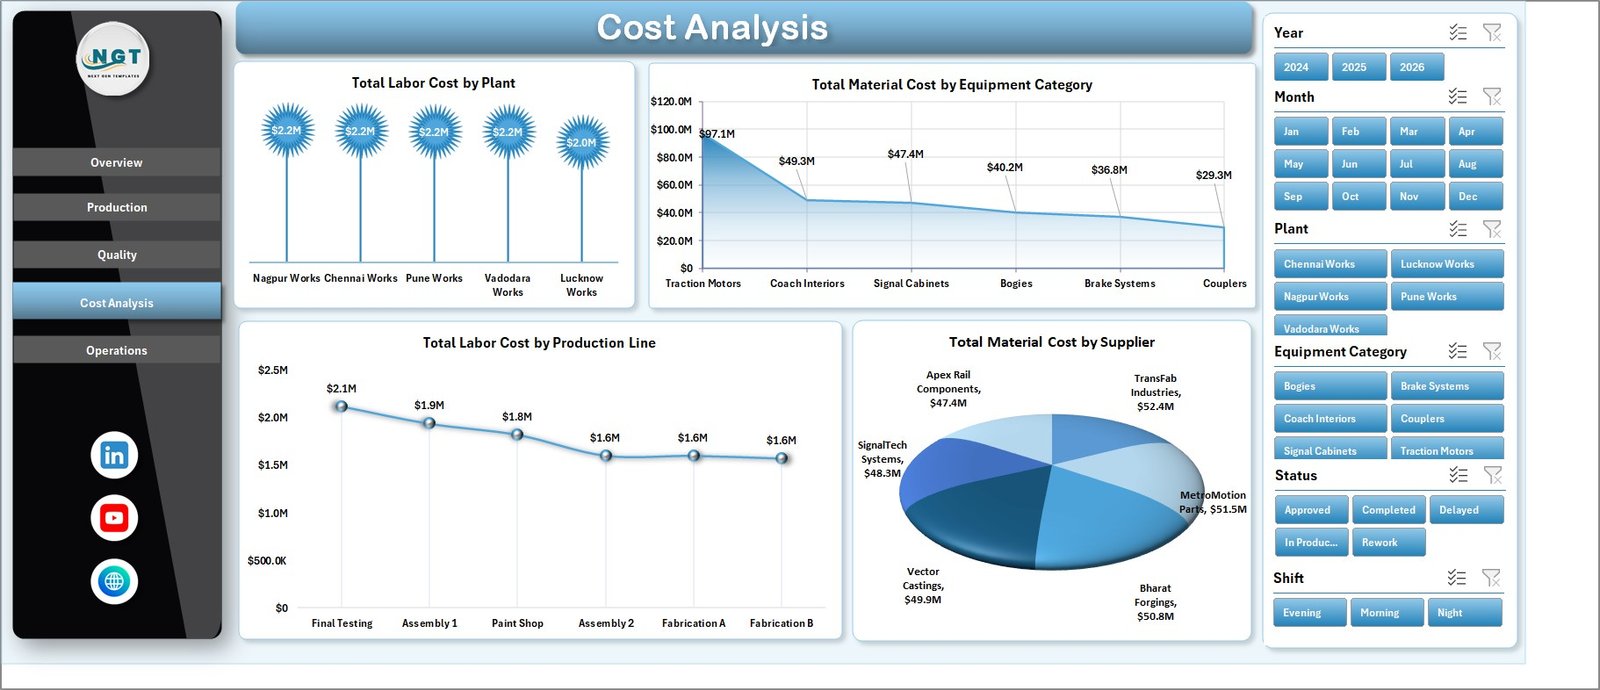
Cost Analysis
Operations Sheet
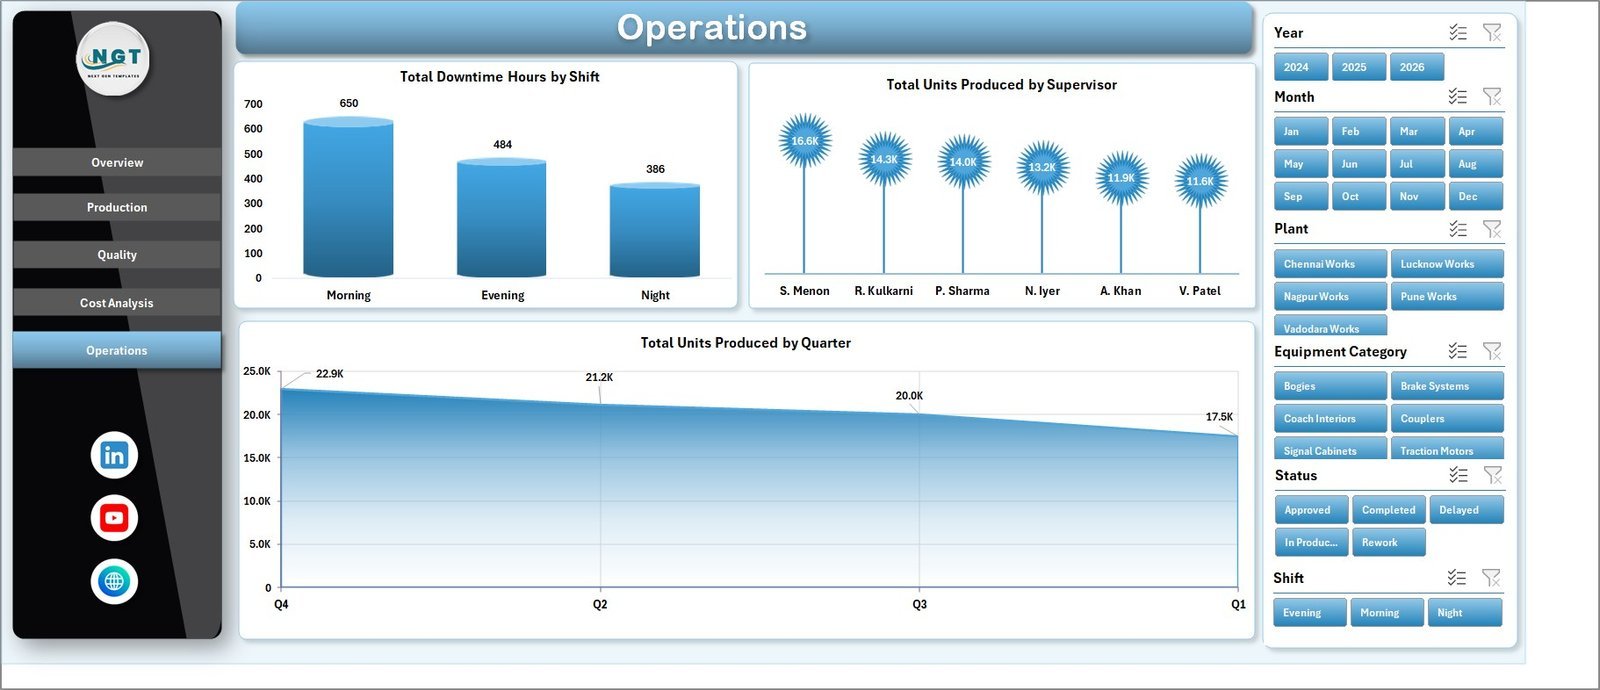
The Operations page tracks Total Downtime Hours by Shift, Total Units Produced by Supervisor, and Total Units Produced by Quarter. This view helps teams connect output with supervision, shift patterns, and quarterly operating performance.
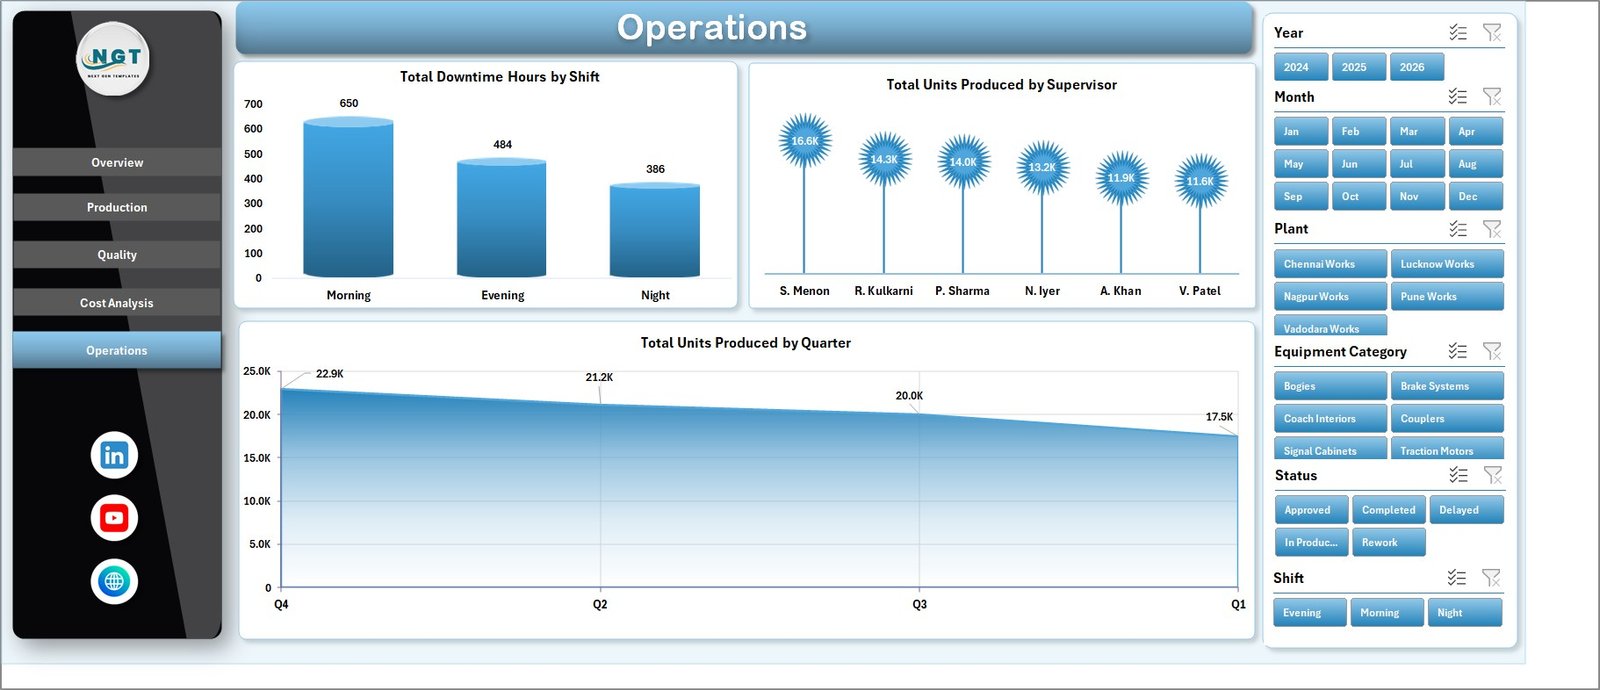
Operations
Data Sheet Tab
The Data sheet is where users add or replace their railway equipment manufacturing records in the same format as the sample data. After the data is updated, the dashboard can be refreshed to reflect the latest production, cost, quality, and operations numbers.

Data Sheet tab
Support Sheet Tab
The Support sheet contains the pivot tables used to build the dynamic dashboard. After updating the Data sheet, go to the Data tab in the Excel Ribbon and click Refresh All. The pivots and charts refresh together, and this sheet can be kept hidden during normal use.

Support sheet tab
Railway Equipment Manufacturing Dashboard in Excel vs. Google Sheets vs. Paid Manufacturing SaaS – Where This Fits
| Feature | This Excel dashboard | Google Sheets alternative | Paid manufacturing SaaS |
|---|---|---|---|
| Cost | $17.99 one-time | Free sheet plus setup time | Monthly or annual subscription |
| Platform | Microsoft Excel | Browser-based spreadsheet | Vendor cloud platform |
| Setup time | Replace data, refresh pivots | Build charts, pivots, and controls | Implementation and onboarding |
| Real-time team collaboration | Available with OneDrive or SharePoint | Native collaboration | Usually included |
| Mobile access | Excel mobile for view or light edits | Google Sheets app | Vendor app or browser |
| Customizable fields | Fully editable workbook | Editable if you build it | Limited by vendor configuration |
| Railway manufacturing metrics | Built around work orders, units, cost, defects, rework, downtime, and suppliers | Requires custom setup | Depends on system fit |
| Year-1 cost at 5 users | $17.99 total | Workspace fees plus build time | Often hundreds or thousands of dollars |
Who This Template Is For – and Who It’s Not For
This template is for production managers, plant heads, quality managers, manufacturing analysts, cost controllers, railway equipment suppliers, supervisors, and operations teams who track structured work order and production data in Excel.
It is not for teams that need live machine sensor integration, ERP write-back, automated approval workflows, barcode scanning, or regulated manufacturing execution controls. For those needs, a full MES, ERP, or quality management system may be the better long-term option.
How to Use the Railway Equipment Manufacturing Dashboard in Excel
- Download and unzip the product file.
- Open the workbook in Microsoft Excel.
- Go to the Data sheet and replace the sample records with your own railway equipment manufacturing data.
- Keep the same column structure so formulas, pivots, slicers, and charts continue working.
- Click Data in the Excel Ribbon, then click Refresh All.
- Use slicers on the dashboard pages to filter by plant, shift, status, category, supplier, and time period.
- Review the Overview, Production, Quality, Cost Analysis, and Operations pages for insights.
Real-World Use Cases
Plant Manager: Review work order volume, units produced, defect rate, and material cost before a weekly operations meeting.
Quality Lead: Compare defect rate by component and defect units by supplier to prioritize root-cause analysis.
Cost Controller: Analyze labor and material cost by plant, supplier, production line, and equipment category before monthly cost review.
Frequently Asked Questions
What does this dashboard track?
It tracks work orders, units produced, material cost, labor cost, defect rate, rework units, machine hours, downtime hours, quality score, suppliers, plants, shifts, production lines, supervisors, and equipment categories.
How many sheets are included?
The workbook includes 7 sheets: Overview, Production, Quality, Cost Analysis, Operations, Data, and Support.
Do I need advanced Excel skills?
No. You mainly update the Data sheet, keep the same format, and use Refresh All to update pivots and charts.
Can I edit the charts and slicers?
Yes. Since this is an Excel workbook, you can customize charts, slicers, formulas, colors, fields, and sheet layout.
Can I hide the Support sheet?
Yes. The Support sheet stores pivot tables that power the dashboard, and it can be kept hidden during normal use.
Does this connect directly to ERP software?
No. It is a spreadsheet dashboard template. You can paste or import exported ERP data into the Data sheet if it follows the required format.
About the Author
Built by PK – Microsoft Certified Professional with 15+ years of Excel, Google Sheets, and Power BI experience. Founder of NextGenTemplates, reaching 300K+ subscribers across YouTube channels. Every template is hand-built and tested before release.
Explore Related Templates
Explore more templates in the MS Excel category and the Excel Dashboard category. Related options include Chemical Manufacturing KPI Dashboard in Excel, Manufacturing Dashboard in Excel, and the COO Operations Director Toolkit.
Download the Railway Equipment Manufacturing Dashboard in Excel today and turn work order, production, quality, cost, and operations data into a ready-to-review Excel dashboard.
Last updated: July 31, 2026