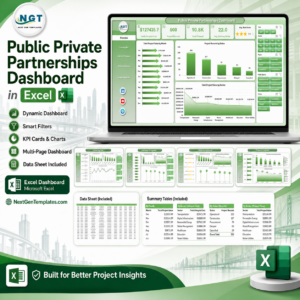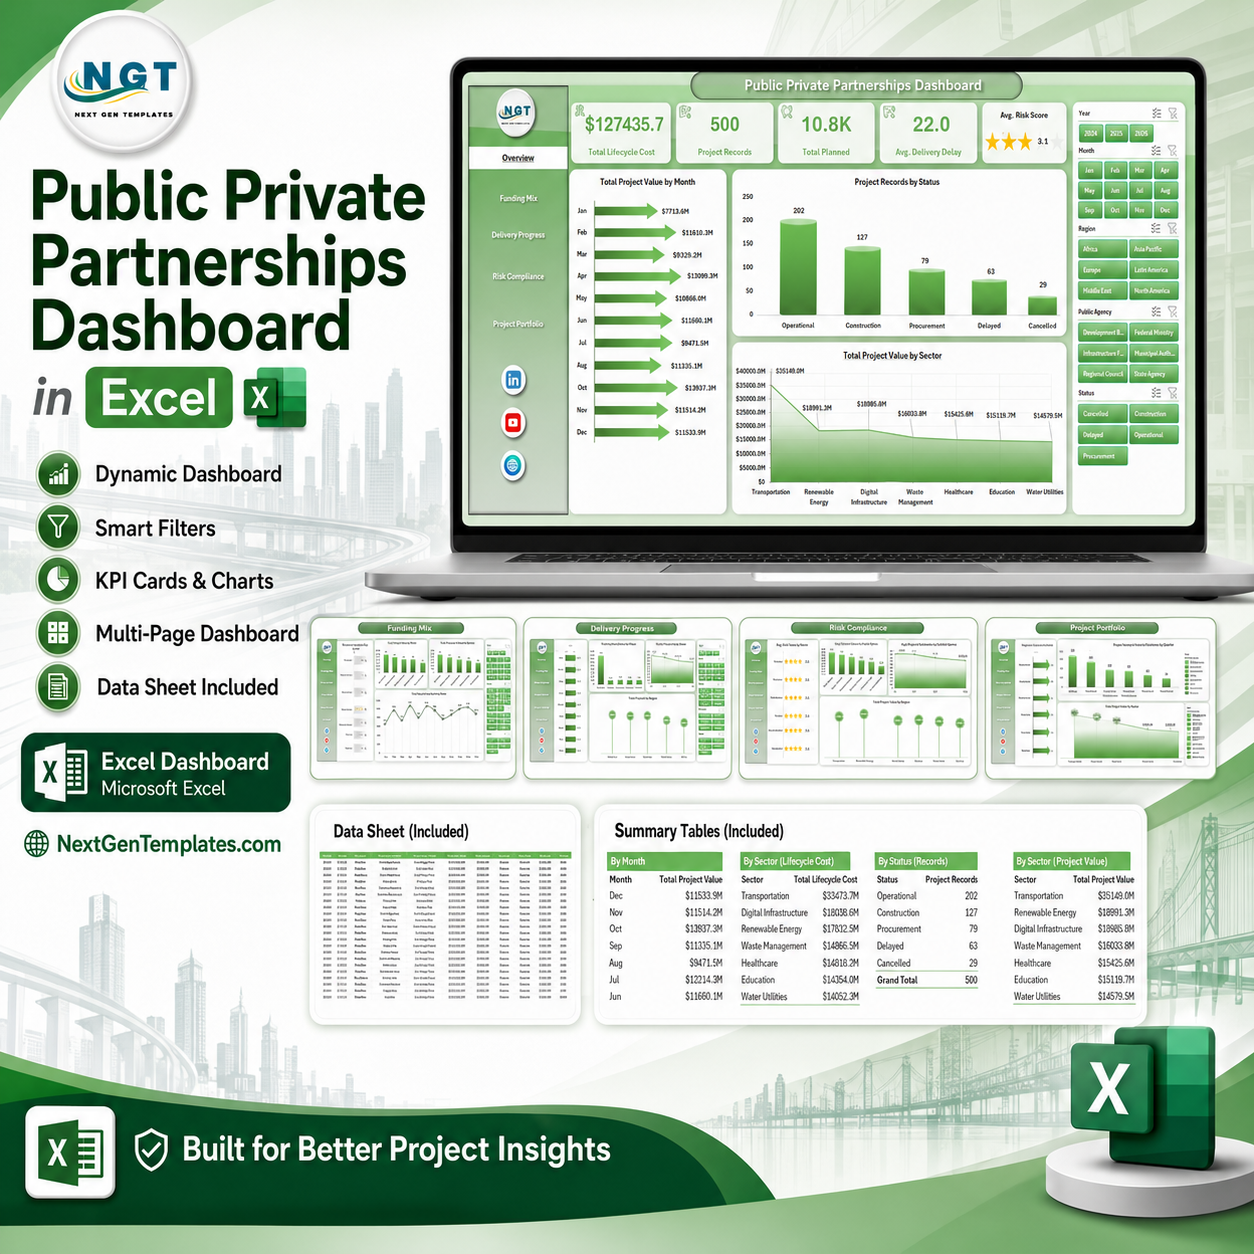


Public Private Partnerships Dashboard in Excel gives PPP teams a one-workbook way to monitor project value, lifecycle cost, milestones, delays, risk, and compliance without paying for a separate SaaS platform. Public infrastructure projects often run across many years, multiple agencies, several private partners, and complex funding models. When those records sit in disconnected trackers, reporting becomes slow and risk signals arrive late. This template reduces that reporting burden with 7 ready-to-use worksheet tabs, 5 executive KPI cards, 21 analytical charts, interactive slicers, a structured data sheet, and a support sheet driven by pivot tables. It is an instant-download Excel file with sample data, editable formulas, and a practical review-before-publish workflow for your team.
Key Features of Public Private Partnerships Dashboard in Excel
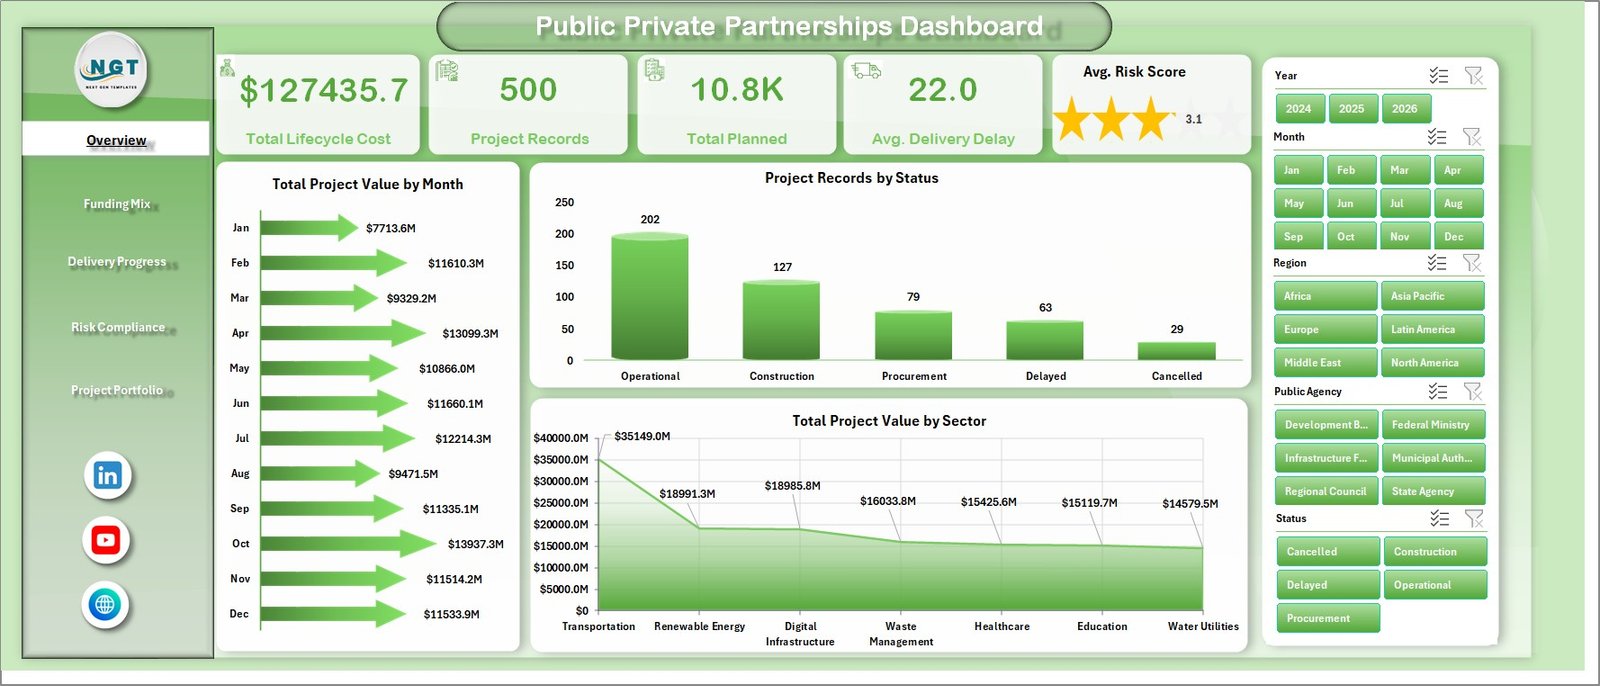
- PPP executive summary: Track Total Lifecycle Cost, Project Records, Total Planned, Avg. Delivery Delay, and Avg. Risk Score from the Overview page.
- Multi-page analysis: Review funding mix, delivery progress, risk compliance, and project portfolio insights in separate worksheet tabs.
- Interactive slicers: Filter project records quickly by the fields built into the dashboard so decision-makers can narrow the view without rebuilding charts.
- Milestone tracking: Compare planned, achieved, and completion metrics across month, quarter, sector, region, and status.
- Risk and compliance view: Monitor average risk score and compliance score by sector, agency, and partnership model.
- Structured data sheet: Replace sample rows with your own PPP project records and keep the same column format for smooth refreshes.
- Pivot-powered support sheet: Refresh all pivots from the Excel Data tab after updating the data sheet, then keep the support sheet hidden if preferred.
What’s Inside the Public Private Partnerships Dashboard in Excel
Overview Page
The Overview page gives senior stakeholders a high-level view of the complete PPP portfolio. The Total Project Value by Month chart shows how project value moves over time, helping teams spot months with heavy capital exposure or procurement concentration. The Project Records by Status chart separates records by pipeline, active, delayed, completed, or other status values used in the data. The Total Project Value by Sector chart highlights which sectors represent the largest share of PPP investment.
Public Private Partnerships Dashboard in Excel
Funding Mix
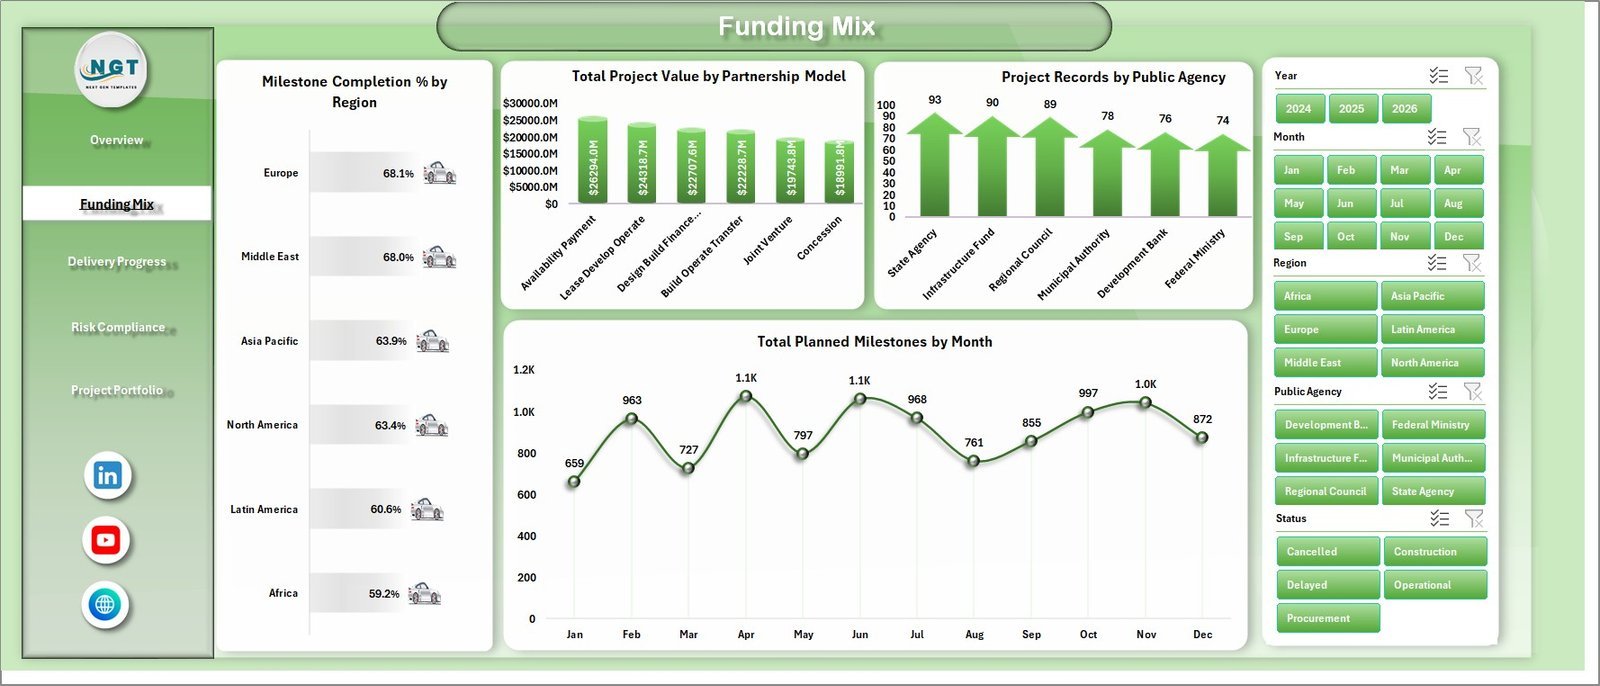
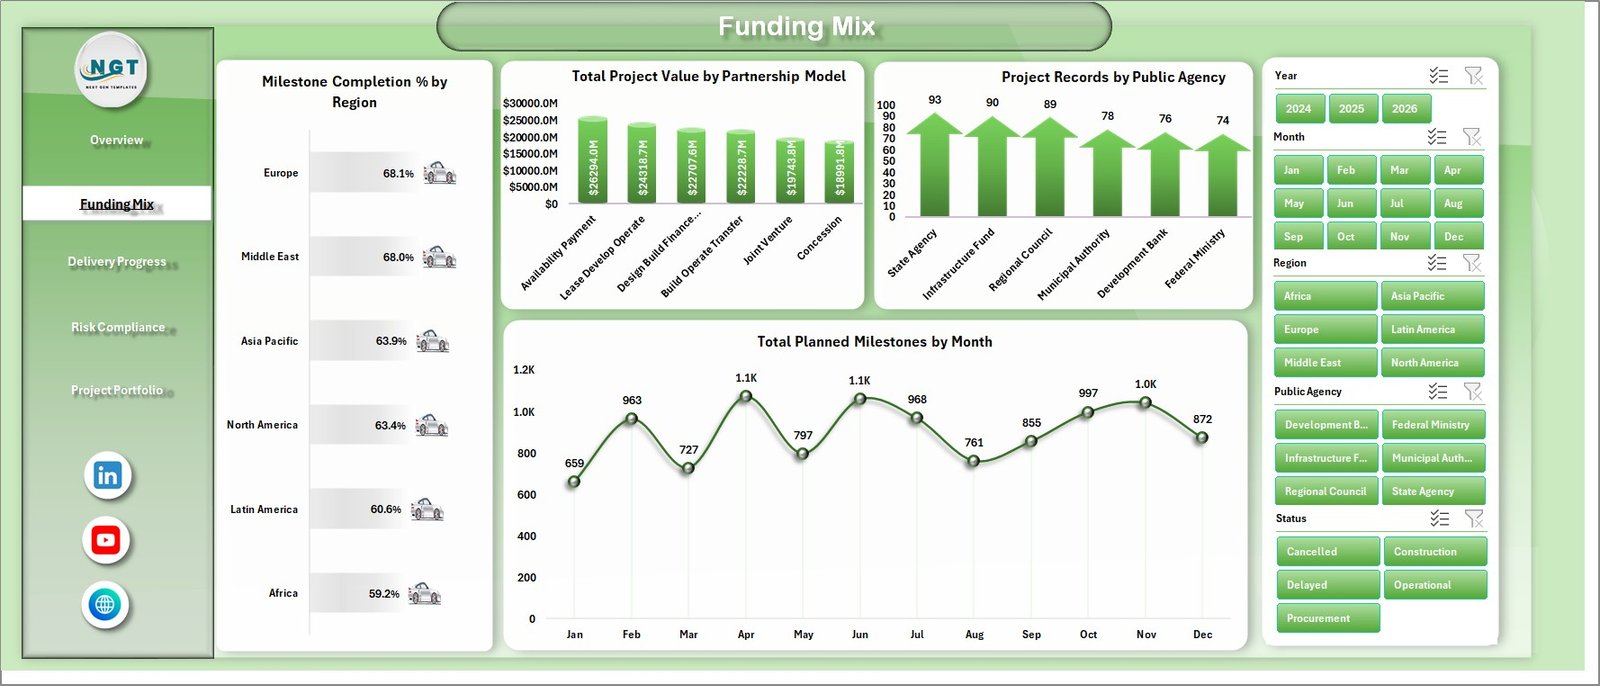
The Funding Mix tab focuses on how value, milestones, regions, models, and agencies interact. Milestone Completion % by Region compares delivery progress across regions. Total Project Value by Partnership Model shows the financial weight of each PPP structure. Project Records by Public Agency helps identify which agencies manage the highest activity volume. Total Planned Milestones by Month gives a planning view for upcoming delivery load.
Funding Mix
Delivery Progress
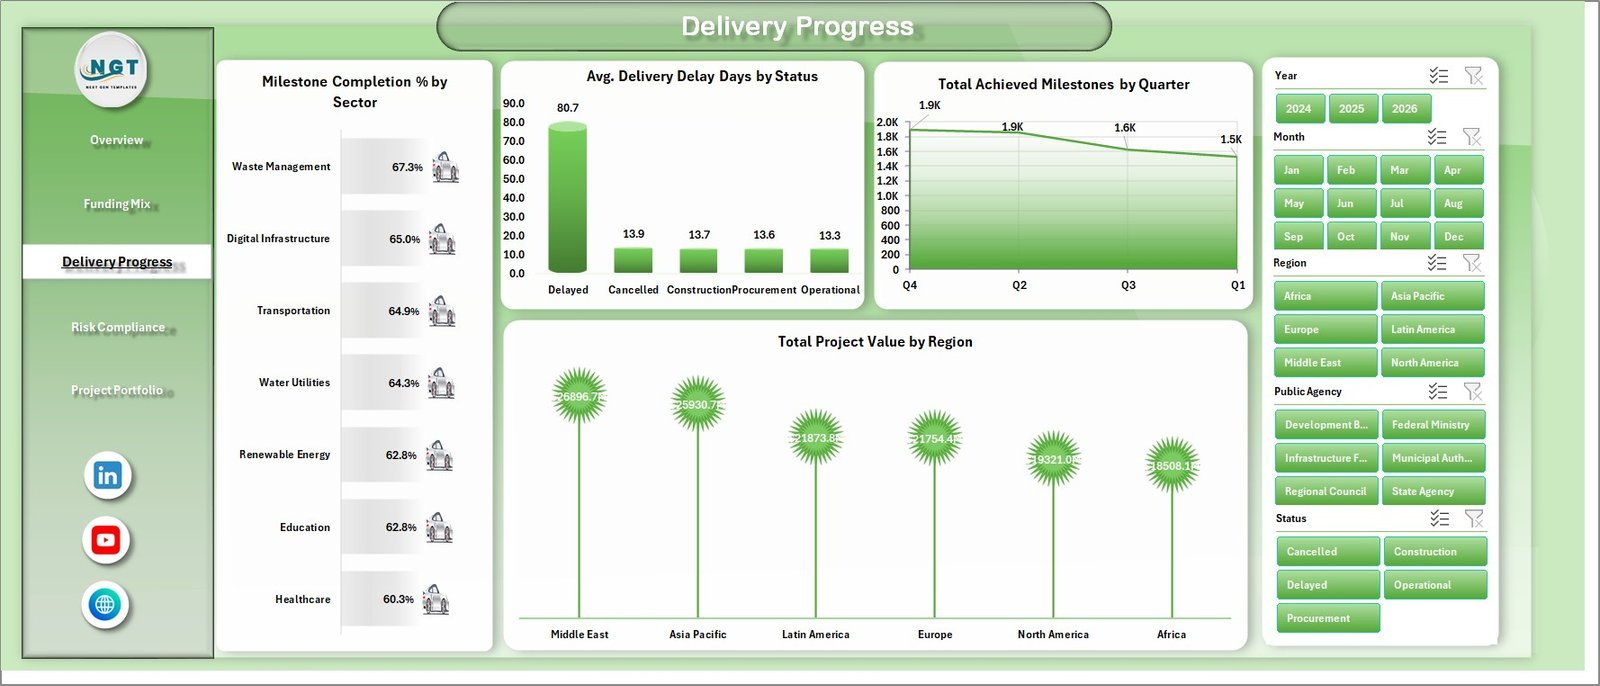
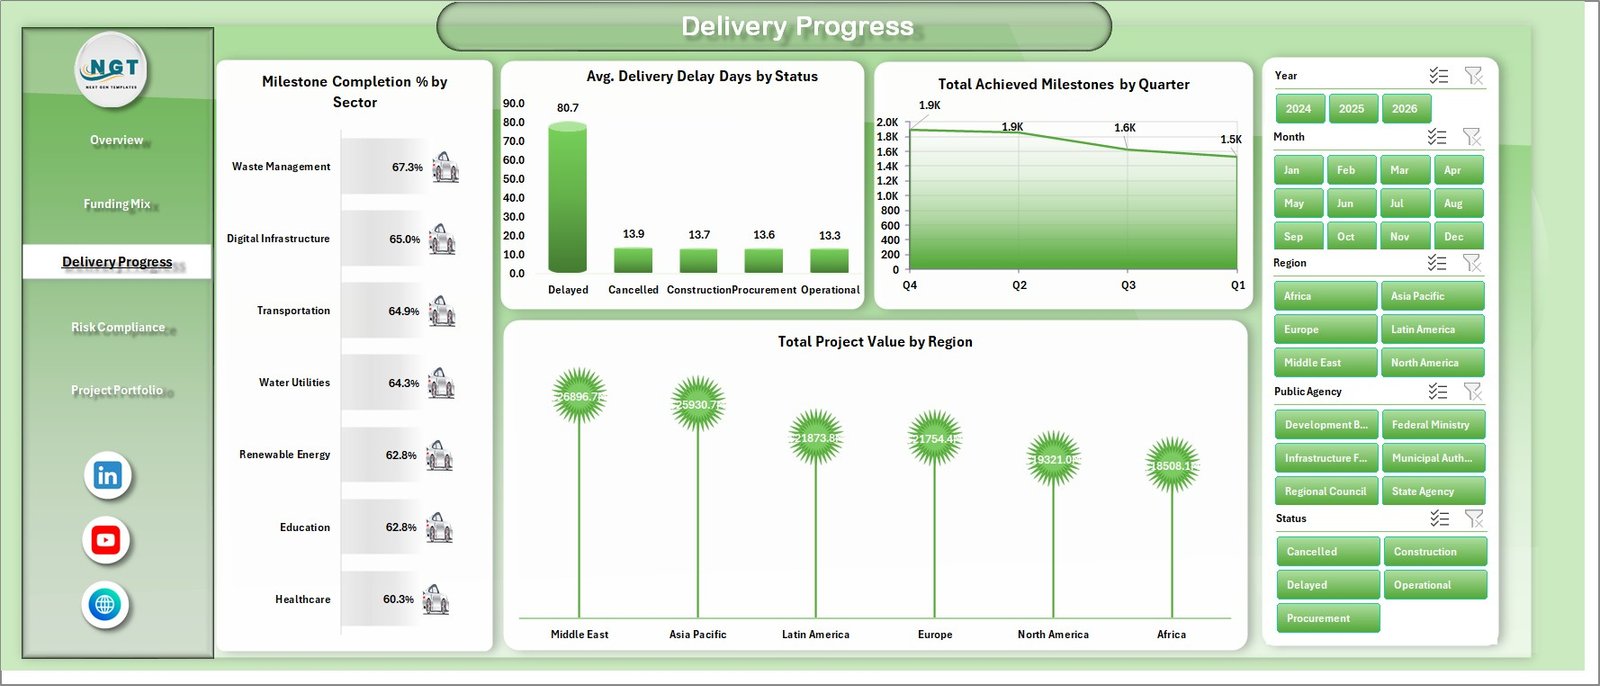
The Delivery Progress sheet helps teams review whether PPP projects are advancing as expected. Milestone Completion % by Sector compares execution maturity by sector. Avg. Delivery Delay Days by Status shows where delays are concentrated. Total Achieved Milestones by Quarter summarizes completed delivery output over time. Total Project Value by Region shows where high-value delivery responsibility sits.
Delivery Progress
Risk Compliance
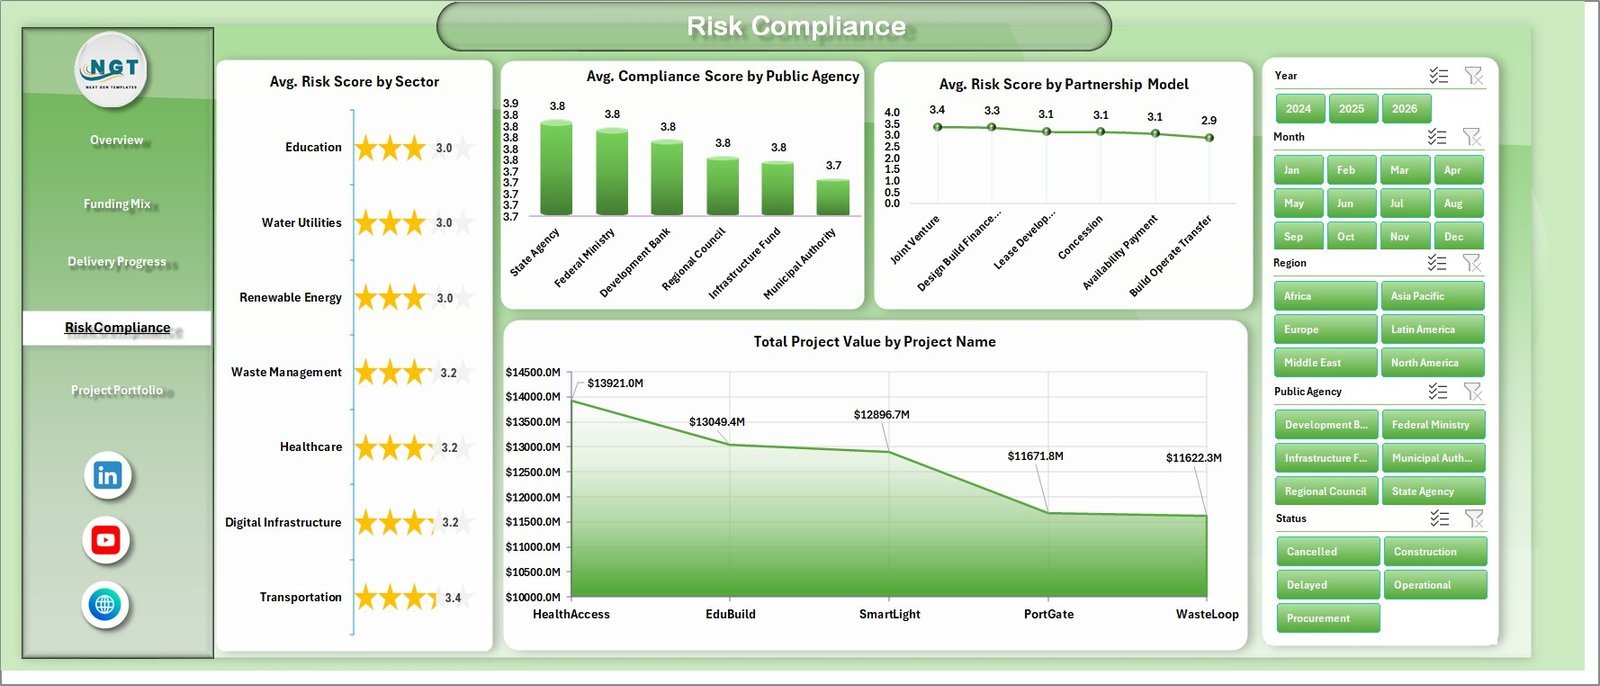
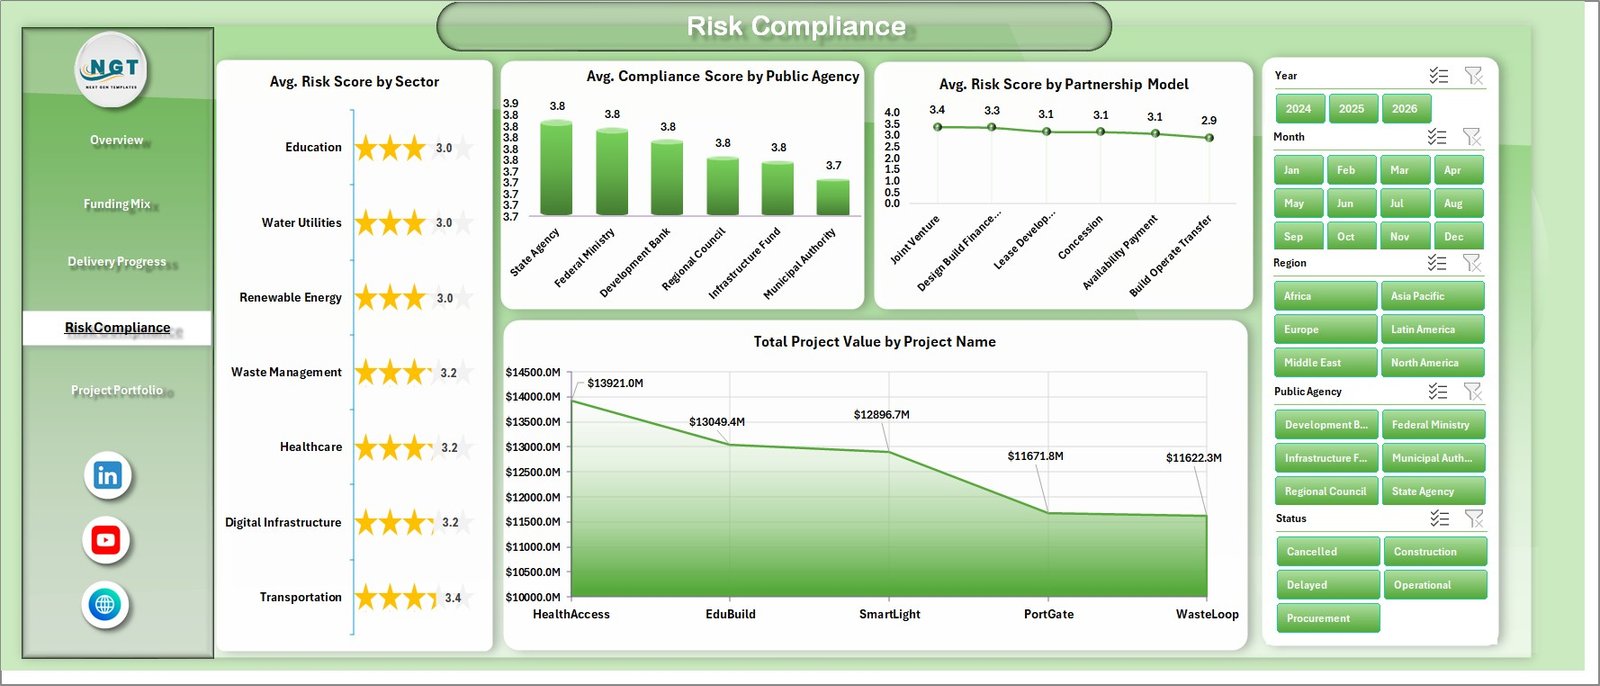
The Risk Compliance tab brings governance indicators into one view. Avg. Risk Score by Sector helps identify sector-level risk patterns. Avg. Compliance Score by Public Agency compares agency compliance performance. Avg. Risk Score by Partnership Model reveals which delivery models carry higher risk. Total Project Value by Project Name highlights the largest projects needing close review.
Risk Compliance
Project Portfolio
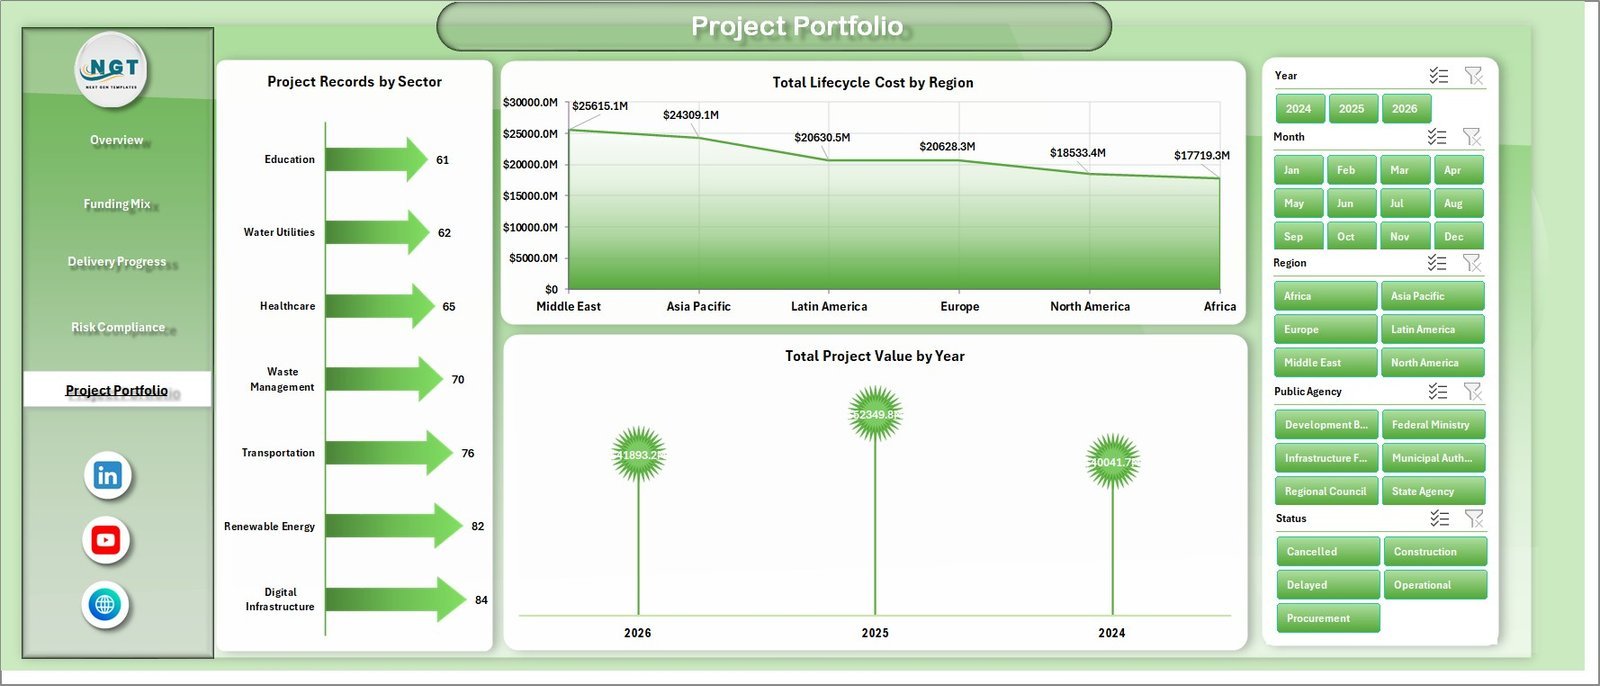
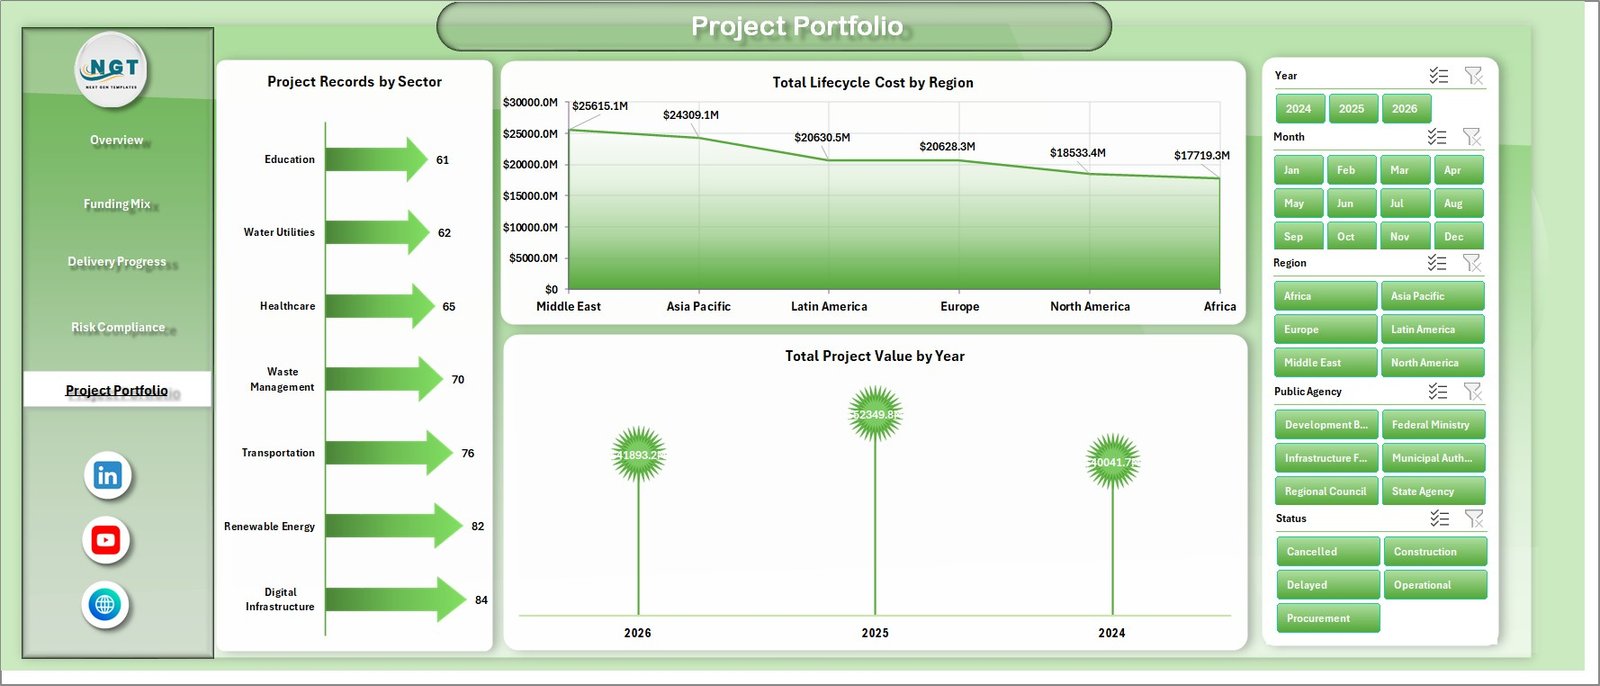
The Project Portfolio sheet summarizes the overall project book. Project Records by Sector shows the distribution of activity. Total Lifecycle Cost by Region compares long-term cost exposure. Total Project Value by Year gives a time-based investment picture for annual reviews and budget discussions.
Project Portfolio
Data Sheet Tab
The Data sheet is where you add or replace the project records in the same format as the sample data. Keep the column names and structure consistent so the dashboard, pivots, slicers, and charts continue to update cleanly.

Data Sheet tab
Support Sheet Tab
The Support sheet contains the pivot tables used to create the dynamic dashboard. After updating the Data sheet, go to the Data tab in the Excel Ribbon and click Refresh All. The pivots and charts will refresh together, and you can keep this sheet hidden after setup.

Support Sheet tab
Public Private Partnerships Dashboard in Excel vs. Google Sheets vs. Paid CRM/SaaS – Where This Fits
| Factor | This Excel Dashboard | Google Sheets Alternative | Paid SaaS Alternative |
|---|---|---|---|
| Cost | One-time template purchase | Usually free with manual build time | Monthly or annual subscription |
| Platform | Microsoft Excel desktop | Browser-based spreadsheet | Vendor-hosted system |
| Setup time | Replace sample data and refresh | Build charts, formulas, and filters manually | Implementation, configuration, and user setup |
| Real-time team collaboration | Best through shared workbook processes | Strong real-time collaboration | Usually strong, depending on plan |
| Mobile access | Limited for serious dashboard editing | Good for light review | Usually available |
| Customizable fields | Editable workbook structure | Editable but easy to break | Often constrained by admin settings |
| Share with link | Best as a file or PDF export | Strong link sharing | Usually account-based access |
| Year-1 cost at 5 users | $17.99 sale price | Low software cost, higher build effort | Often hundreds or thousands of dollars |
| PPP portfolio fit | Strong for structured monthly reporting | Good for collaborative data entry | Best for enterprise workflow automation |
Who This Template Is For – and Who It’s Not For
This dashboard is built for government PPP cells, infrastructure agencies, PMO teams, consultants, public finance teams, and private concession teams that need a clear Excel reporting layer. It is also useful for training, proposal support, and monthly steering committee packs.
It is not the right fit if you need automated contract approvals, role-based SaaS workflows, live ERP integration, or legal document management. In those cases, use this workbook as a reporting model or prototype before investing in a larger system.
How to Use the Public Private Partnerships Dashboard in Excel
- Download and unzip the file after purchase.
- Open the workbook in Microsoft Excel.
- Go to the Data sheet and replace the sample rows with your PPP project records.
- Keep the same column structure for dates, sectors, regions, agencies, milestones, project value, lifecycle cost, risk, and compliance fields.
- Use Data > Refresh All from the Excel Ribbon.
- Review the Overview, Funding Mix, Delivery Progress, Risk Compliance, and Project Portfolio tabs.
- Use slicers to focus the dashboard on a specific region, sector, status, agency, or model.
Real-World Use Cases
Anita, PPP Program Director: Anita uses the Overview and Project Portfolio pages before monthly steering meetings to explain value, lifecycle cost, and delay trends clearly.
Rahul, Infrastructure Finance Analyst: Rahul uses the Funding Mix page to compare project value by partnership model and planned milestones by month before budget reviews.
Meera, Governance Consultant: Meera uses the Risk Compliance tab to show where average risk scores and compliance scores require management attention.
Frequently Asked Questions
Can I use this dashboard for any PPP sector?
Yes. The workbook is designed around sector, region, agency, partnership model, project value, milestones, risk, and compliance fields, so it can support transport, utilities, healthcare, education, housing, and other PPP portfolios.
Do I need advanced Excel skills?
No. You mainly replace sample data, refresh pivots, and use slicers. Basic Excel knowledge is enough for normal use.
Can I edit the charts and KPIs?
Yes. The workbook is editable, so you can change labels, colors, formulas, and chart formats to match your reporting style.
Does it include sample data?
Yes. The template includes a sample data structure so you can understand the required format before entering your own PPP records.
How do I refresh the dashboard?
After updating the Data sheet, go to the Excel Ribbon, open the Data tab, and click Refresh All. The support pivots and dashboard charts refresh from the updated data.
Can I hide the Support sheet?
Yes. The Support sheet is used for pivot tables and helper calculations. You can keep it hidden after setup.
About the Author
Built by PK – Microsoft Certified Professional with 15+ years of Excel, Google Sheets, and Power BI experience. Founder of NextGenTemplates, reaching 300K+ subscribers across YouTube channels. Every template is hand-built and tested before release.
Explore Related Templates
You may also like Smart Cities Contract Management Dashboard in Excel, Data Analyst’s Chart & Visualization Pack, and the IT Manager & CISO Toolkit. Browse more Excel dashboard templates and project management templates.
Download the Public Private Partnerships Dashboard in Excel today and turn PPP project records into a clear, refreshable management dashboard.
Watch the demo video: