

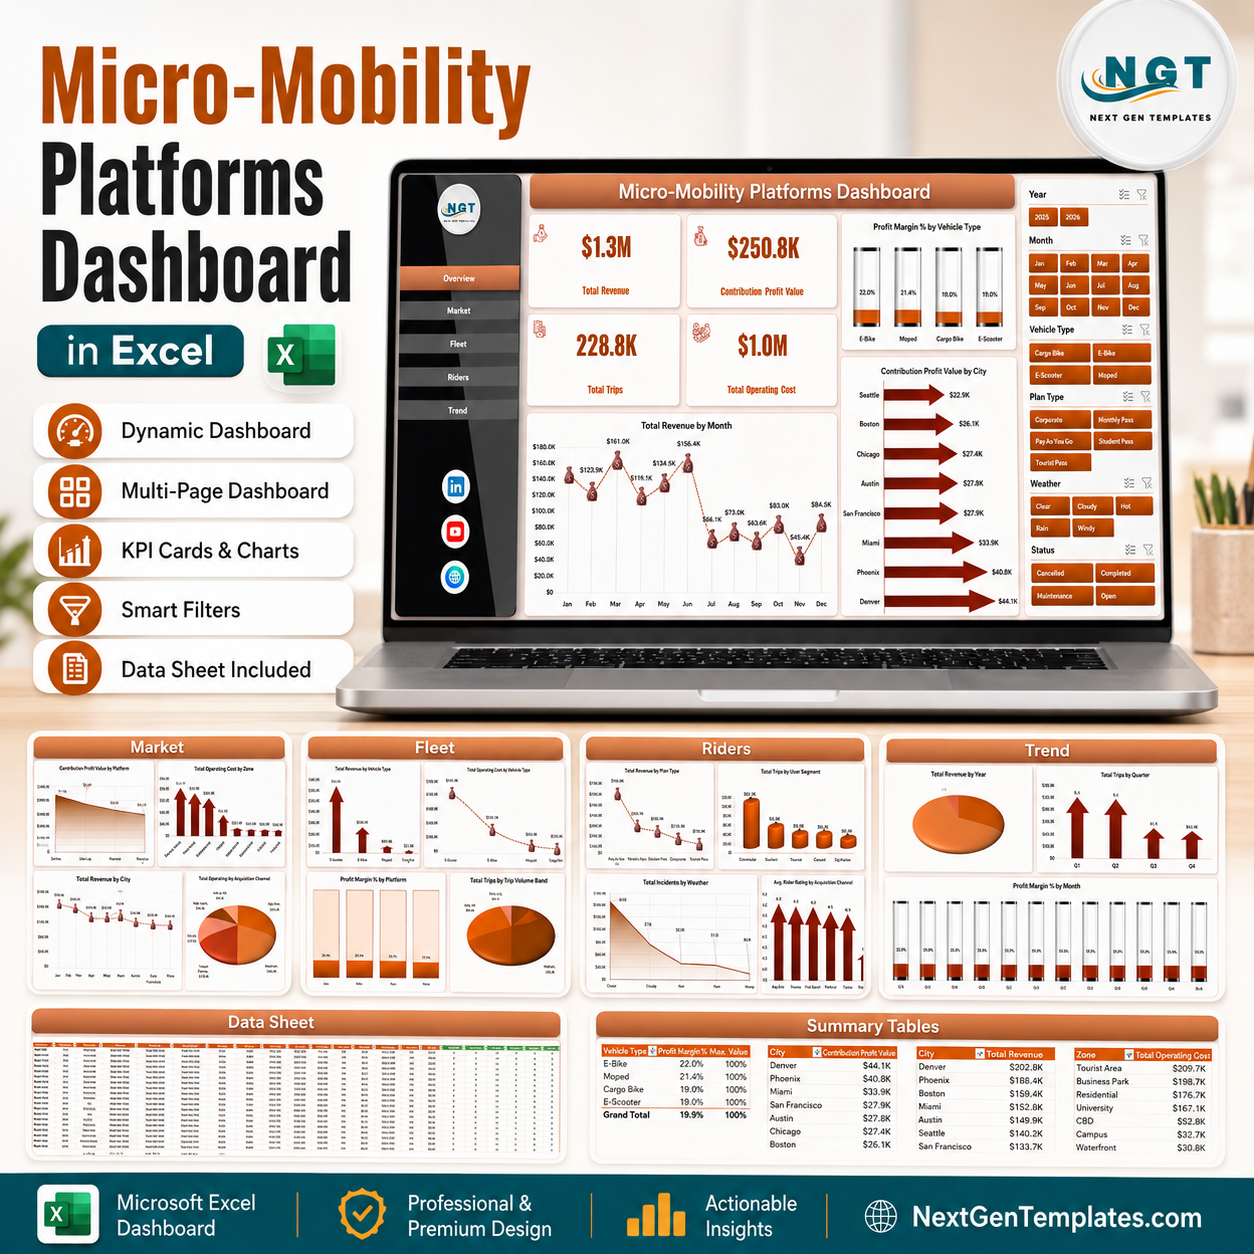


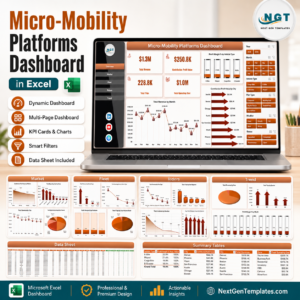
Micro-Mobility Platforms Dashboard in Excel gives scooter, bike-share, e-bike, and shared mobility teams a ready reporting workbook with 7 connected sheet tabs, 4 executive KPI cards, 21 chart views, interactive slicers, a structured Data Sheet, and a Support Sheet for pivot-based refresh. Track Total Revenue, Contribution Profit Value, Total Trips, and Total Operating Cost without paying for a custom BI build. More than 8,400 teams in 40+ countries use NextGenTemplates to replace manual reporting with editable templates. Your purchase is backed by a 7-day file-match review if the delivered file does not match this page.
Key Features of Micro-Mobility Platforms Dashboard in Excel
- 7 Excel sheet tabs: Overview, Market, Fleet, Riders, Trend, Data Sheet, and Support Sheet.
- 4 KPI cards: Total Revenue, Contribution Profit Value, Total Trips, and Total Operating Cost.
- 21 chart views: Review revenue, profit, operating cost, trips, incidents, ratings, users, vehicle types, platforms, cities, zones, and monthly trends.
- Interactive slicers: Filter dashboard pages quickly by available dimensions in the workbook.
- Editable Data Sheet: Replace sample rows in the same format and refresh all pivots.
- Support Sheet included: Pivot tables drive the dashboard and can be hidden from everyday users.
What’s Inside the Micro-Mobility Platforms Dashboard in Excel
Overview Page
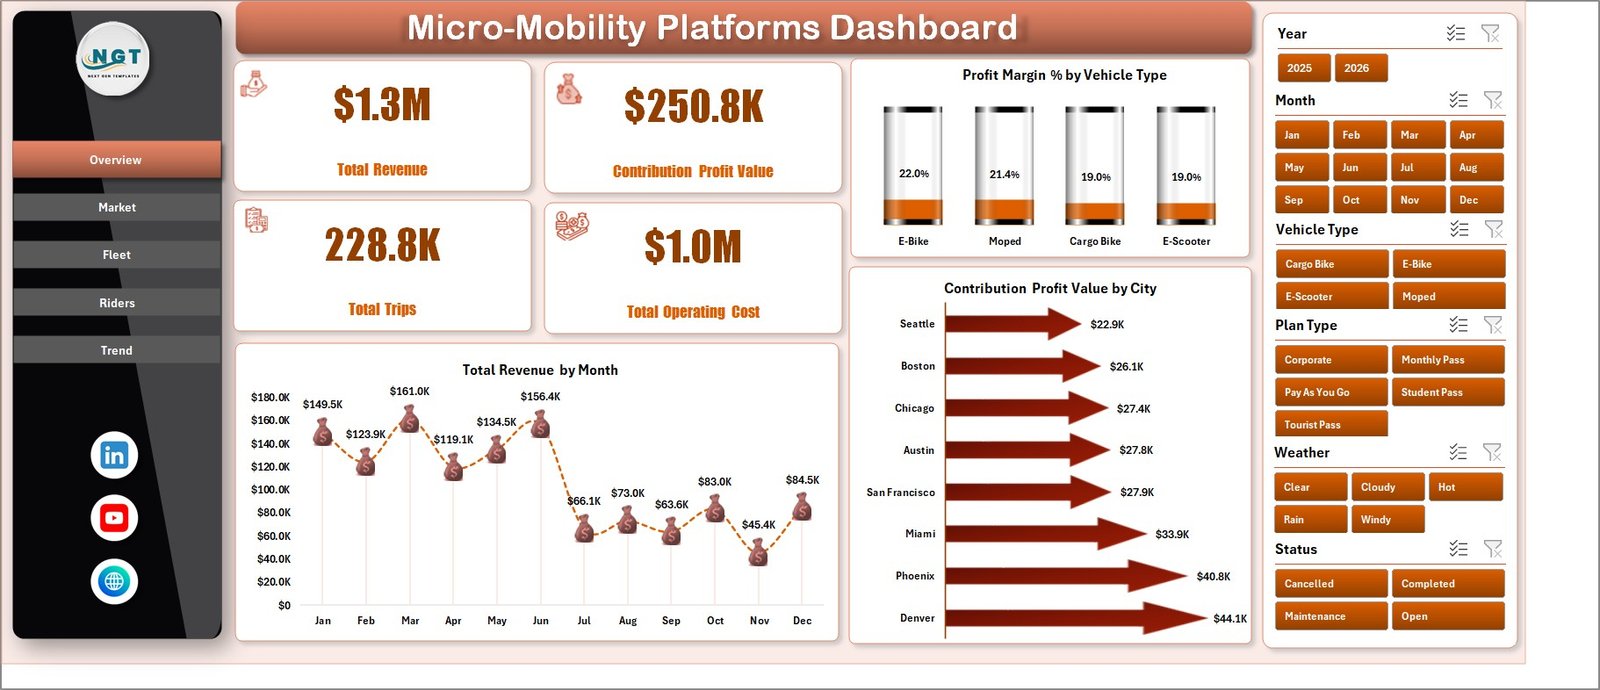
The Overview page gives leadership a fast read on revenue, profit, trip volume, and cost. Cards summarize Total Revenue, Contribution Profit Value, Total Trips, and Total Operating Cost.
Profit Margin % by Vehicle Type: Compare margin across bikes, scooters, e-bikes, and other fleet types. This helps identify which vehicle mix supports better unit economics.
Contribution Profit Value by City: Review city-level contribution profit to see where operations create the most value. This is useful for market expansion and local pricing reviews.
Total Revenue by Month: Track revenue movement across months. The trend helps spot seasonal demand, campaign impact, and growth momentum.
Market
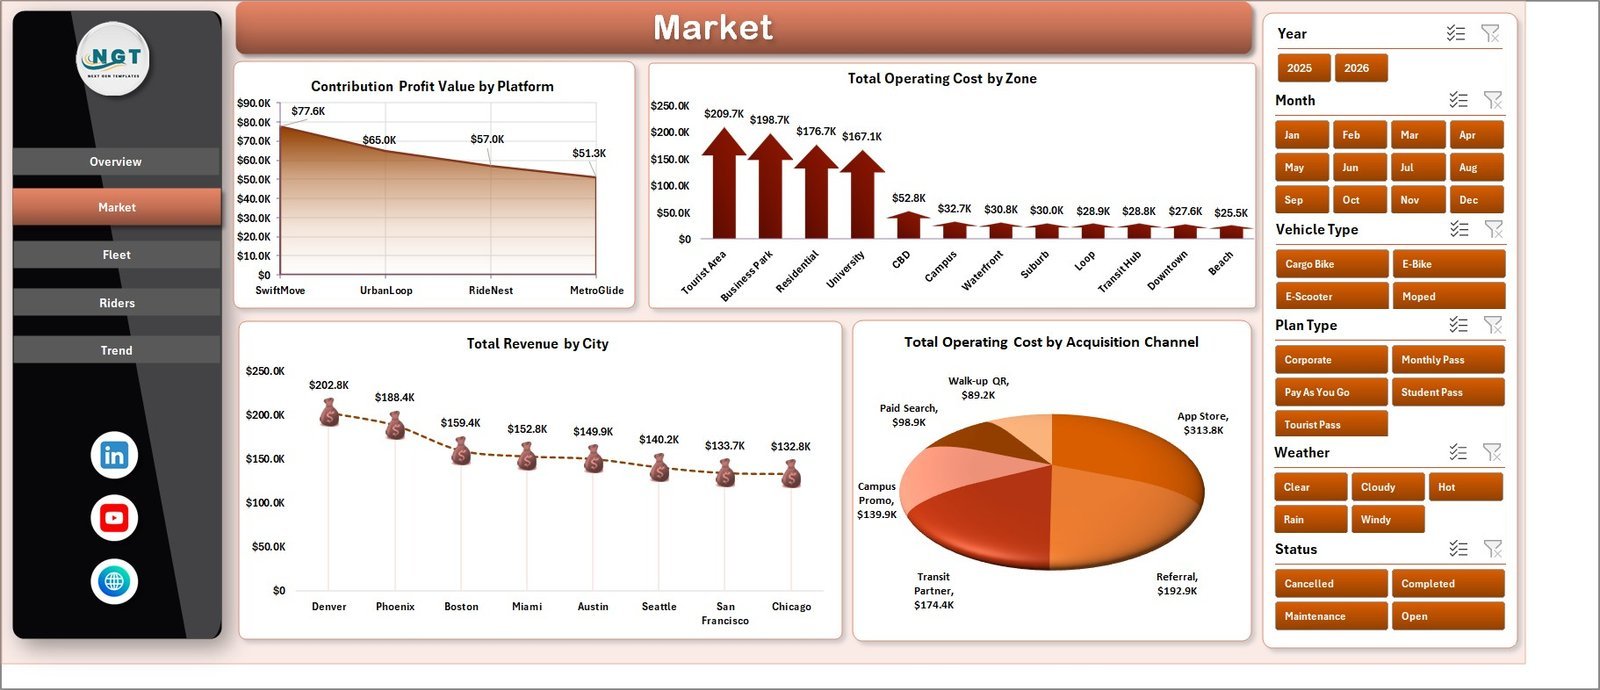
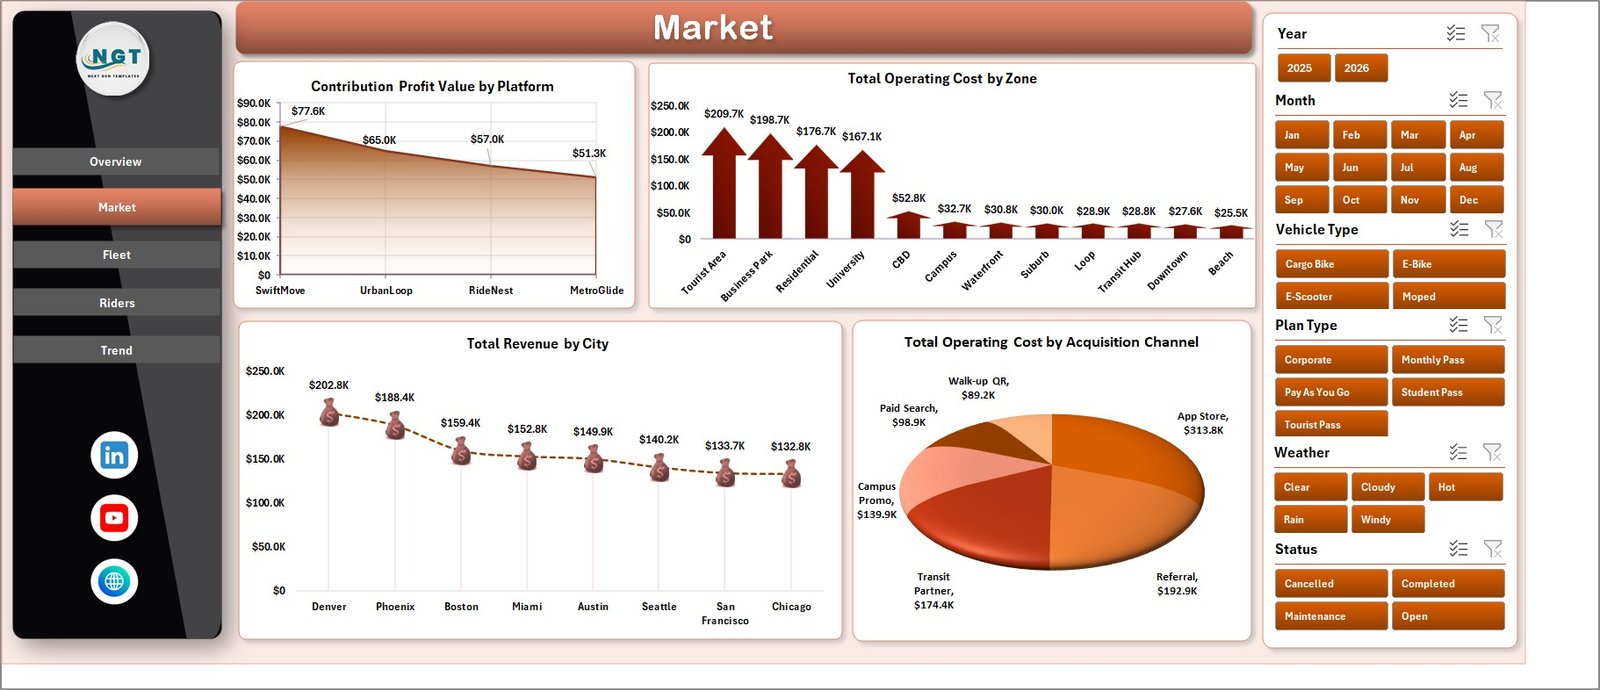
The Market tab analyzes performance by platform, zone, city, and acquisition channel. It is useful for city managers and growth teams reviewing where the business is profitable and where costs need attention.
Contribution Profit Value by Platform: Compare profit contribution across platform sources. Use it to see which app, partner, or service channel generates stronger margin.
Total Operating Cost by Zone: Identify zones with higher operating cost. This helps operations teams review maintenance, charging, rebalancing, or staffing pressure.
Total Revenue by City: Rank cities by revenue contribution. This makes high-performing and underperforming markets easy to compare.
Total Operating Cost by Acquisition Channel: Connect customer acquisition channels with cost behavior. This helps marketing and operations discuss profitable growth.
Fleet
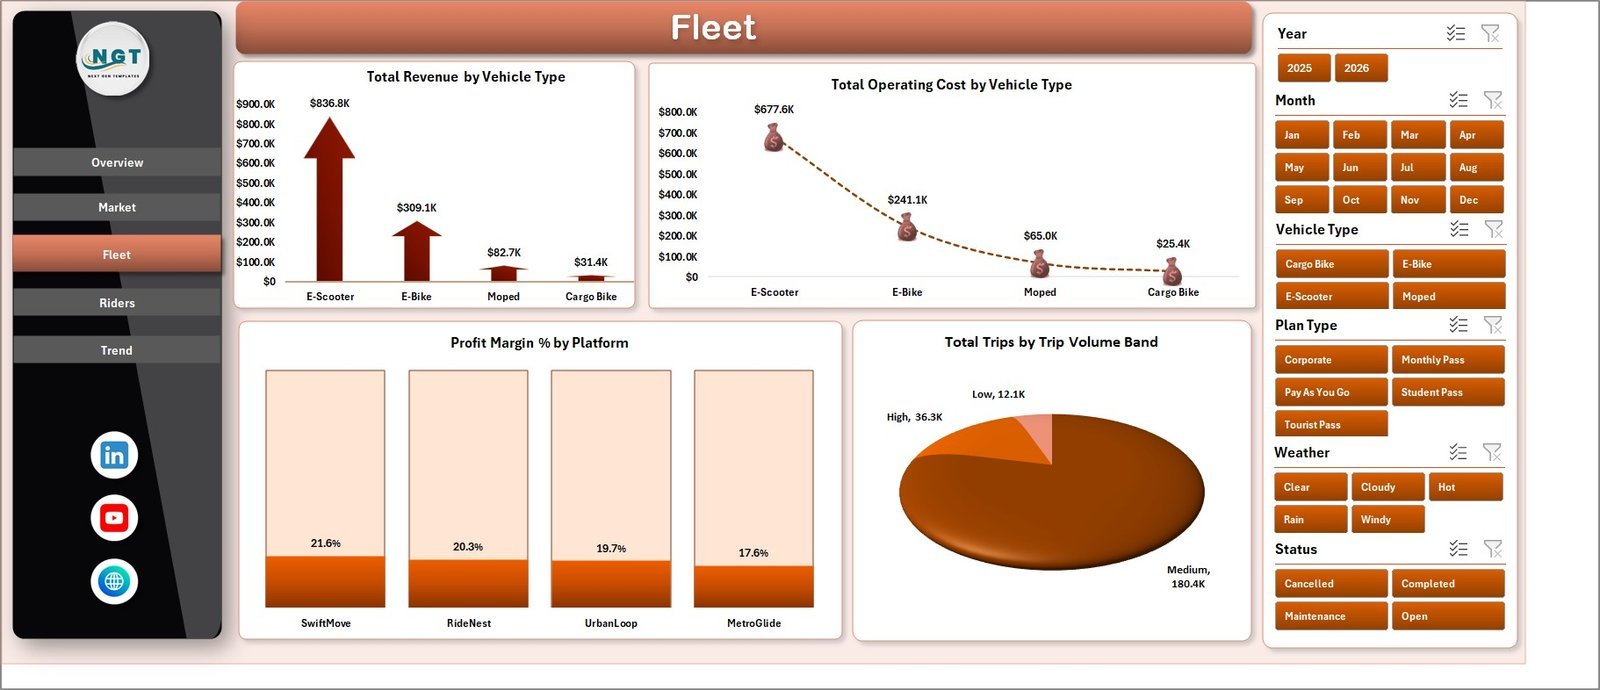
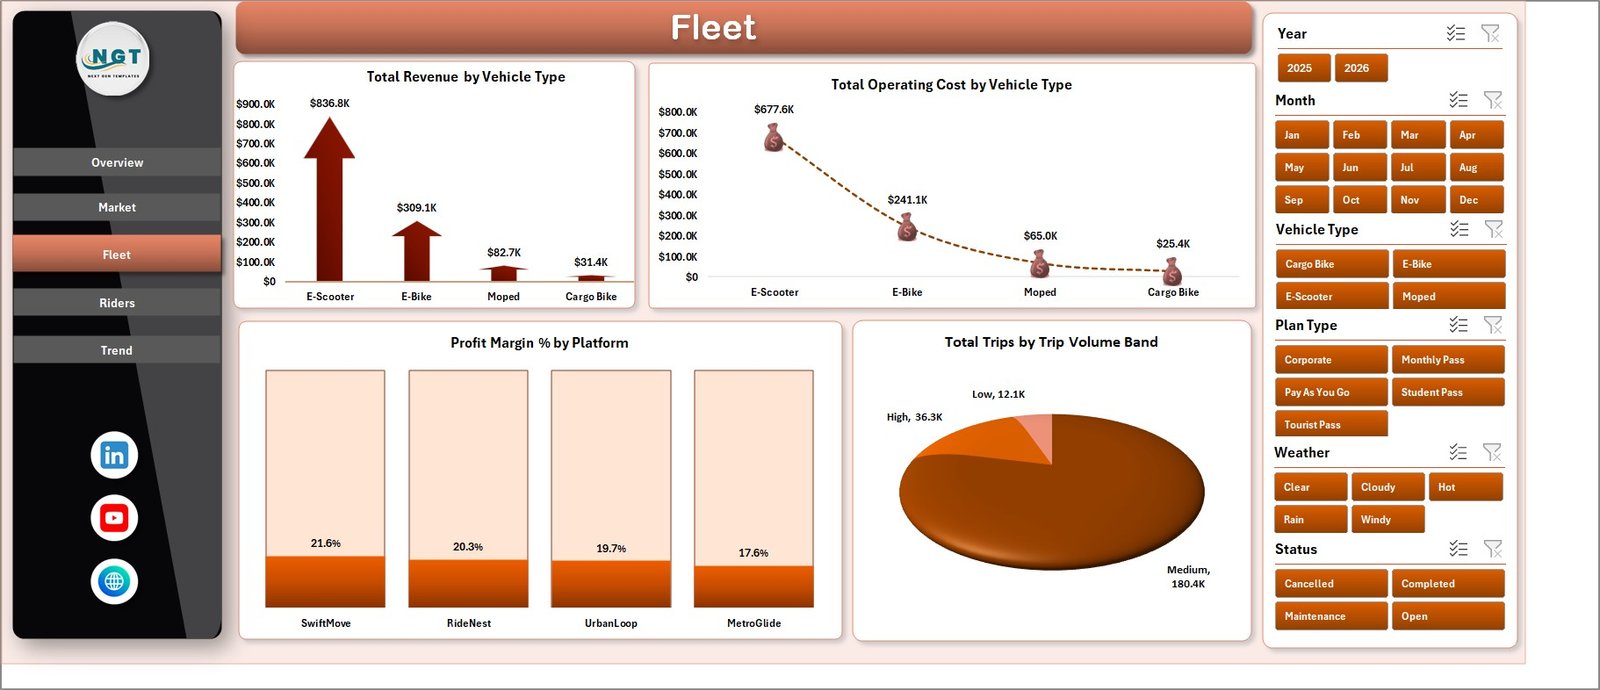
The Fleet page focuses on vehicle type, platform, and trip volume bands so managers can review revenue, cost, margin, and trip contribution by fleet mix.
Total Revenue by Vehicle Type: Compare revenue across scooters, bikes, and other vehicle classes. It helps understand which fleet assets produce the most sales.
Total Operating Cost by Vehicle Type: Review which vehicle types create higher cost. This supports maintenance, charging, and replacement planning.
Profit Margin % by Platform: Compare margin by platform or service source. It helps detect where incentives, fees, or pricing may be reducing profit.
Total Trips by Trip Volume Band: Group trip activity into volume bands. This makes demand intensity easier to read during operations reviews.
Riders, Trend, Data, and Support Sheets
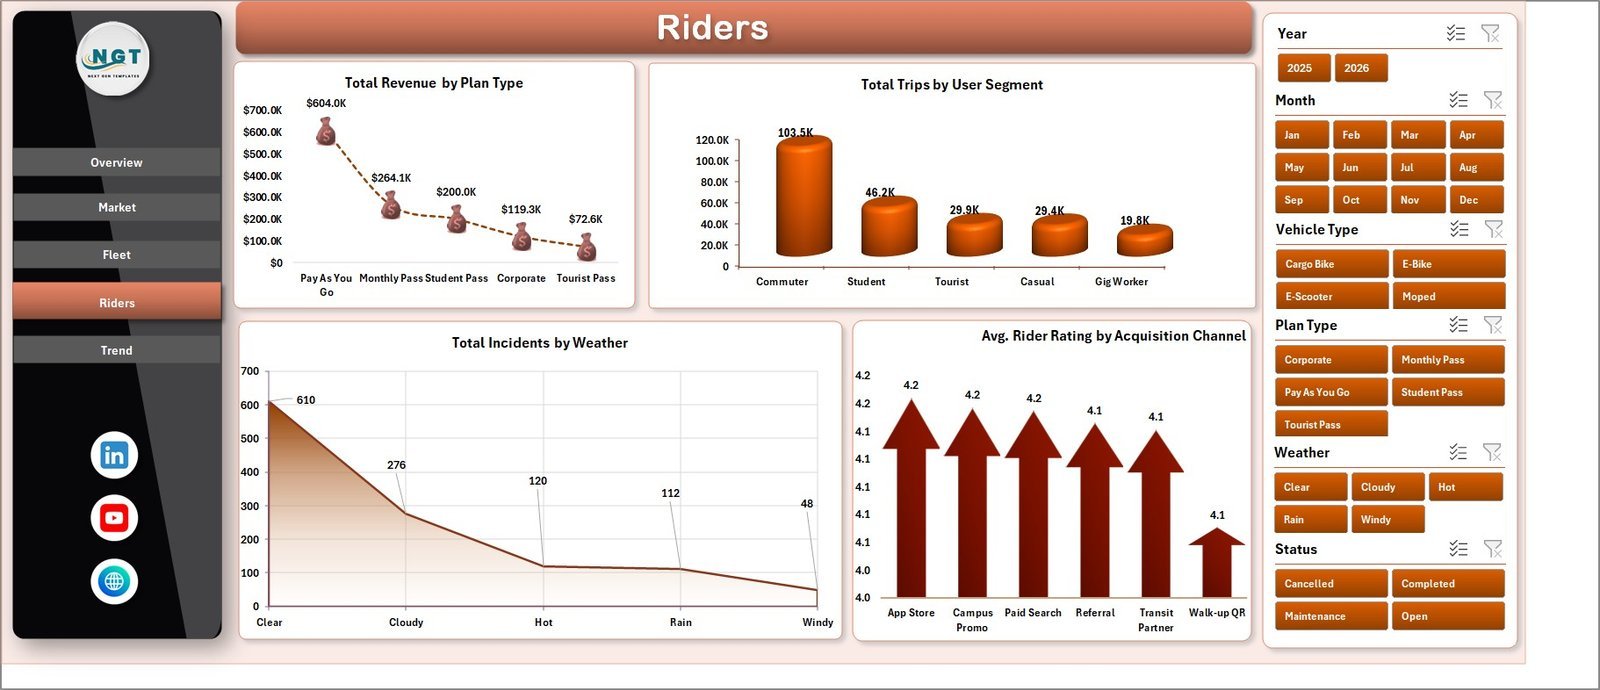
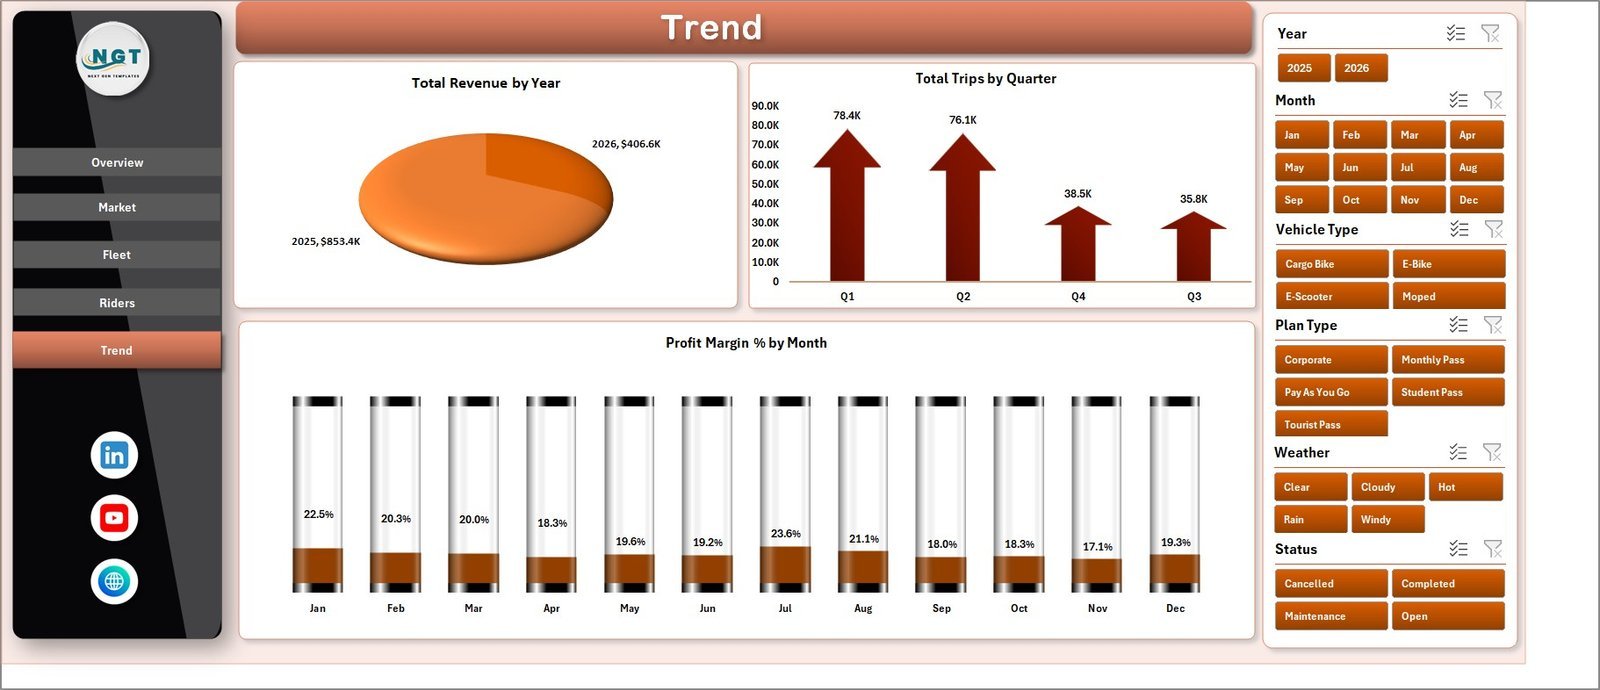
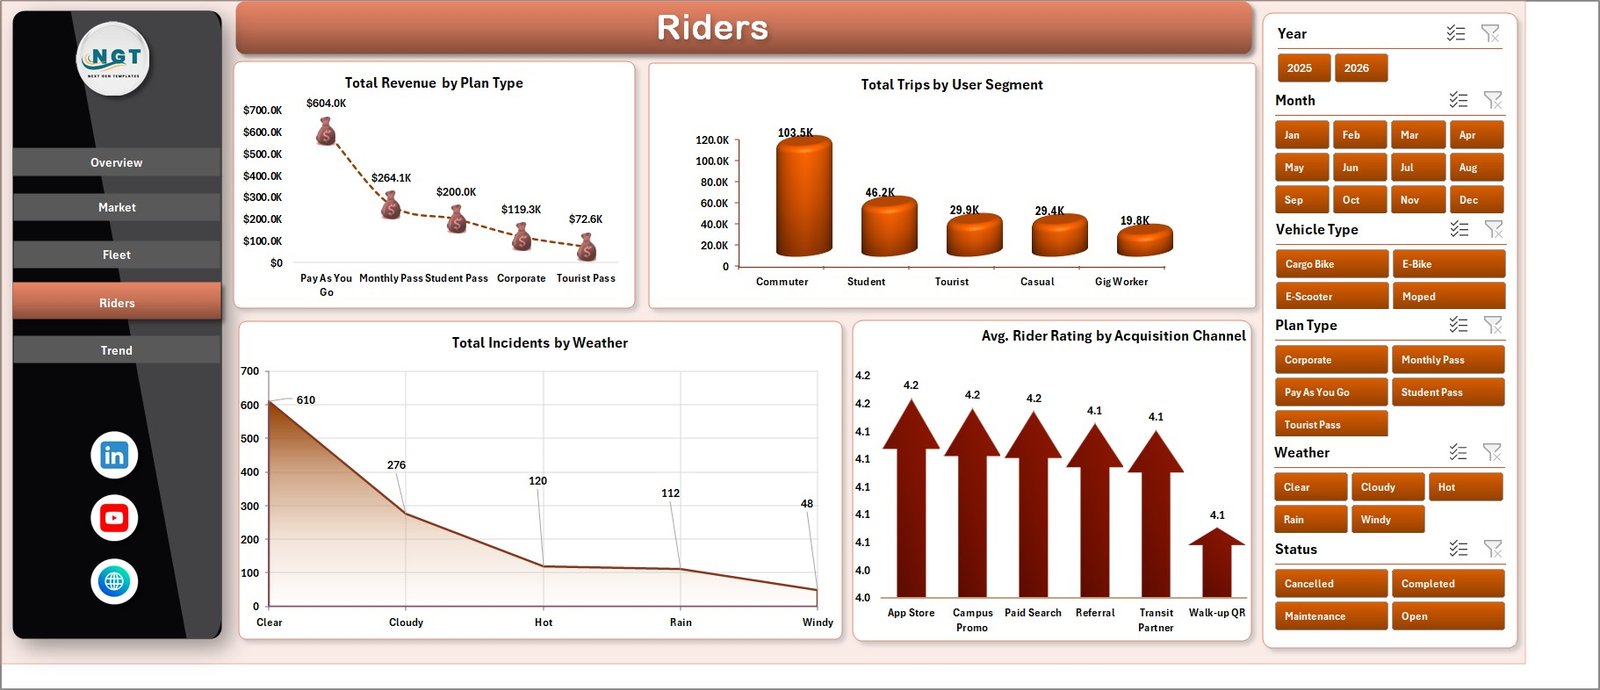
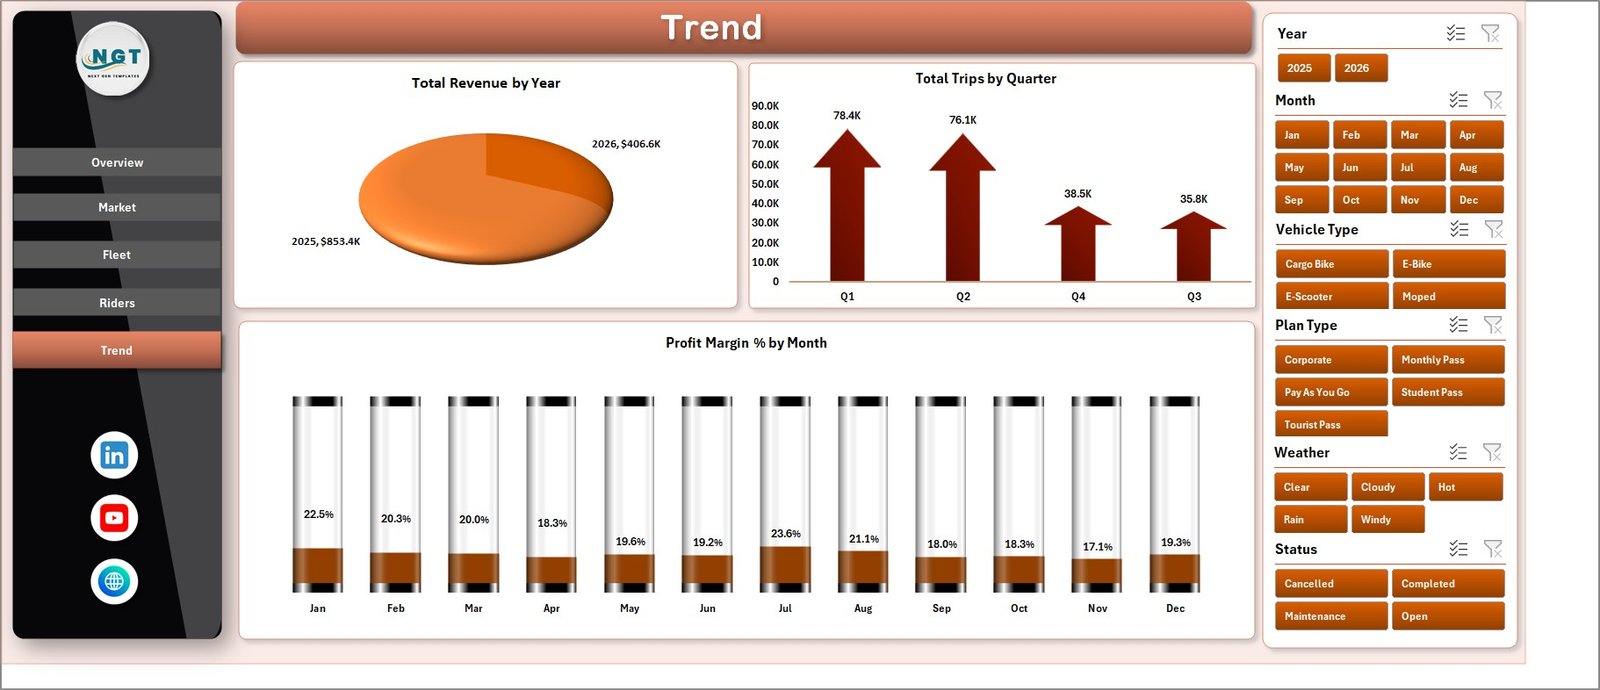
The Riders tab analyzes plan type, user segment, weather incidents, and rider rating by acquisition channel. The Trend tab tracks Total Revenue by Year, Total Trips by Quarter, and Profit Margin % by Month. The Data Sheet holds the source records, while the Support Sheet stores the pivot tables that power the charts.


Micro-Mobility Platforms Dashboard in Excel vs. Google Sheets vs. Paid Fleet SaaS – Where This Fits
| Feature | This Excel dashboard | Google Sheets alternative | Paid fleet SaaS |
|---|---|---|---|
| Cost | $17.99 sale price, one-time | Template cost plus build time | Recurring subscription |
| Platform | Microsoft Excel | Browser spreadsheet | Vendor cloud system |
| Setup time | Replace data and refresh pivots | Import and rebuild formulas | Implementation and onboarding |
| Real-time collaboration | Available through Microsoft 365 sharing | Native collaboration | Usually included |
| Customizable fields | Editable sheets, pivots, charts, and slicers | Editable with formula care | Depends on vendor permissions |
| Year-1 cost at 5 users | Template price plus Excel licensing if needed | Workspace cost plus setup time | Often hundreds or thousands |
| Mobility analytics | Revenue, profit, trips, cost, city, rider, fleet, and trend views | Must be built or adapted | Depends on modules purchased |
Who This Template Is For – and Who It’s Not For
This template is for micro-mobility founders, city managers, fleet operations teams, finance analysts, growth teams, consultants, and shared mobility operators who already work with exported trip, revenue, cost, rider, and vehicle data.
It is not a live telematics platform, payment processor, GPS tracker, dispatch system, or maintenance work-order tool. If you need real-time IoT feeds, automated rider billing, or vehicle-lock controls, use this workbook as a reporting layer after exporting approved data.
How to Use the Micro-Mobility Platforms Dashboard in Excel
- Download and open the Excel workbook.
- Go to the Data Sheet and replace sample records using the same column format.
- Keep the existing column headers so pivots and slicers stay connected.
- Open the Excel Data ribbon and click Refresh All.
- Use slicers on each dashboard page to filter by platform, city, zone, vehicle type, rider segment, plan type, month, and other available fields.
- Hide the Support Sheet before sharing with everyday users if needed.
Real-World Use Cases
Anika, city operations manager: reviews operating cost by zone and revenue by city before deciding where rebalancing effort should be increased.
Marcus, fleet finance lead: checks profit margin by vehicle type and platform before budget meetings so cost movement is backed by data.
Priya, growth analyst: compares plan type revenue, acquisition channel rating, and rider segment trips to understand where user growth is profitable.
Frequently Asked Questions
What does this dashboard track?
It tracks revenue, contribution profit, trips, operating cost, margin, platform, city, zone, acquisition channel, vehicle type, rider segment, plan type, weather incidents, ratings, and time trends.
How many sheets are included?
The workbook includes 7 sheet tabs: Overview, Market, Fleet, Riders, Trend, Data Sheet, and Support Sheet.
Can I add my own data?
Yes. Replace the sample rows in the Data Sheet using the same format, then click Refresh All from the Excel Data ribbon.
Does this require macros?
No. The dashboard is designed around Excel tables, pivot tables, charts, and slicers.
Can I customize the charts?
Yes. You can edit labels, colors, pivots, slicers, fields, and source data structure if you are comfortable with Excel.
Is it a subscription?
No. This is a one-time downloadable Excel template.
About the Author
Built by PK – Microsoft Certified Professional with 15+ years of Excel, Google Sheets, and Power BI experience. Founder of NextGenTemplates, reaching 300K+ subscribers across YouTube channels. Every template is hand-built and tested before release.
Explore Related Templates
Browse more Excel templates and Excel dashboard templates. Related options include EV Fleet Dashboard in Google Sheets, Last-mile Delivery Dashboard in Power BI, and Logistics Management System Web App.
Download the Micro-Mobility Platforms Dashboard in Excel to monitor city, fleet, rider, market, cost, revenue, and profitability trends in one editable workbook.
Last updated: July 10, 2026.


















Reviews
There are no reviews yet.