

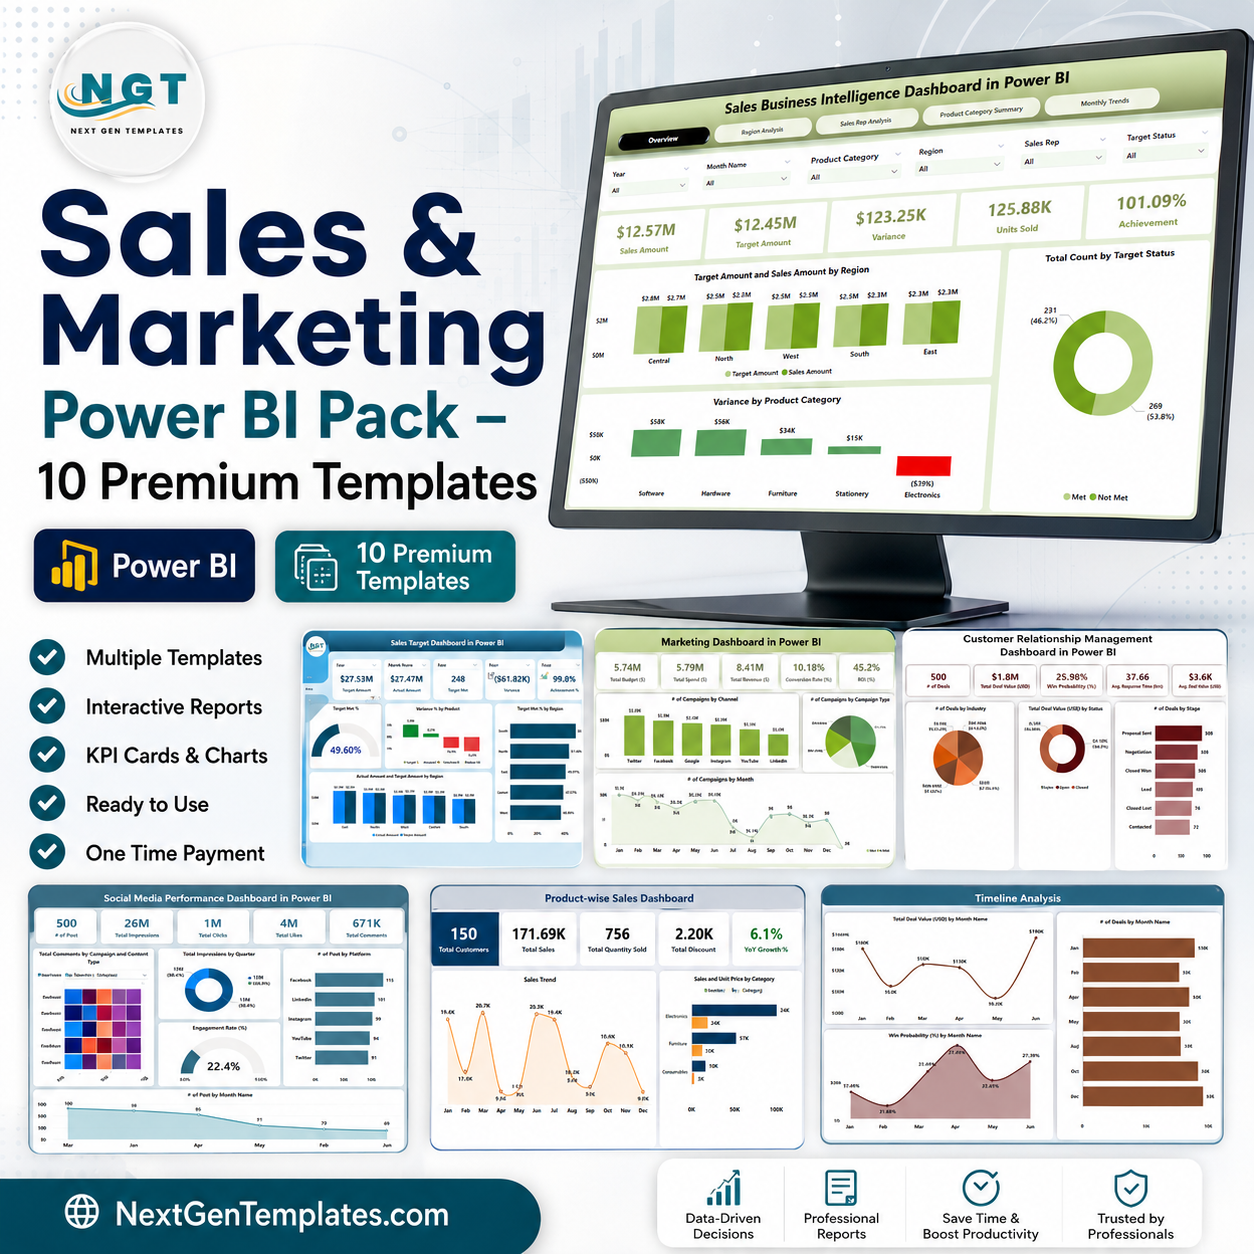

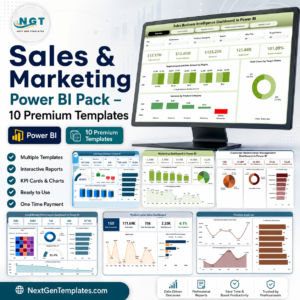
Stop paying for ten separate dashboards. The Sales & Marketing Power BI Pack brings together 10 premium, ready-to-use Power BI dashboards that cover your entire revenue engine — from recruitment and CRM to sales targets, channel profitability, marketing ROI, social media, and customer satisfaction. Buy them individually and you pay $179.90. Get the complete pack today for just $100.99 and save $78.91 (44% off). Every dashboard is built on native Power BI with simple Excel data sources, so your Sales Ops and Marketing Analytics teams can plug in data and start making decisions in minutes.
🔑 Key Features of the Sales & Marketing Power BI Pack
- 📊 10 Interactive Power BI Dashboards – a complete sales & marketing analytics suite in one download
- 💰 Save 44% vs Individual Purchase – $179.90 worth of templates for only $100.99
- 🎯 Full Funnel Coverage – recruitment pipeline, CRM, sales targets, channel & product-wise sales
- 📣 Marketing Analytics Built In – marketing ROI, campaign performance & social media dashboards
- 😊 Customer Insight Dashboards – CRM performance & customer satisfaction tracking
- 🧭 Interactive Slicers & Drill-Downs – filter by region, rep, product, channel, month & source
- 🔄 Excel-Powered & Refreshable – update your data, click Refresh, and every visual updates automatically
- 📈 Executive-Ready KPI Cards – gross/net sales, margin %, achievement %, ROI, satisfaction & more
- ⚙️ Fully Customizable – edit KPIs, colors, and visuals to match your brand and data model
- 💼 One-Time Purchase – no subscriptions, no recurring fees, lifetime access
📦 What’s Inside the Sales & Marketing Power BI Pack
All 10 dashboards are included as ready-to-use Power BI (.pbix) files with Excel data sources:
1. Recruitment Pipeline Dashboard in Power BI – Track applications, hiring stages, source performance, interview success, time-to-hire and salary trends across your recruitment funnel.

Recruitment Pipeline Dashboard in Power BI
2. Customer Relationship Management Dashboard in Power BI – Monitor deals, win rates, account-manager performance, lead sources, industries and timelines in one CRM view.
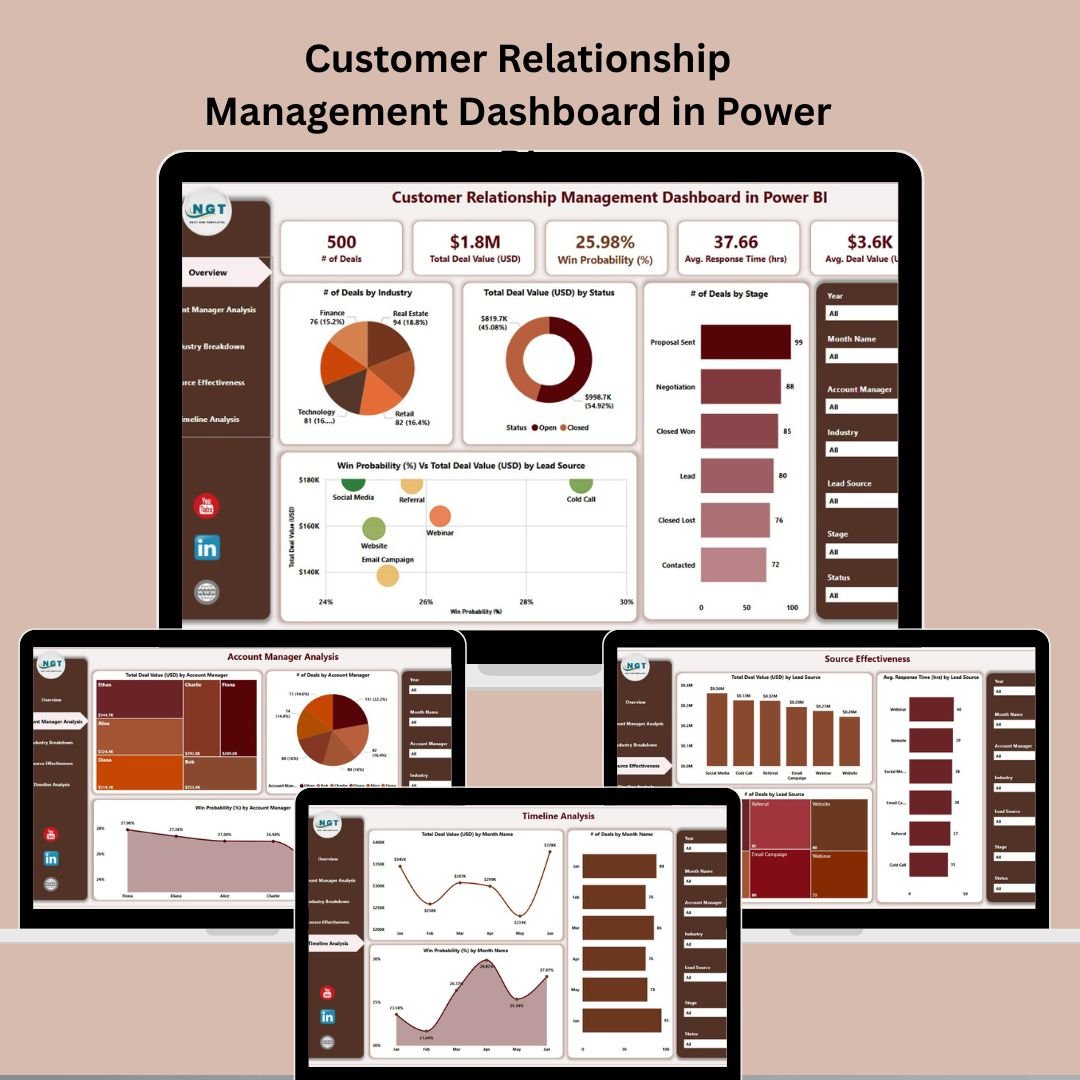
Customer Relationship Management Dashboard in Power BI
3. Sales Business Intelligence Dashboard in Power BI – A full sales command center with region, sales-rep, product-category and monthly-trend analysis plus achievement KPIs.
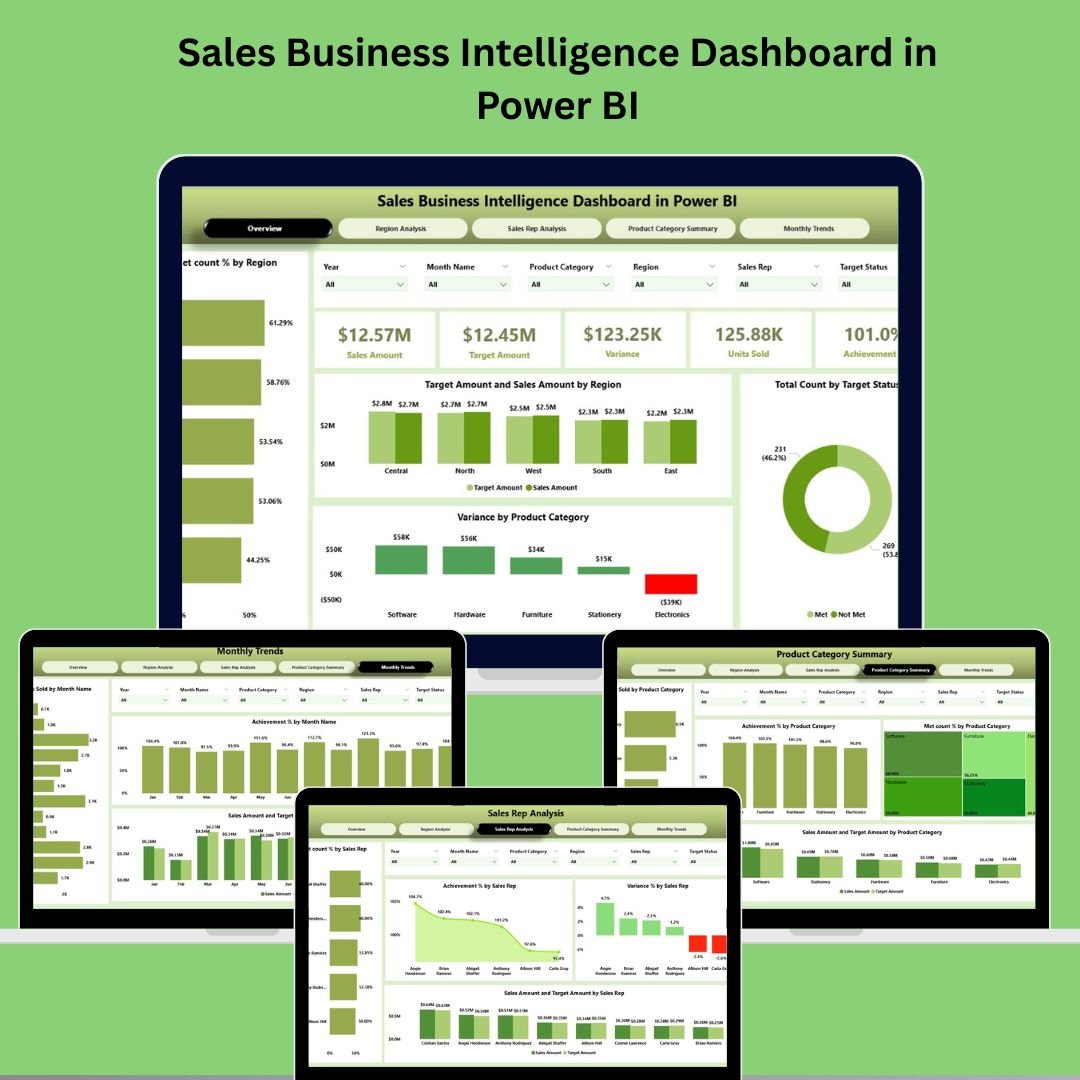
Sales Business Intelligence Dashboard in Power BI
4. Sales Target Dashboard in Power BI – Compare actual vs target by region, rep and product with Target Met %, Variance % and MTD/YTD comparisons.
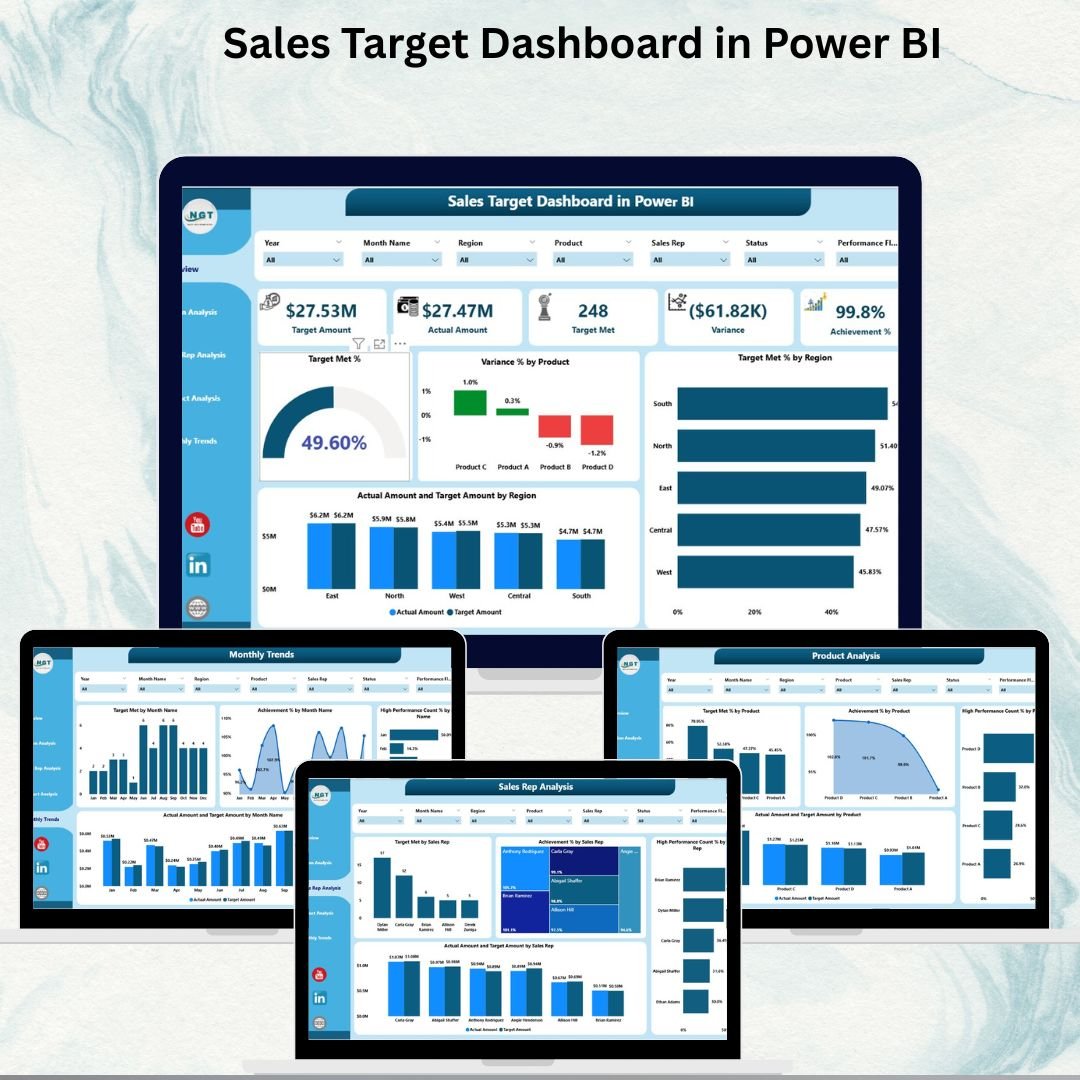
Sales Target Dashboard in Power BI
5. Social Media Performance Dashboard in Power BI – Track engagement, impressions, campaigns, platform performance and team contributions across 5 pages.
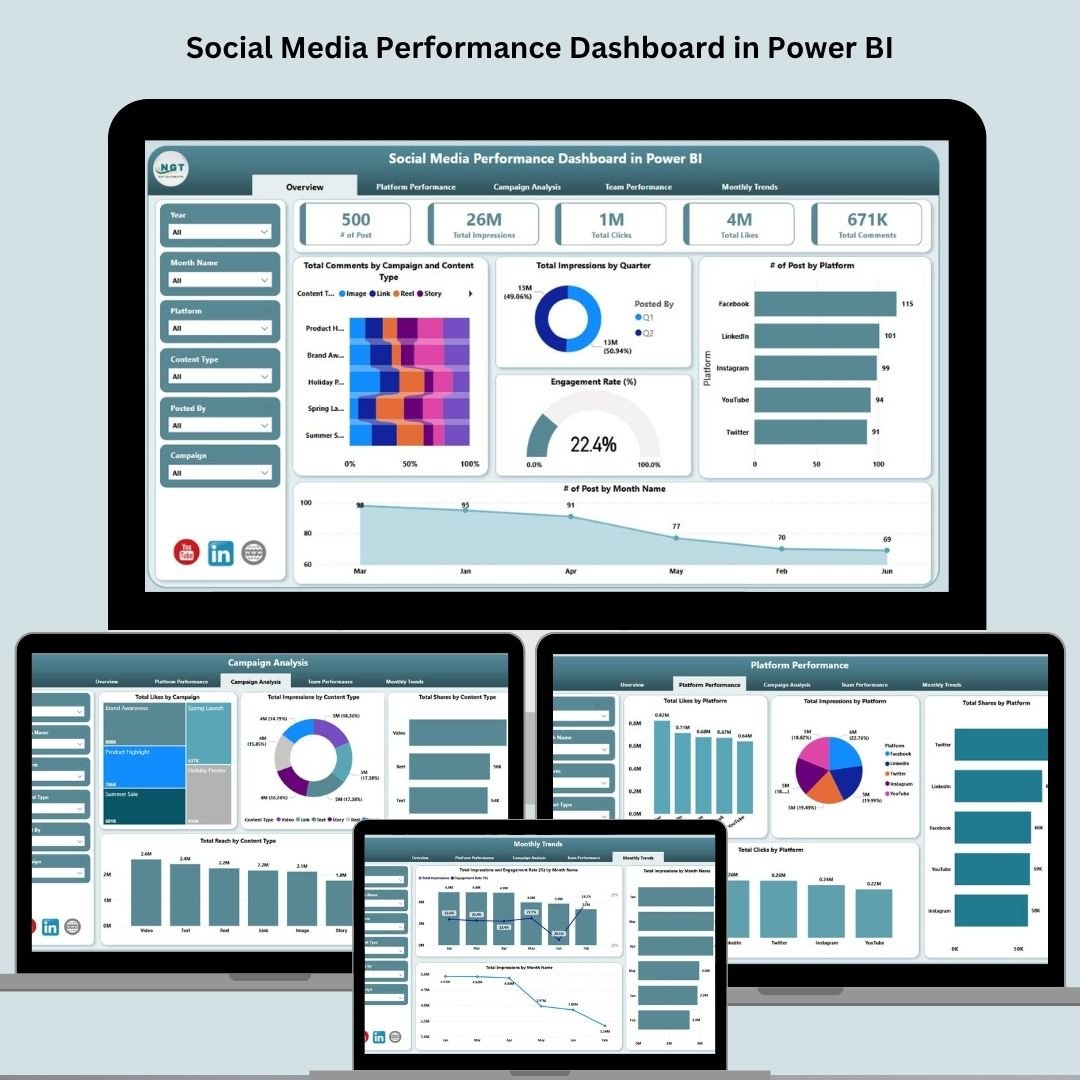
Social Media Performance Dashboard in Power BI
6. Marketing Dashboard in Power BI – Monitor spend, revenue, ROI, budget vs spend, conversions and campaign details with drill-through reporting.

Marketing Dashboard in Power BI
7. Product-wise Sales Dashboard in Power BI – Analyze product-level sales, quantity, discounts, YOY growth and a decomposition tree for deep insights.
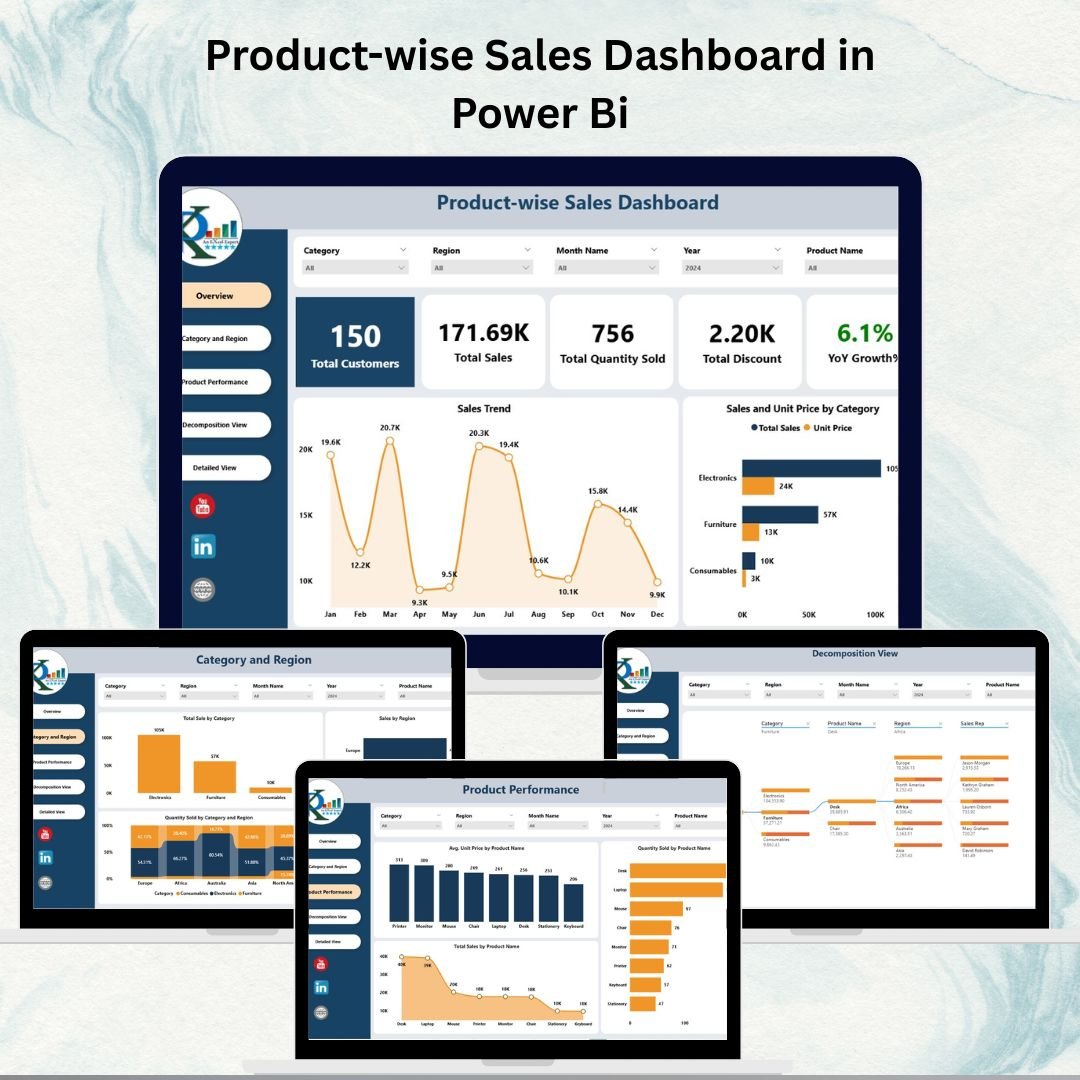
Product-wise Sales Dashboard in Power BI
8. Customer Satisfaction Dashboard in Power BI – Measure tickets, satisfaction scores, response/resolution times, SLA breaches and channel performance.

Customer Satisfaction Dashboard in Power BI
9. Channel Sales Dashboard in Power BI – Compare profitability across direct, distributor, reseller and online channels by region, product and customer segment.
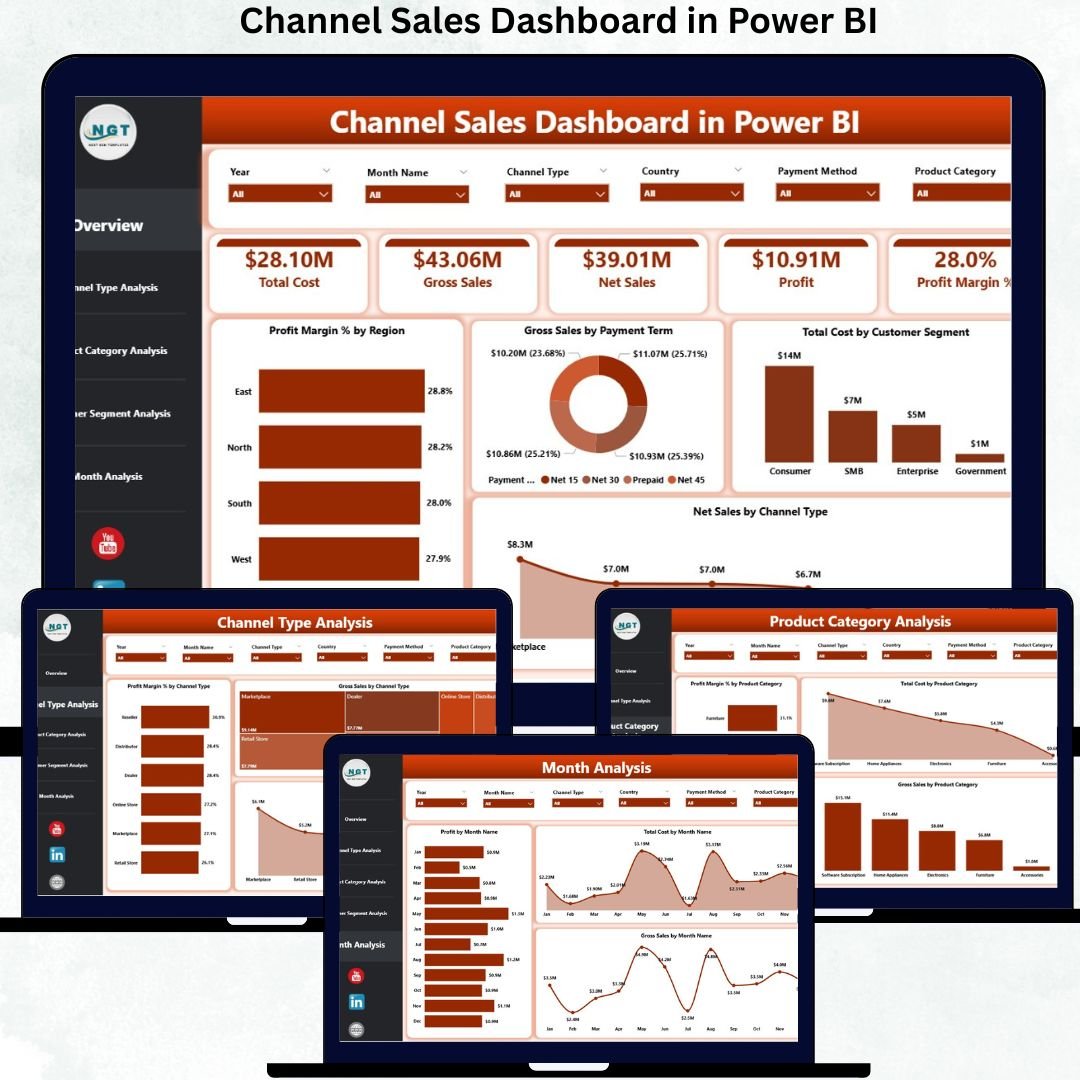
Channel Sales Dashboard in Power BI
10. Sales Dashboard in Power BI – Track gross/net sales, margin %, discount impact, shipping cost %, lead source, region and monthly trends.
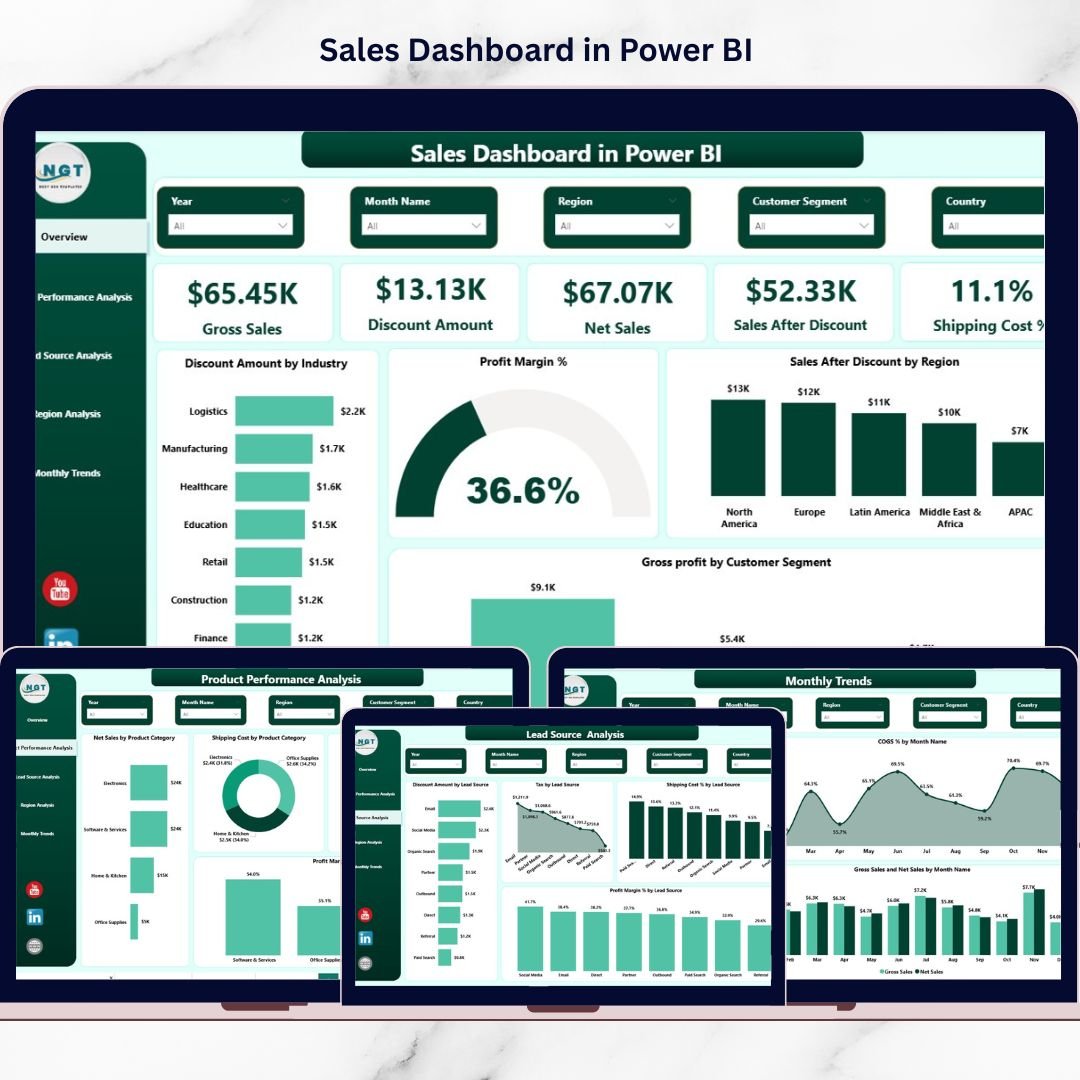
Sales Dashboard in Power BI
💡 Smart Comparison — Individual vs Bundle
| Option | Templates | Price | You Save |
|---|---|---|---|
| Buying Individually | 10 | $179.90 | — |
| Sales & Marketing Power BI Pack ✅ | 10 | $100.99 | $78.91 (44%) |
📑 Product Breakdown
| # | Dashboard | Platform | Individual Price |
|---|---|---|---|
| 1 | Recruitment Pipeline Dashboard | Power BI | $17.99 |
| 2 | Customer Relationship Management Dashboard | Power BI | $17.99 |
| 3 | Sales Business Intelligence Dashboard | Power BI | $17.99 |
| 4 | Sales Target Dashboard | Power BI | $17.99 |
| 5 | Social Media Performance Dashboard | Power BI | $17.99 |
| 6 | Marketing Dashboard | Power BI | $17.99 |
| 7 | Product-wise Sales Dashboard | Power BI | $17.99 |
| 8 | Customer Satisfaction Dashboard | Power BI | $17.99 |
| 9 | Channel Sales Dashboard | Power BI | $17.99 |
| 10 | Sales Dashboard | Power BI | $17.99 |
| Total Individual Value | $179.90 | ||
| Bundle Price | $100.99 | ||
⚙️ How to Use the Sales & Marketing Power BI Pack
- Download the pack and unzip all 10 Power BI (.pbix) files with their Excel data sources.
- Open any dashboard in Power BI Desktop (free) and connect or refresh its Excel data.
- Enter your own sales, marketing, CRM or customer data into the provided Excel templates.
- Use the built-in slicers to filter by region, rep, product, channel, month or source.
- Publish to Power BI Service to share live, board-ready reports with your team.
👥 Who Can Benefit from This Bundle
- 🧑💼 Sales Operations Teams – track targets, channels, product performance and pipeline in one place
- 📊 Marketing Analysts – measure ROI, campaign performance and social media engagement
- 🏢 Business Owners & Founders – get a complete revenue view without hiring a BI team
- 📈 Sales & Marketing Managers – monitor reps, regions, customers and satisfaction at a glance
- 🎓 Consultants & Agencies – deliver polished client reporting with ready-made templates
Get All 10 Dashboards for One Low Price
Individual value $179.90 → $100.99
You Save $78.91 (44% Off)
🛒 Buy the Sales & Marketing Power BI Pack
📘 Click here to read the detailed blog post
📺 Visit our YouTube channel for step-by-step Power BI tutorials
Compatibility and Requirements
- Works in Power BI Desktop, which is free to download. Microsoft has the installer and setup steps in Get Power BI Desktop.
- Each dashboard reads its data from an Excel file, so you also need Microsoft Excel to edit the source data.
Frequently Asked Questions
How many dashboards are in this pack?
Ten Power BI dashboards: Recruitment Pipeline, Customer Relationship Management, Sales Business Intelligence, Sales Target, Social Media Performance, Marketing, Product-wise Sales, Customer Satisfaction, Channel Sales and Sales.
Do I need a paid Power BI license?
You can open and edit the files in Power BI Desktop, which is free. Publishing to Power BI Service to share reports with your team is a separate step covered in the How to Use section.
Where does the data come from?
Each dashboard uses an Excel data source. You enter your own sales, marketing, CRM or customer data in the provided Excel templates, then click Refresh in Power BI.
Can I filter the dashboards by region, rep or product?
Yes. The dashboards include slicers, for example by region, rep, product, channel, month and source, depending on the dashboard.
Can I change the KPIs, colors and visuals?
Yes. You can edit the KPIs, colors and visuals to match your brand and your data model.
Can I buy the dashboards one at a time?
Yes. Each dashboard in the pack is also sold on its own, for example the Sales Dashboard in Power BI and the Marketing Dashboard in Power BI. The pack costs less than buying all ten separately.
Related Sales and Marketing Templates
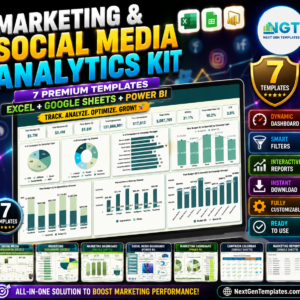
- Marketing and Social Media Analytics Kit: 7 templates for Excel, Google Sheets and Power BI
- Marketing Manager Toolkit: 9 templates for Excel and Google Sheets
- Sales and Marketing Operations KPI Dashboard in Excel: the same topic in Excel
- Sales and Marketing Growth Metrics KPI Dashboard in Excel: growth metrics in Excel
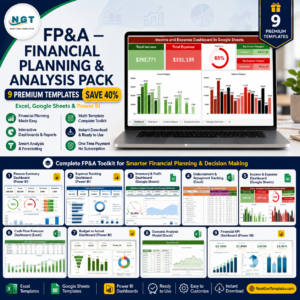
- FP&A Financial Planning and Analysis Pack: finance templates in Excel, Google Sheets and Power BI
Browse all Power BI dashboards or template bundles.


Reviews
There are no reviews yet.