


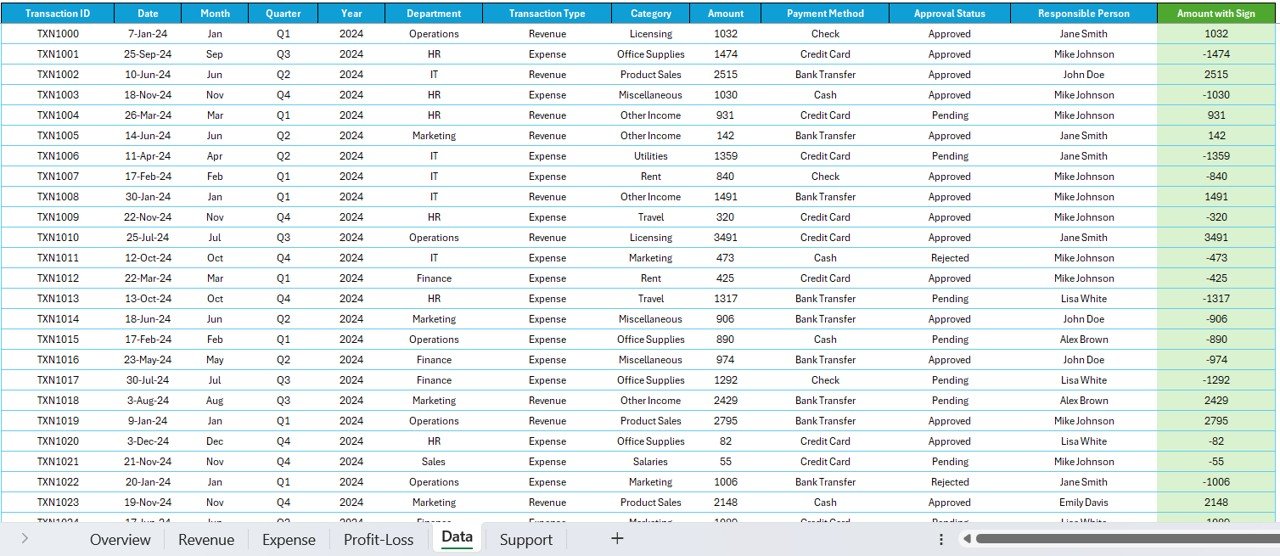




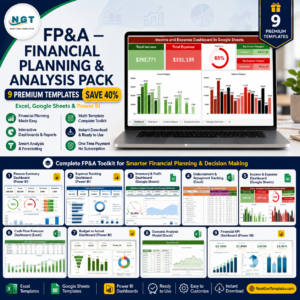
The FP&A — Financial Planning & Analysis Pack is the complete finance toolkit for FP&A analysts and finance managers who are tired of juggling disconnected spreadsheets. It bundles 9 premium finance dashboards across Excel, Google Sheets and Power BI — covering income, expenses, cash flow, revenue, profitability, loans, inventory, procurement and freight. Bought individually these templates cost $143.91; as a bundle you pay just $85.99 and save 40% ($57.92).
🔑 Key Features of the FP&A — Financial Planning & Analysis Pack
🔹 9 Ready-to-Use Templates – a full FP&A stack covering finance summaries, expenses, loans, revenue, procurement, freight, inventory and church finance.
🔹 Excel + Google Sheets + Power BI – native templates for every workflow, all in one pack.
🔹 Save $57.92 vs Buying Individually – individual total $143.91, bundle just $85.99 (40% off).
🔹 Income, Expense & Cash Flow Tracking – full visibility into financial health.
🔹 Revenue & Profit Margin Analysis – spot trends and optimize profitability.
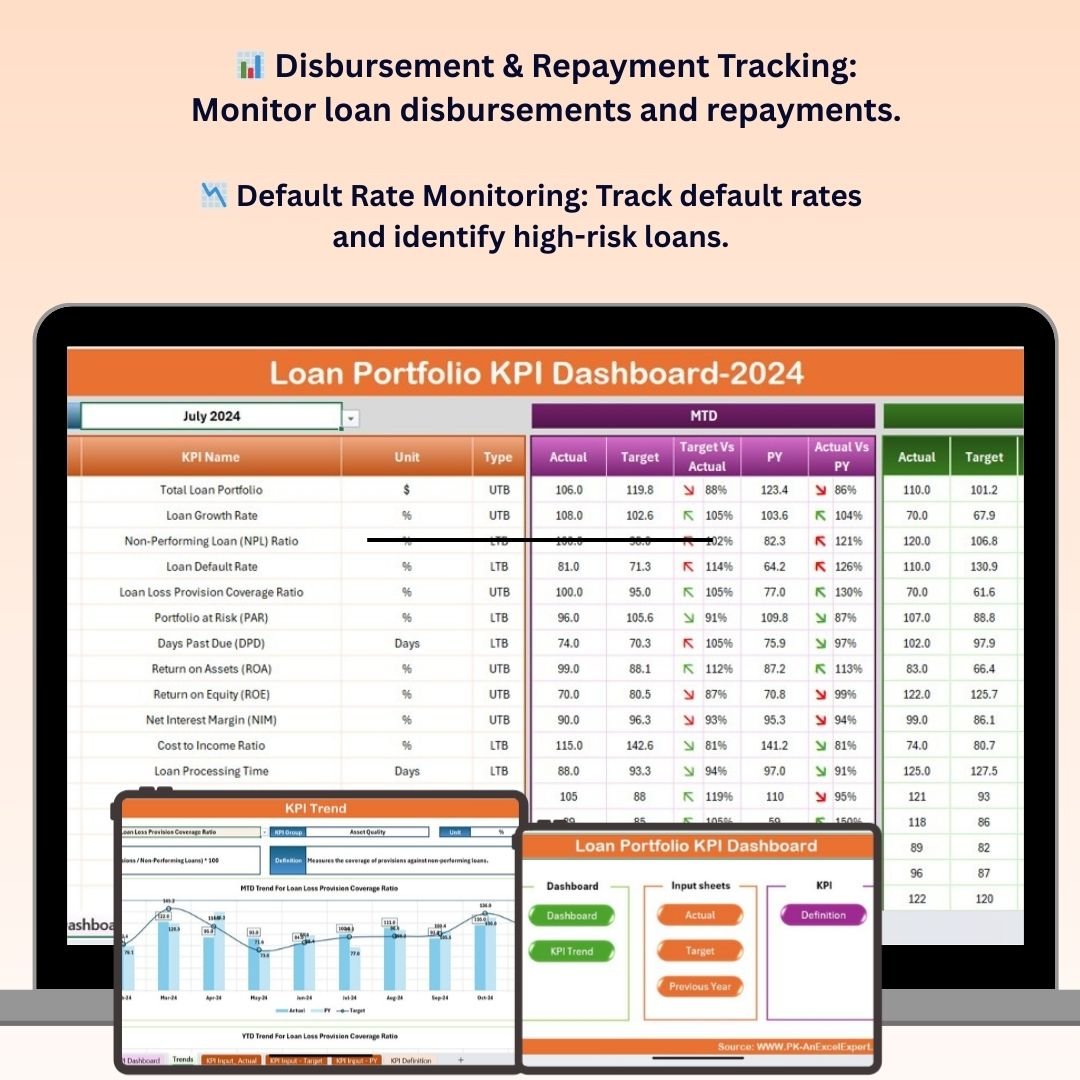
🔹 Loan Portfolio & Risk KPIs – track disbursements, repayments and default rates.
🔹 Procurement & Freight Cost Control – monitor vendor spend and logistics costs.
🔹 Interactive Charts, KPI Cards & Slicers – drill down by department, region, vendor and month.
🔹 Plug-and-Play Setup – replace the sample data and everything updates automatically.
🔹 Perfect for FP&A Analysts & Finance Managers – enterprise-grade analytics at a fraction of the cost.
📦 What’s Inside the FP&A Pack
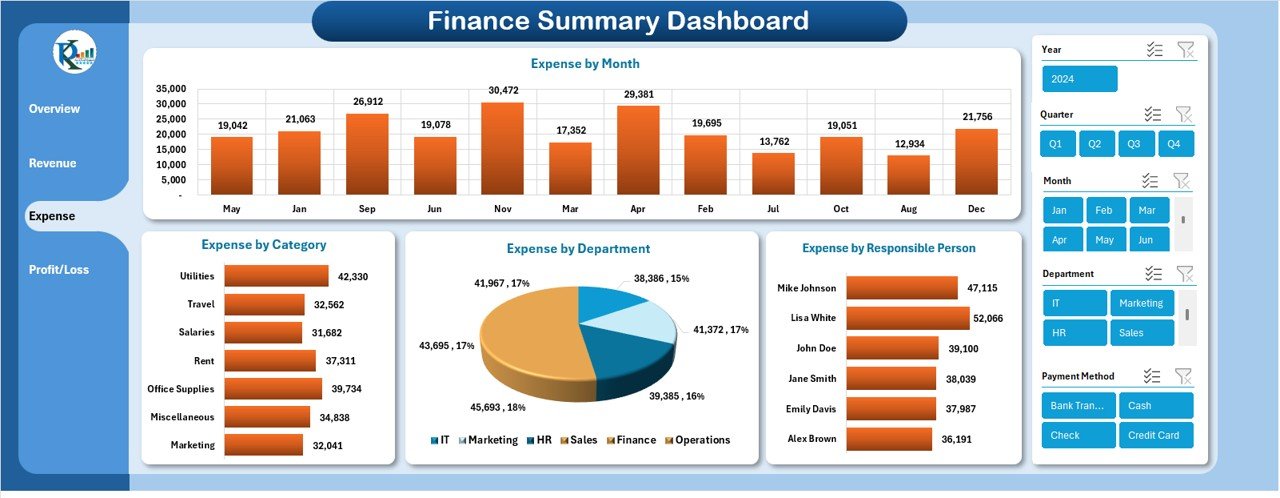
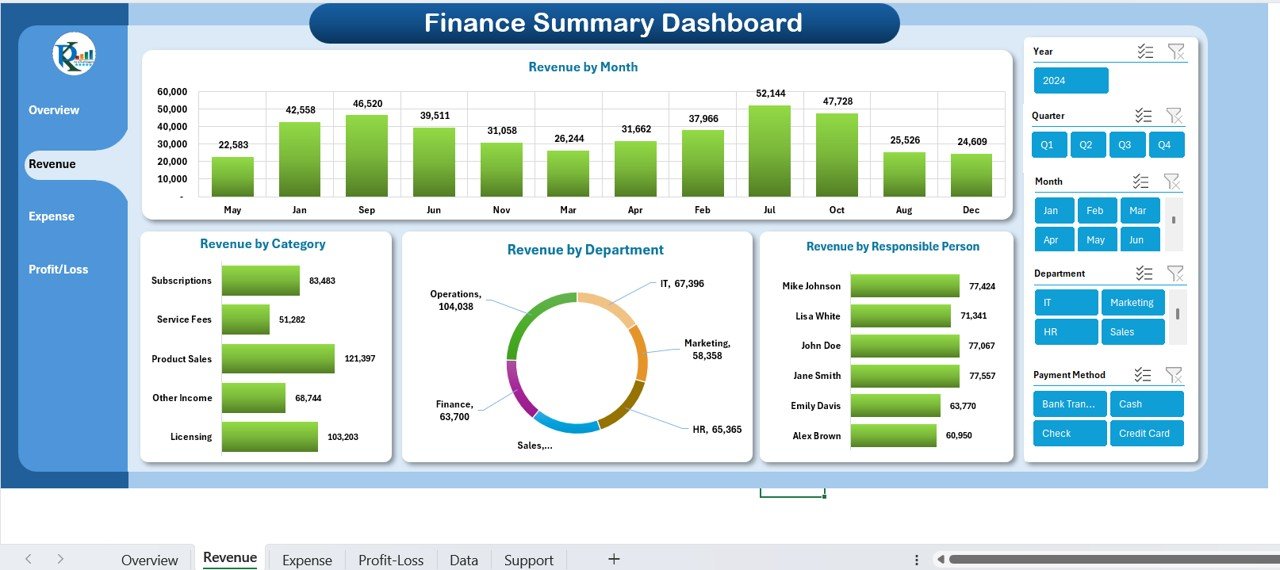
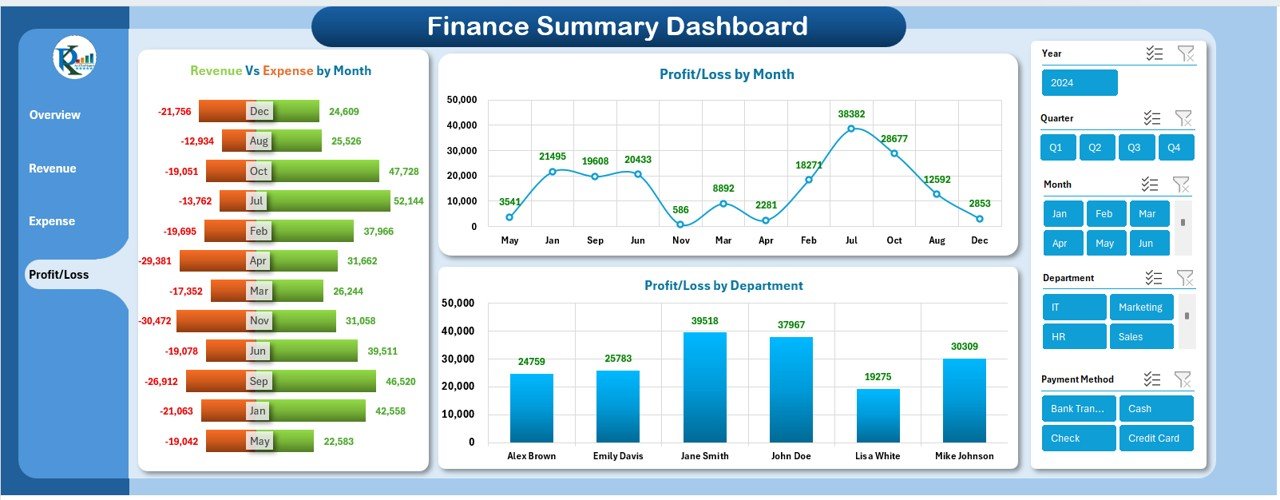
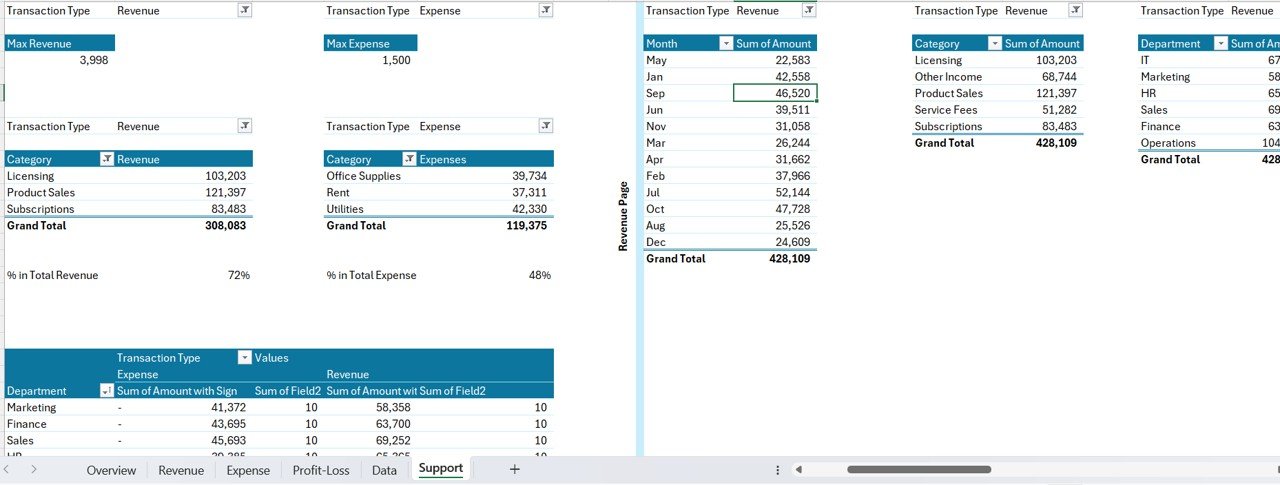
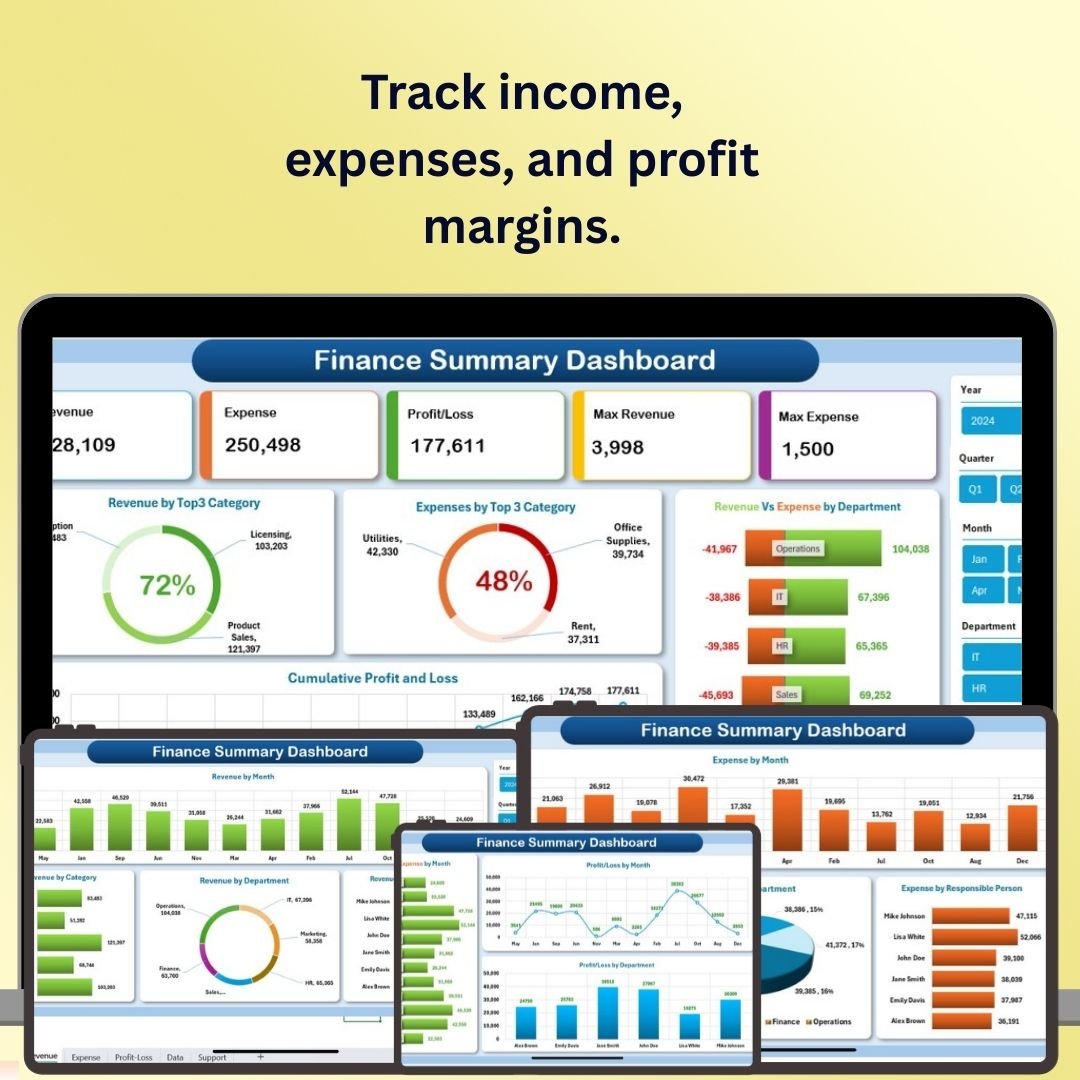
- Finance Summary Dashboard in Excel – complete overview of income, expenses, profit margins and cash flow.

Finance Summary Dashboard in Excel
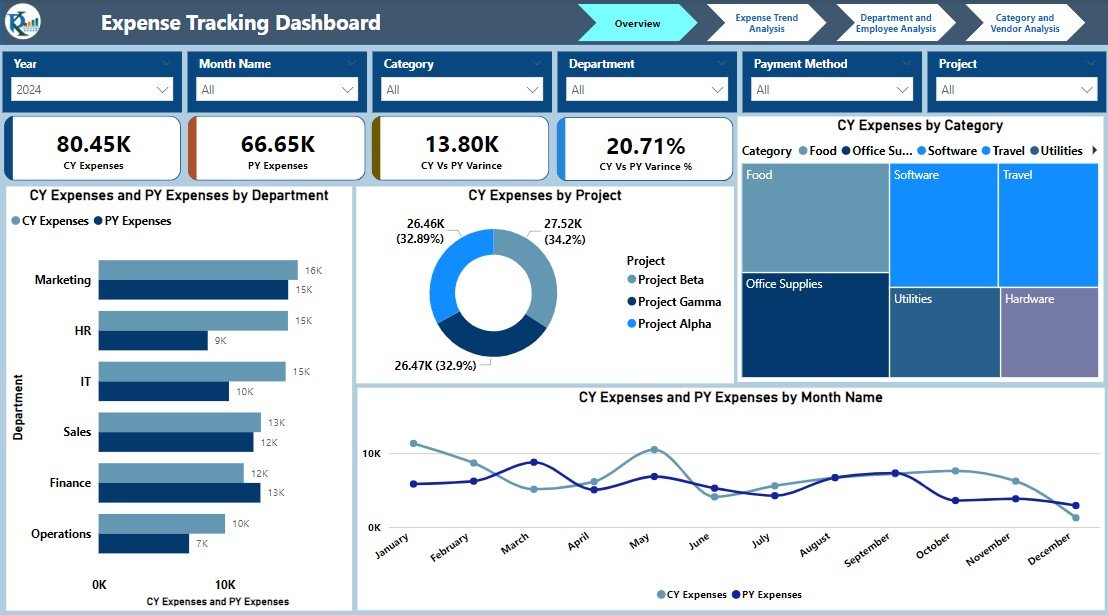
- Expense Tracking Dashboard in Power BI – analyze spending across departments, categories and vendors with CY-vs-PY variance.
Expense Tracking Dashboard in Power BI
- Income and Expense Dashboard in Google Sheets – real-time cloud tracker with automatic categorization and net-savings calculations.
Income and Expense Dashboard in Google Sheets
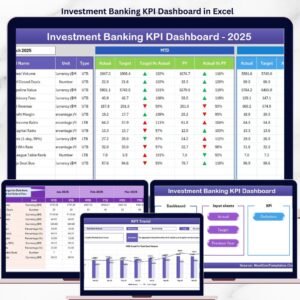
- Loan Portfolio KPI Dashboard in Excel – monitor disbursements, repayments, default rates and portfolio growth.
Loan Portfolio KPI Dashboard in Excel
- Inventory Management & Profit Analysis Dashboard in Google Sheets – track stock while auto-calculating profit margins and turnover.
Inventory Management and Profit Analysis Dashboard in Google Sheets
- Freight Cost KPI Dashboard in Excel – track freight costs, cost per shipment, delivery times and carrier performance.
Freight Cost KPI Dashboard in Excel
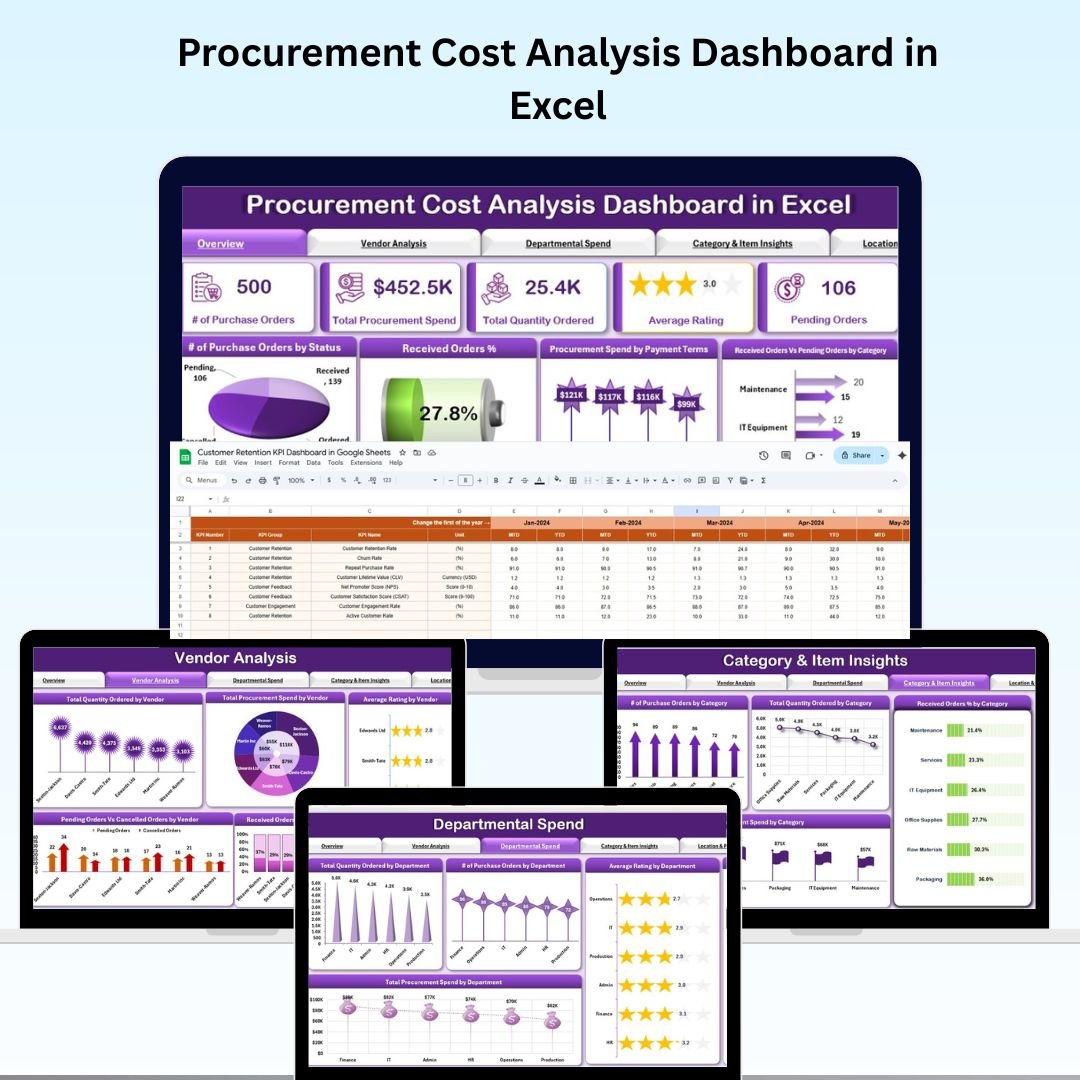
- Procurement Cost Analysis Dashboard in Excel – monitor purchase orders, total spend, vendor performance and departmental budgets.
Procurement Cost Analysis Dashboard in Excel
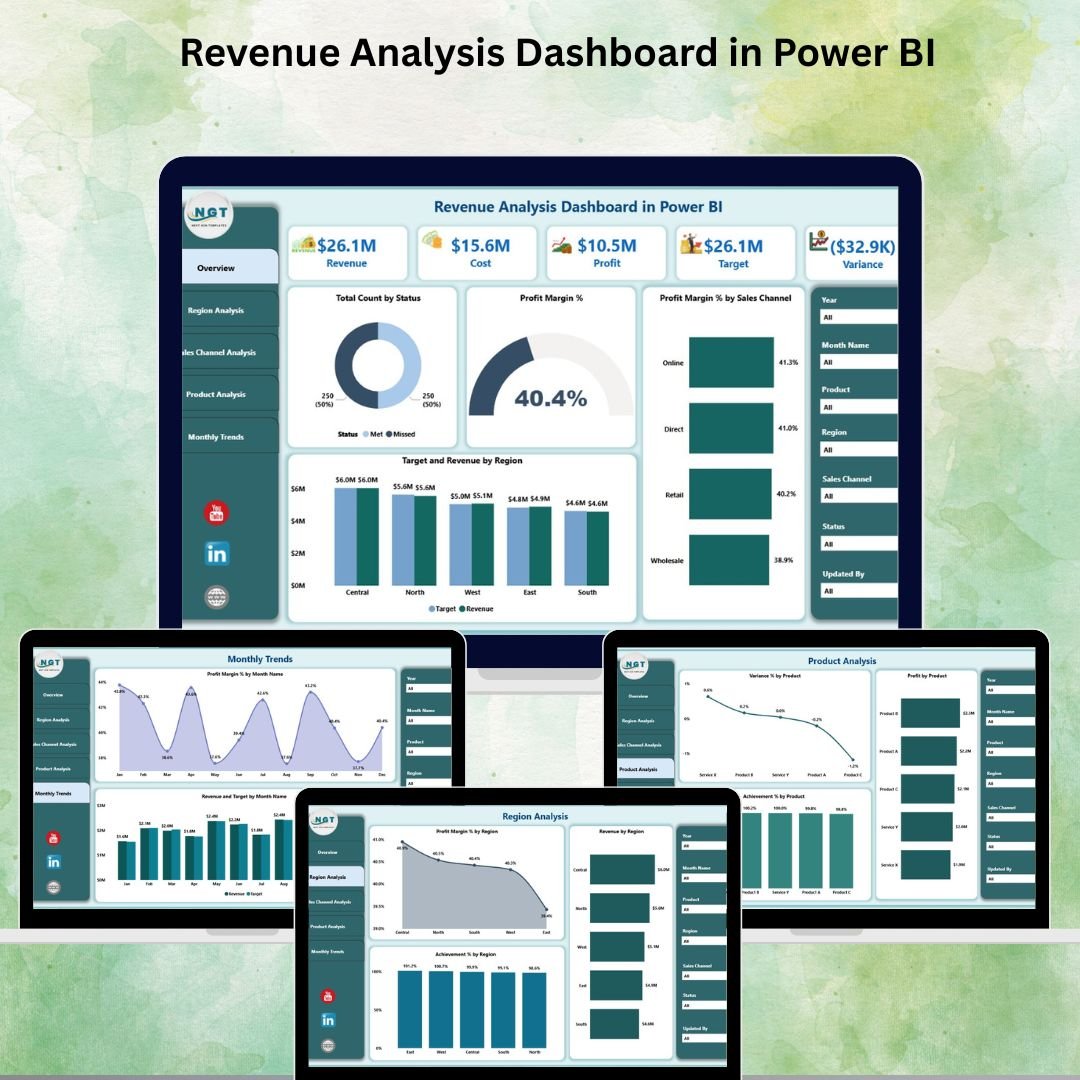
- Revenue Analysis Dashboard in Power BI – 5 pages of revenue intelligence with KPI cards for revenue, margin % and target achievement.
Revenue Analysis Dashboard in Power BI
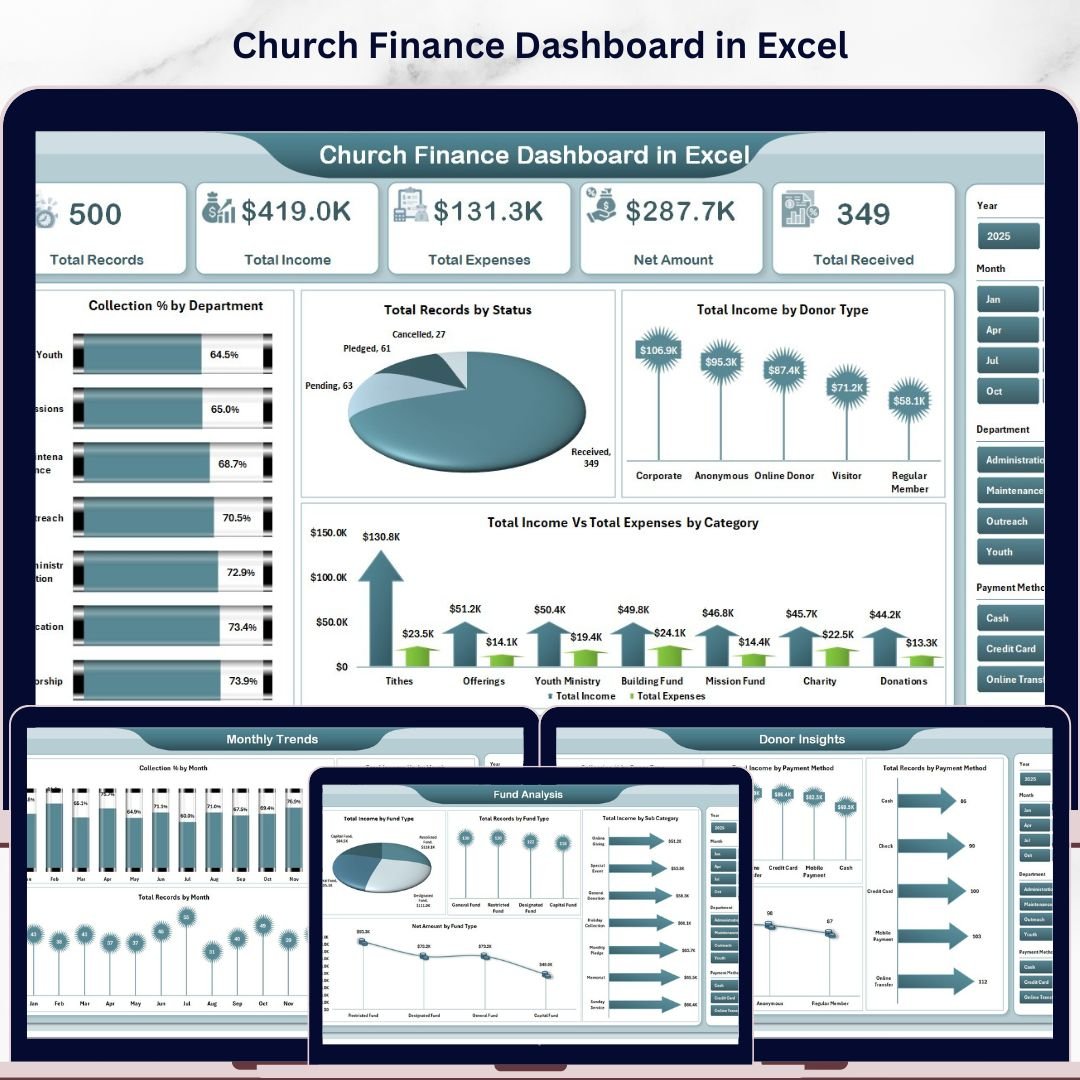
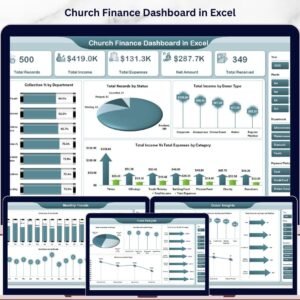
- Church Finance Dashboard in Excel – track tithes, offerings, departmental expenses and donor contributions across 5 pages and 19 charts.
Church Finance Dashboard in Excel




💡 Smart Comparison — Individual vs Bundle
| # | Template | Platform | Individual Price |
|---|---|---|---|
| 1 | Finance Summary Dashboard | Excel | $17.99 |
| 2 | Expense Tracking Dashboard | Power BI | $17.99 |
| 3 | Income & Expense Dashboard | Google Sheets | $9.99 |
| 4 | Loan Portfolio KPI Dashboard | Excel | $12.99 |
| 5 | Inventory Mgmt & Profit Analysis | Google Sheets | $17.99 |
| 6 | Freight Cost KPI Dashboard | Excel | $12.99 |
| 7 | Procurement Cost Analysis | Excel | $17.99 |
| 8 | Revenue Analysis Dashboard | Power BI | $17.99 |
| 9 | Church Finance Dashboard | Excel | $17.99 |
| Individual Total | $143.91 | ||
| FP&A Bundle Price | $85.99 (Save 40%) | ||
⚙️ How to Use the FP&A Pack
1️⃣ Download the Bundle – instantly access all 9 templates after purchase.
2️⃣ Open Each Template – in Excel, Google Sheets or Power BI Desktop as appropriate.
3️⃣ Enter Your Data – replace the sample data in each data sheet with your own.
4️⃣ Refresh & Analyze – charts, KPI cards and pivot tables update automatically.
5️⃣ Filter & Present – use slicers to build stakeholder views and share your reports.
👥 Who Can Benefit from This FP&A Pack
🔹 FP&A Analysts & Finance Managers
🔹 CFOs & Finance Directors
🔹 Business Owners & Entrepreneurs
🔹 Accountants & Bookkeepers
🔹 Lenders & Credit Analysts
🔹 Procurement & Supply Chain Teams
🔹 Nonprofits, Ministries & Treasurers
Get All 9 Finance Dashboards in One Pack
Was $143.91 → Now $85.99
Save 40% ($57.92)
📖 Click here to read the detailed blog post
🎥 Visit our YouTube channel to learn step-by-step video tutorials
👉 Youtube.com/@PKAnExcelExpert
Compatibility and Requirements
- The pack has Excel, Google Sheets and Power BI templates, so check the platform of each dashboard in the list above.
- Excel dashboards work in Microsoft Excel desktop (Excel 2016 or later, or Microsoft 365). Microsoft explains how to use slicers to filter data.
- Google Sheets dashboards need a free Google account and a web browser.
- Power BI dashboards open in Power BI Desktop, which is free.
Frequently Asked Questions
How many templates are in the FP&A Pack?
Nine: Finance Summary, Expense Tracking, Income and Expense, Loan Portfolio KPI, Inventory Management and Profit Analysis, Freight Cost KPI, Procurement Cost Analysis, Revenue Analysis and Church Finance dashboards.
Which platforms does the pack cover?
Excel, Google Sheets and Power BI. Four dashboards are in Excel, two in Google Sheets and two in Power BI, plus the Church Finance Dashboard in Excel.
How do I load my own numbers?
Replace the sample data in each data sheet with your own. Charts, KPI cards and pivot tables update automatically.
Can I filter the dashboards by department, vendor or month?
Yes. The dashboards use slicers, so you can drill down by department, region, vendor and month to build stakeholder views.
How much do I save compared with buying each template separately?
The nine templates cost $143.91 individually. The bundle costs $85.99, which saves $57.92 (40%).
Related Finance Templates
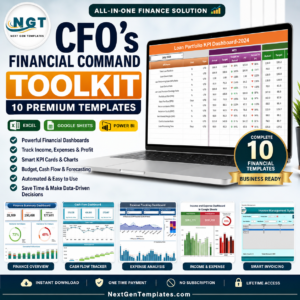
- CFO’s Financial Command Toolkit: 10 finance templates across Excel, Google Sheets and Power BI
- Financial Planning KPI Dashboard in Excel: planning KPIs in a single Excel dashboard
- Financial Planning KPI Dashboard in Power BI: the same topic for Power BI users
- Financial Planning KPI Dashboard in Google Sheets: the Google Sheets version
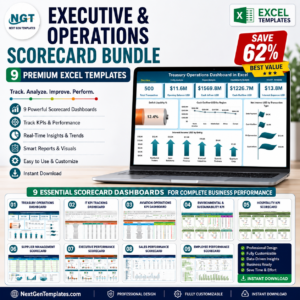
- Executive & Operations Scorecard Bundle: Excel scorecards for leadership reporting
Browse all template bundles or Excel financial tools.



Reviews
There are no reviews yet.