

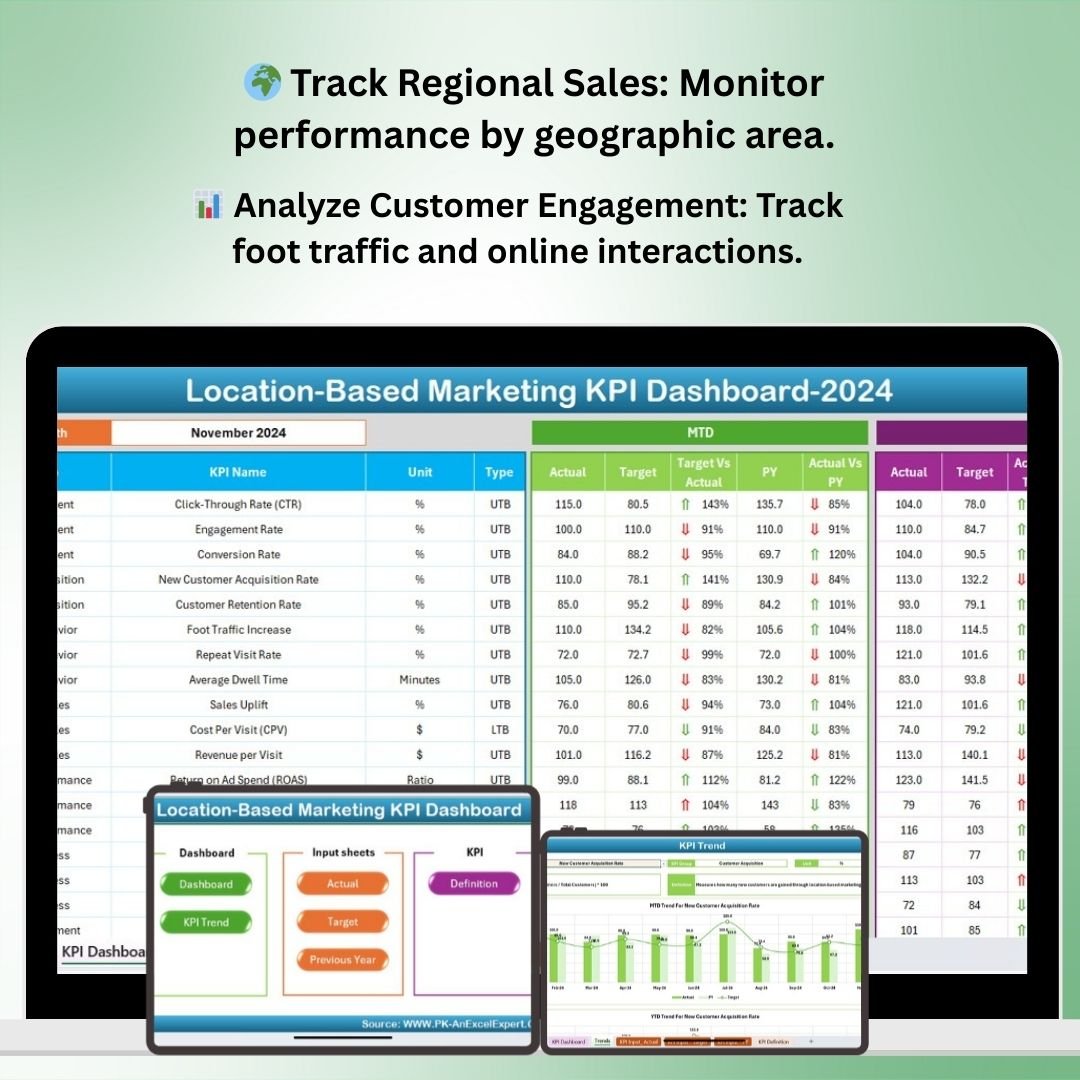
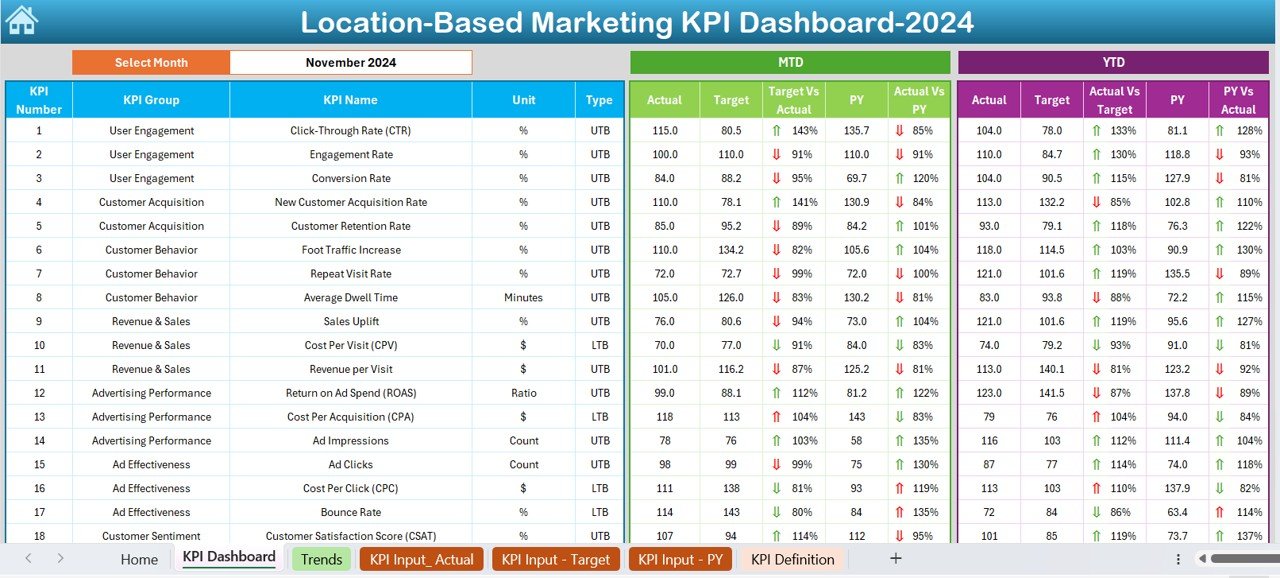
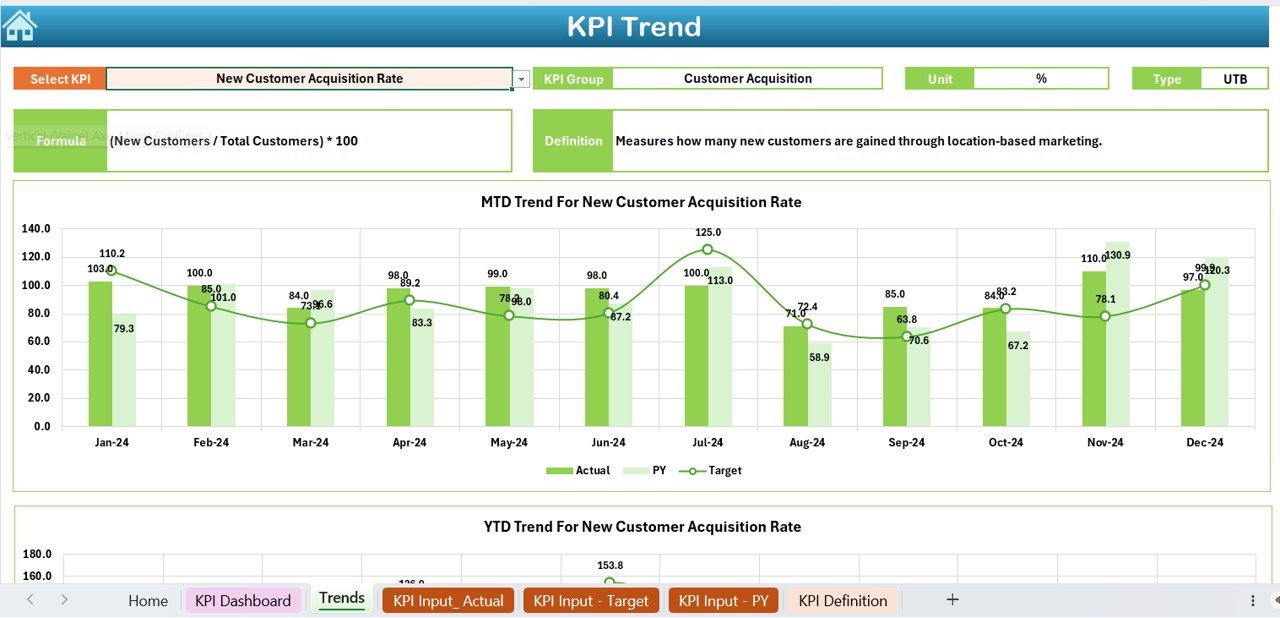
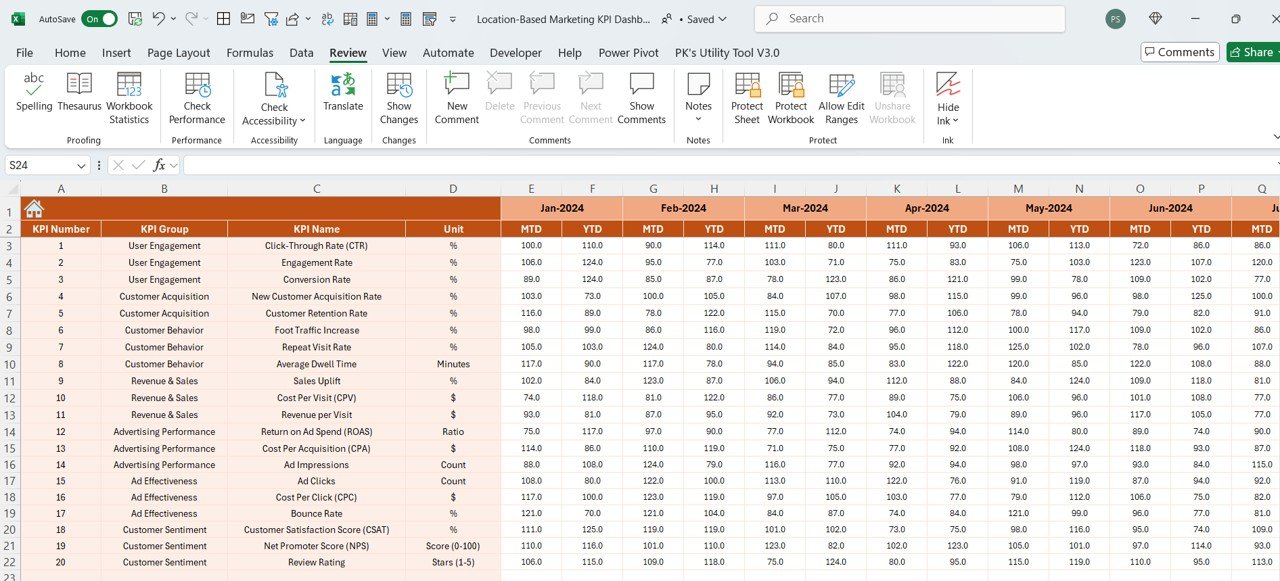
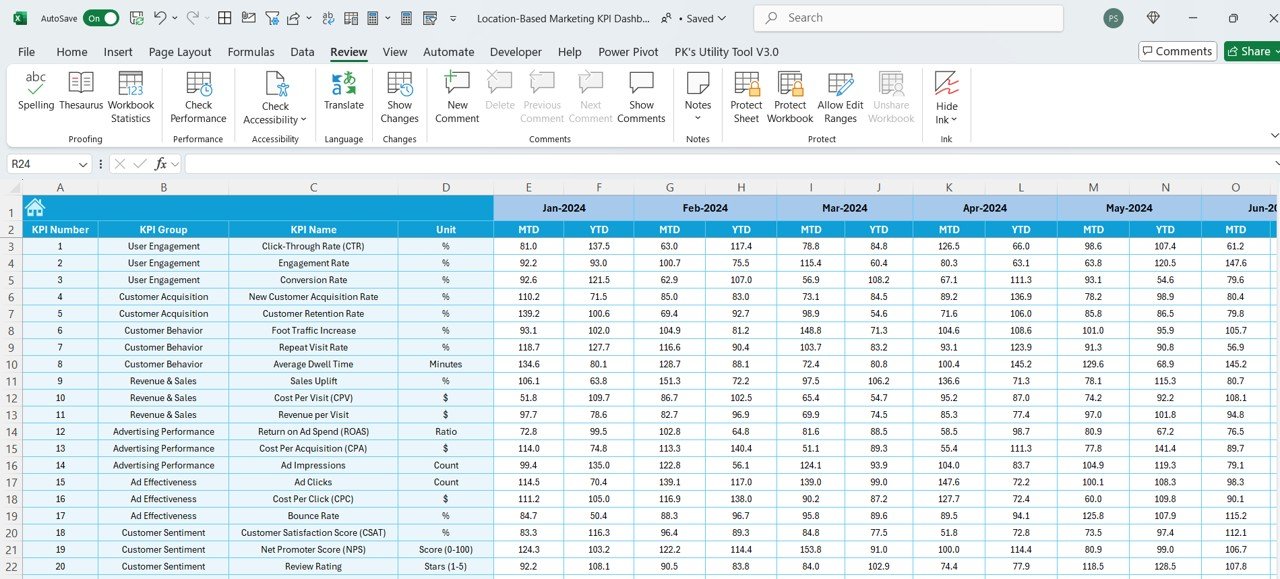
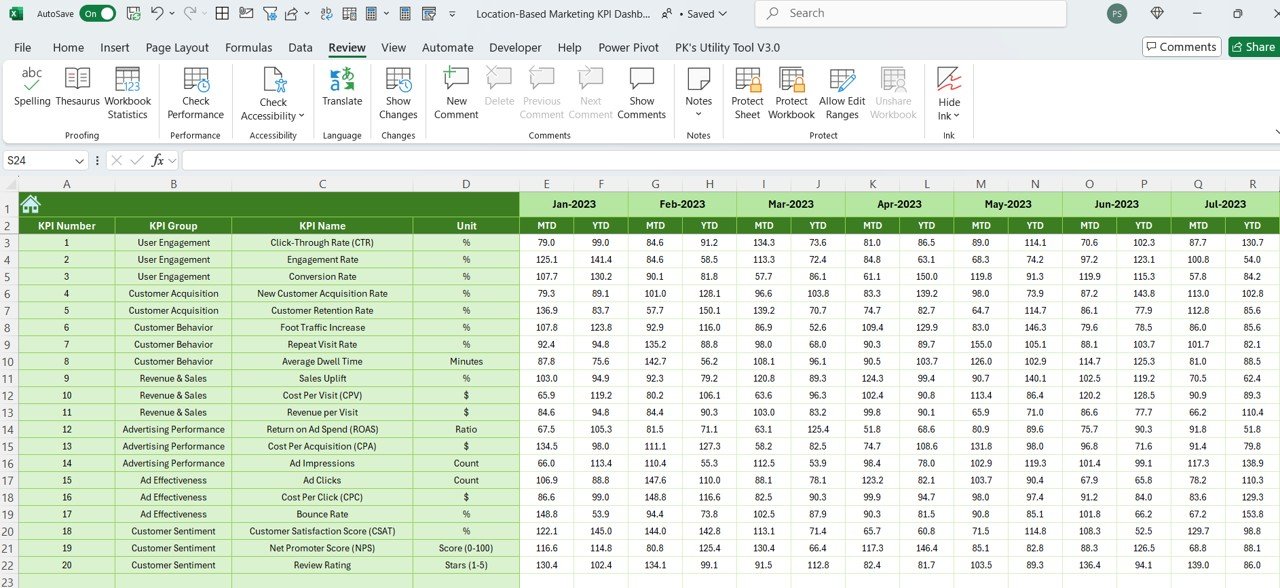
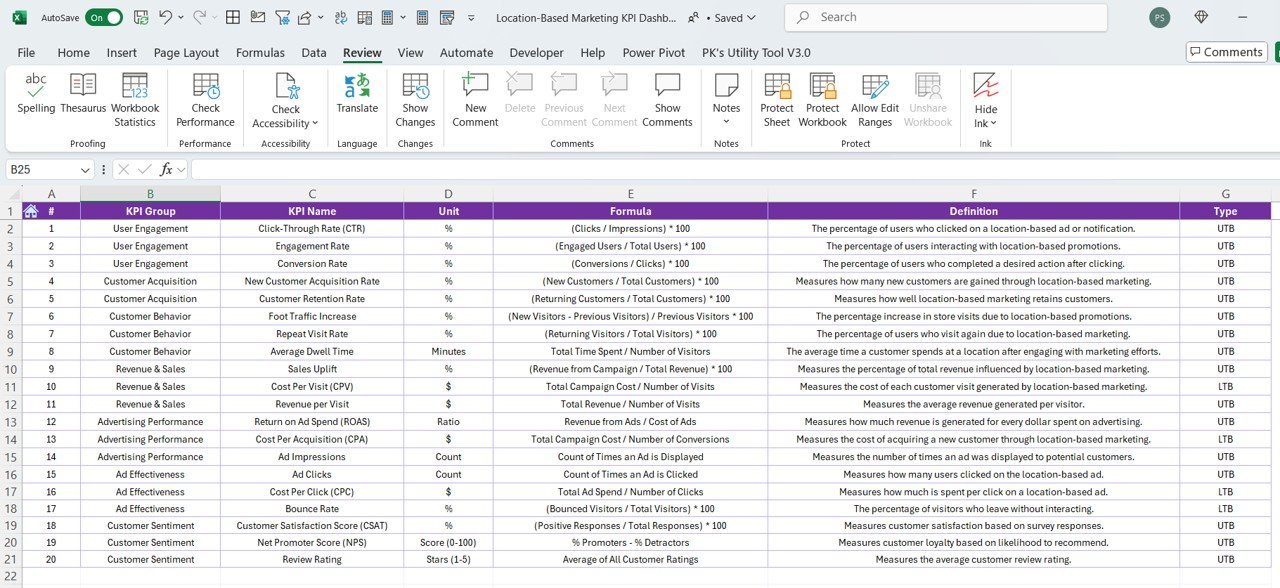

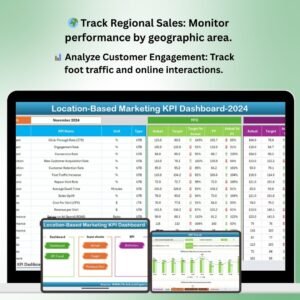
The Location-Based Marketing KPI Dashboard in Excel is an essential tool for businesses that use geographic data to target and engage their customers. Whether you are running campaigns based on customer location, tracking foot traffic, or measuring sales in specific regions, this interactive Excel dashboard allows you to track all the key performance indicators (KPIs) related to your location-based marketing strategies.
With the ability to monitor metrics such as regional sales, customer engagement, and marketing ROI, this dashboard helps you evaluate the effectiveness of your location-based marketing campaigns in real-time. The customizable design makes it easy to adapt the dashboard to suit the specific needs of your business.
Key Features of the Location-Based Marketing KPI Dashboard in Excel
🌍 Track Regional Sales & Performance
Monitor sales and performance by region, allowing you to assess the impact of your location-based marketing campaigns. Use the dashboard to identify high-performing areas and areas for improvement.
📊 Customer Engagement Tracking
Track customer engagement metrics such as foot traffic, online interactions, and in-store visits. Understand how your marketing campaigns influence customer behavior in different geographic areas.
💰 ROI & Campaign Effectiveness
Measure the return on investment (ROI) of your location-based marketing campaigns. Track how effective your campaigns are at driving sales and customer engagement in specific locations.
📈 Visualize Geographic Performance
Use visual charts and maps to display the performance of your marketing campaigns across different locations. Identify patterns and trends in customer behavior and sales based on geographic data.
🖥️ Customizable & Interactive Dashboard
This Excel dashboard is fully customizable, allowing you to filter data by region, marketing channel, and time period. The interactive features let you drill down into specific areas and gain actionable insights.
Why You’ll Love the Location-Based Marketing KPI Dashboard in Excel
✅ Track Regional Marketing Performance
Easily monitor the performance of your marketing campaigns by region. Identify high-performing areas and adjust strategies for underperforming regions.
✅ Measure ROI for Location-Based Campaigns
Track how well your marketing campaigns are performing in different locations, ensuring that your marketing budget is being spent effectively.
✅ Understand Customer Engagement
Get insights into how your customers are engaging with your brand in different geographic areas. Track foot traffic, sales, and online interactions to improve your marketing efforts.
✅ Optimize Marketing Strategies
Analyze geographic data to optimize your location-based marketing strategies, ensuring that your campaigns are tailored to specific regional needs.
✅ Fully Customizable & Scalable
Adapt the dashboard to meet the unique needs of your business. Whether you’re tracking marketing performance in one region or across multiple locations, this dashboard scales to fit your requirements.
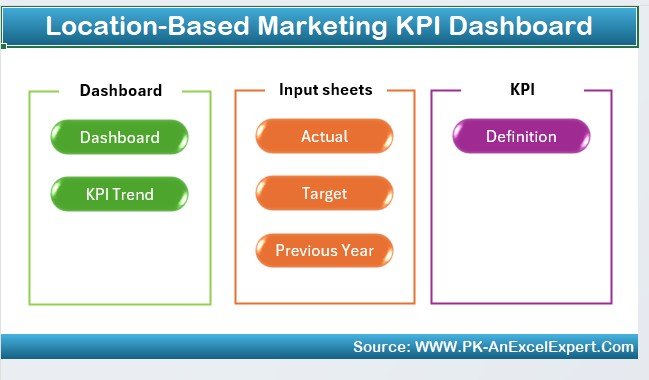
What’s Inside the Location-Based Marketing KPI Dashboard Template in Excel?
- Regional Sales Tracking: Track sales and performance by geographic location.
- Customer Engagement Insights: Monitor foot traffic, online interactions, and customer visits.
- ROI Analysis: Measure the ROI of location-based campaigns and track campaign costs.
- Geographic Performance Visualization: Use charts and maps to display regional performance data.
- Customizable Filters & Reports: Filter data by region, marketing channel, or time period.
- Interactive Dashboard Layout: Drill down into regional data and gain actionable insights.
How to Use the Location-Based Marketing KPI Dashboard in Excel
1️⃣ Download the Template: Get immediate access to the Location-Based Marketing KPI Dashboard in Excel.
2️⃣ Input Your Data: Enter sales, engagement, and campaign data by region into the dashboard.
3️⃣ Track & Monitor KPIs: Use the dashboard to monitor sales, ROI, and customer engagement metrics in different locations.
4️⃣ Analyze Geographic Performance: Visualize and analyze regional data to optimize your location-based marketing strategies.
5️⃣ Generate Reports & Insights: Easily generate reports on campaign performance and ROI by location.
Who Can Benefit from the Location-Based Marketing KPI Dashboard in Excel?
🔹 Marketing Teams & Campaign Managers
🔹 Sales Managers & Regional Managers
🔹 Business Owners & Executives
🔹 Retail & E-commerce Businesses
🔹 Location-Based Service Providers
🔹 Marketing Analysts & Data Analysts
Maximize the effectiveness of your location-based marketing campaigns with the Location-Based Marketing KPI Dashboard in Excel. Track performance, measure ROI, and optimize your strategies based on geographic data.
Click here to read the Detailed blog post
Visit our YouTube channel to learn step-by-step video tutorials
Youtube.com/@PKAnExcelExpert



























Reviews
There are no reviews yet.