
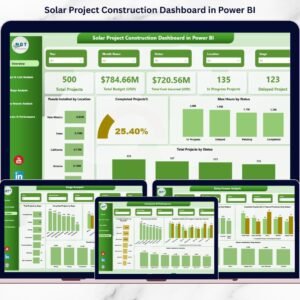
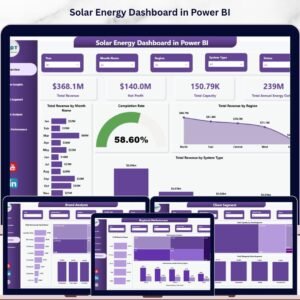
The Solar Energy Dashboard in Power BI tracks 4 headline KPIs across 5 interactive pages, with pre-built charts covering revenue, capacity, system type, client segment, panel brand, and regional performance — all powered by Power BI’s analytics engine. Setup takes under 10 minutes: open the .pbix file in Power BI Desktop, replace the sample data, and every card, chart, and slicer updates automatically.
🌍 Join 8,400+ teams in 40+ countries using NextGenTemplates to replace paid SaaS tools with one-time-purchase Excel, Google Sheets, Power BI, and HTML templates.
✅ Instant download · One-time payment · No subscription · No per-user fees · Lifetime access
🔑 Key Features of Solar Energy Dashboard in Power BI
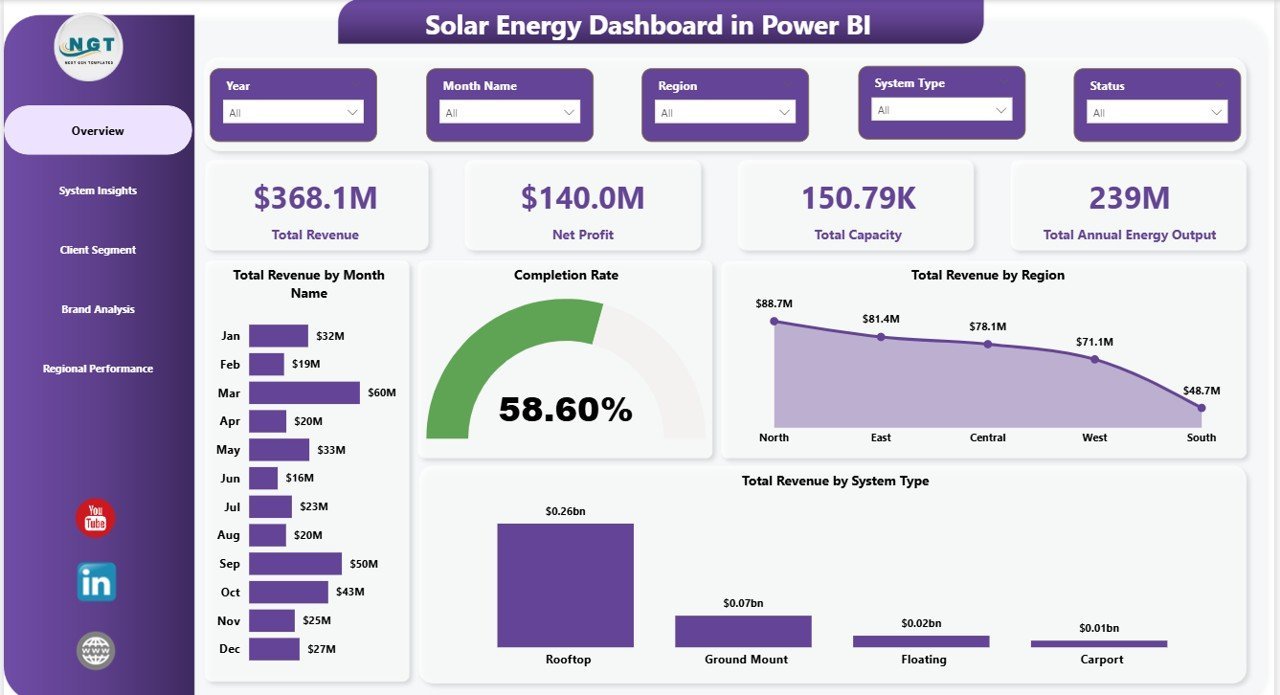
☀️ 4 KPI cards on the Overview page — Total Revenue, Net Profit, Total Capacity, and Total Annual Energy Output — give solar EPC managers and project finance teams instant visibility into portfolio-level performance. These are the same headline metrics solar developers use to brief ownership each month: revenue earned, margin achieved, megawatts installed, and energy generation output.
📊 5 dedicated analysis pages covering Overview, System Insights, Client Segment, Brand Analysis, and Regional Performance. Each page uses Power BI’s native visuals and cross-filtering so every slicer selection instantly updates all charts on that page — no manual chart rebuilds required.
🔍 Multi-dimensional slicer filtering lets you drill from a company-wide view down to a single system type, client segment, panel brand, or region in two clicks. Built for project managers, brand managers, and finance controllers who need fast, filtered answers from the same dataset without leaving the dashboard.
🏷️ Brand and client analysis built in — the Brand Analysis page benchmarks panel brands on revenue, capacity, and profit margin, while Client Segment breaks performance across residential, commercial, industrial, and utility clients. These are the insights solar channel managers use to negotiate brand partnerships and reallocate project pipelines.
🗺️ Regional Performance page shows Profit Margin by Region, Total Capacity by Region, and Total Revenue and Net Profit by Region — critical for multi-geography solar operators who need to identify underperforming territories before they drag portfolio margins.
📦 What’s Inside the Solar Energy Dashboard in Power BI
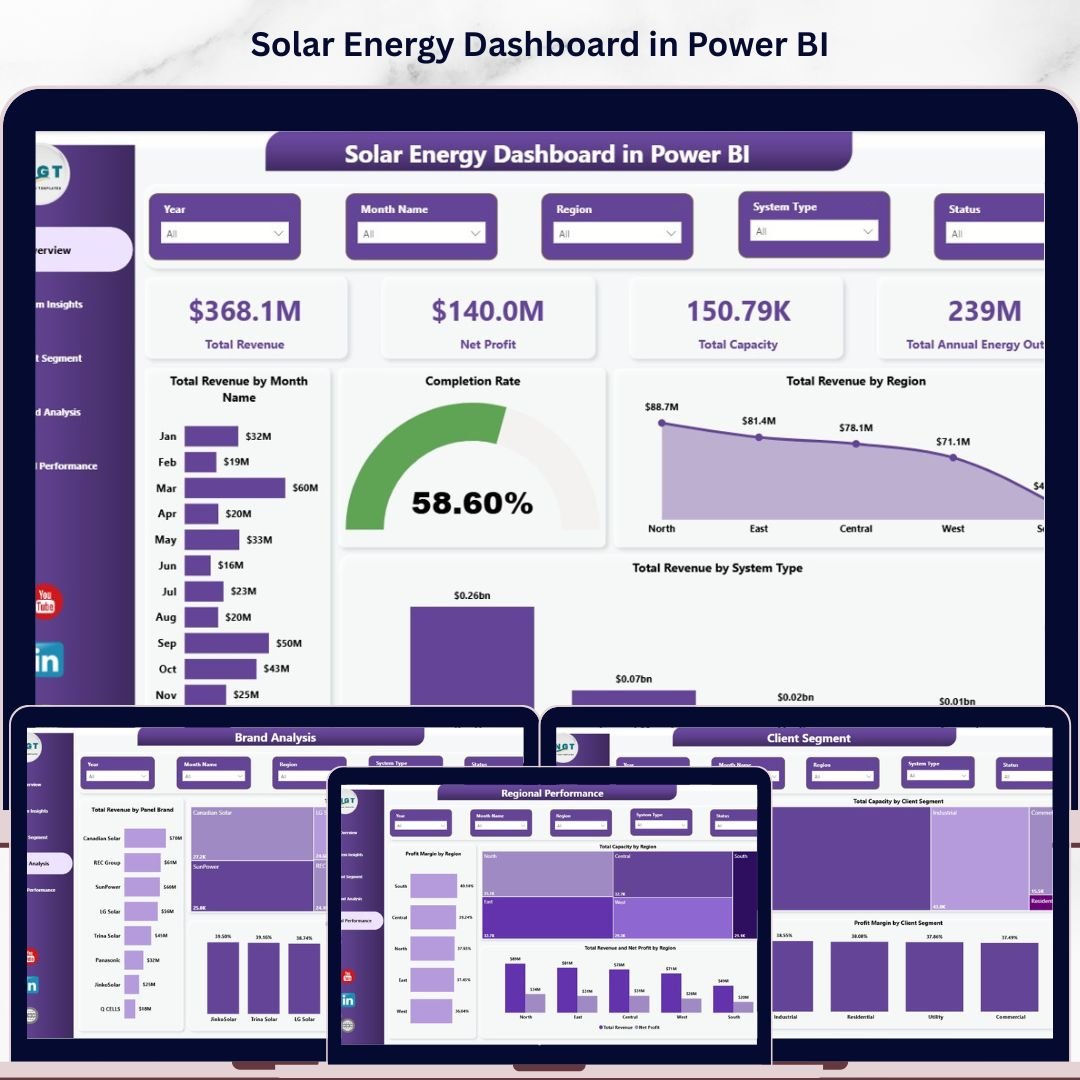
📈 1 — Overview Page. 4 KPI cards (Total Revenue, Net Profit, Total Capacity, Total Annual Energy Output) paired with charts covering Total Revenue by Month Name, Completion Rate, Total Revenue by Region, and Total Revenue by System Type. Slicers let you filter the entire page by system type, region, client segment, and panel brand instantly.

Overview Page
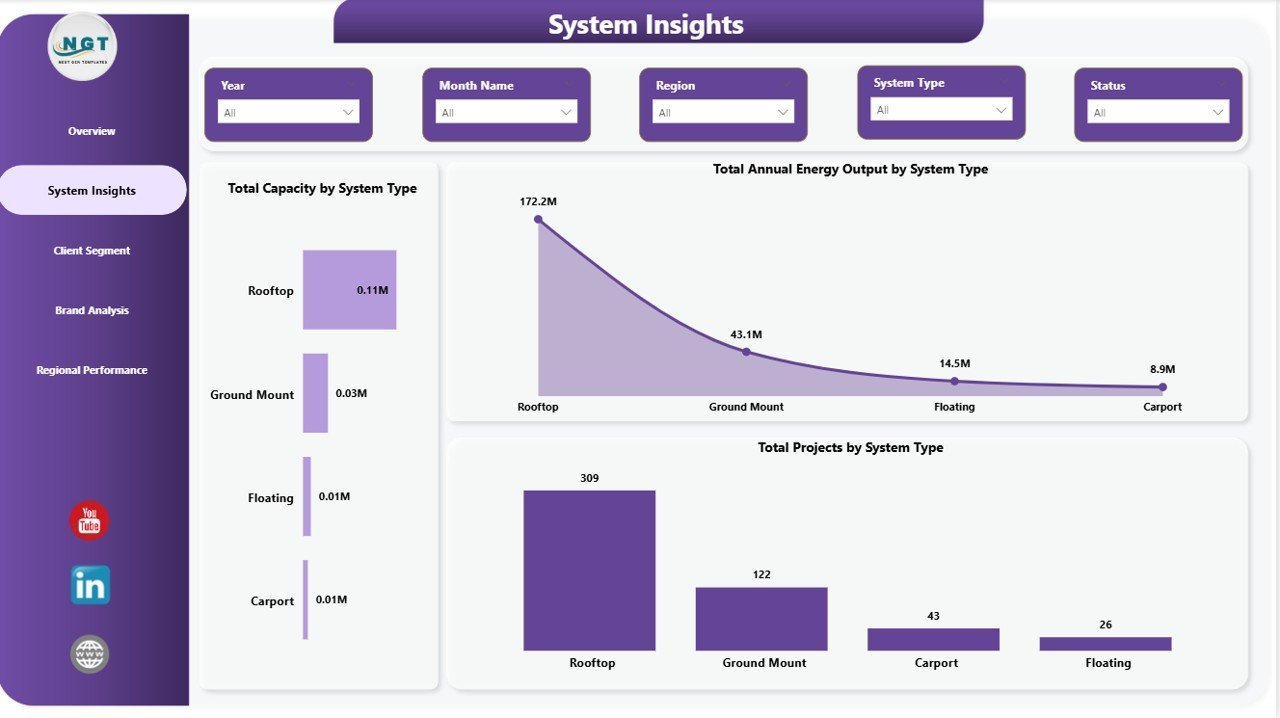
⚡ 2 — System Insights. Compares solar system types side by side across Total Capacity by System Type, Total Annual Energy Output by System Type, and Total Projects by System Type — so you can see instantly which system category (rooftop, ground mount, carport, utility-scale) is delivering the most installed capacity and energy generation.

System Insights
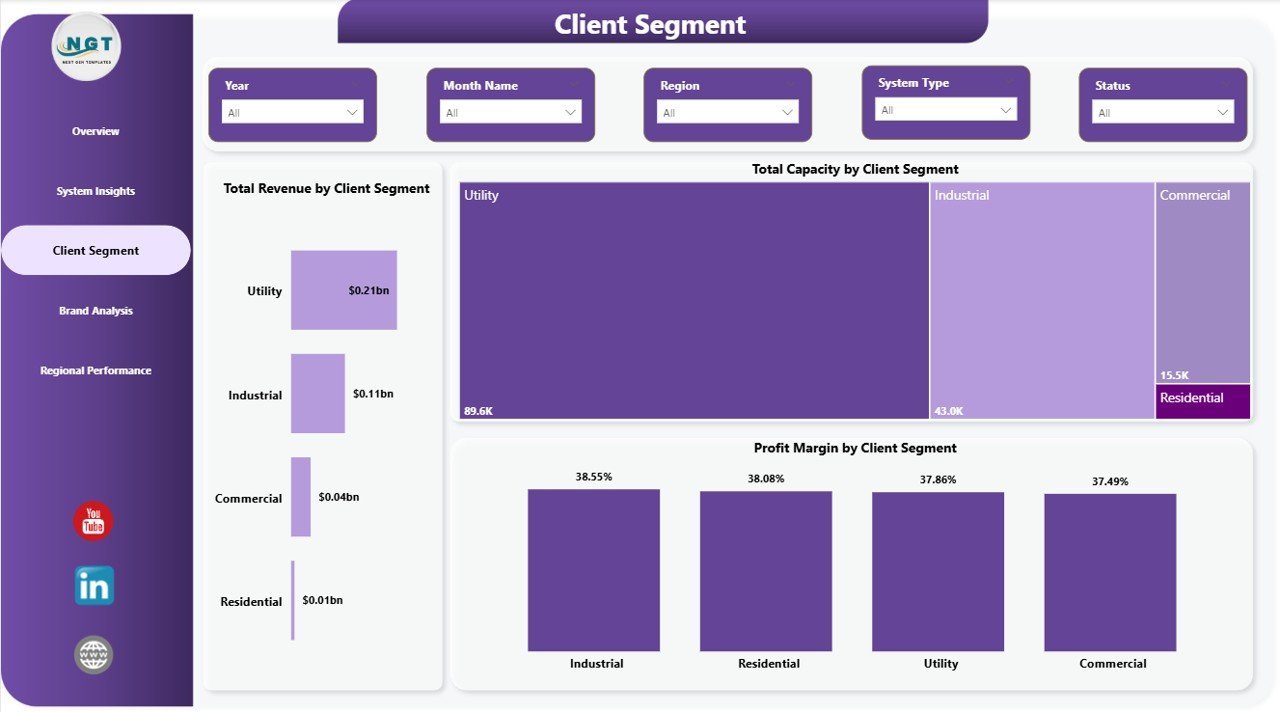
👥 3 — Client Segment. Breaks revenue and capacity across your customer base: Total Revenue by Client Segment, Total Capacity by Client Segment, and Profit Margin by Client Segment — letting sales and account teams see which segment (residential, commercial, industrial, utility) is most profitable and which needs pricing or cost attention.

Client Segment
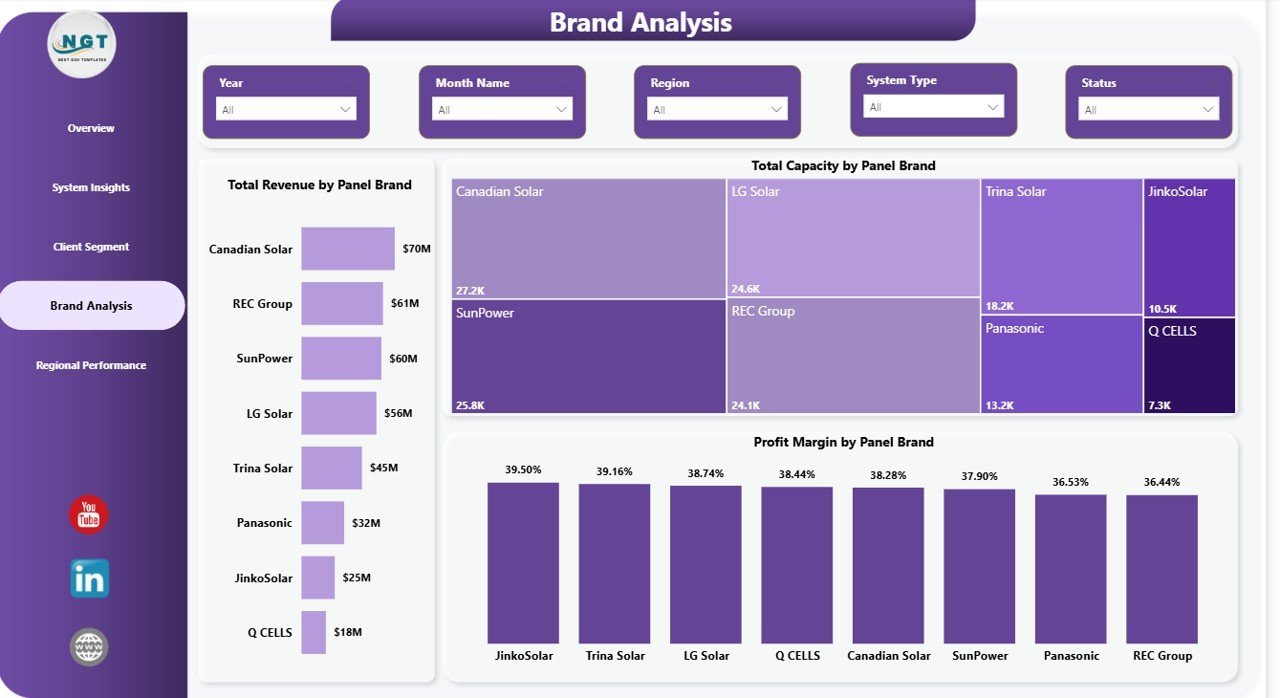
🏷️ 4 — Brand Analysis. Benchmarks panel brands across three metrics: Total Revenue by Panel Brand, Total Capacity by Panel Brand, and Profit Margin by Panel Brand — giving procurement and channel teams the data to negotiate better terms with top-performing brands and phase out low-margin relationships.
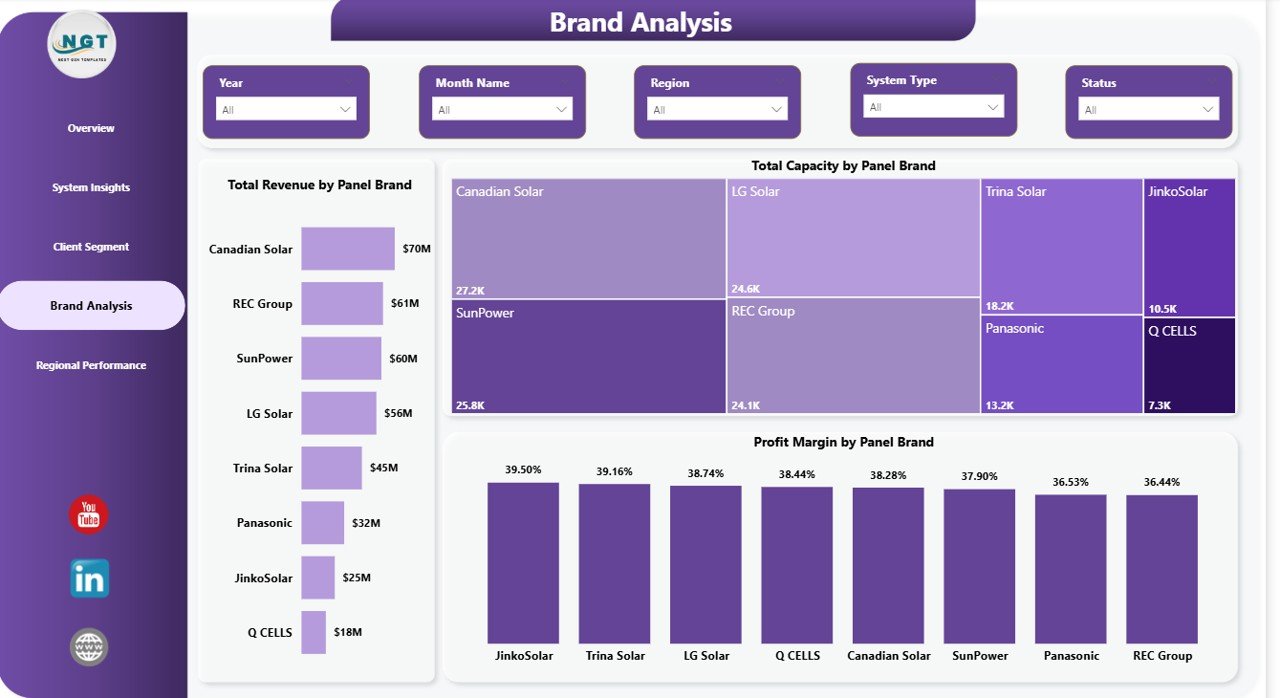
Brand Analysis
📍 5 — Regional Performance. Maps portfolio performance geographically: Profit Margin by Region, Total Capacity by Region, and Total Revenue and Net Profit by Region — the executive summary page for regional sales heads and CFOs reviewing multi-territory portfolio health.
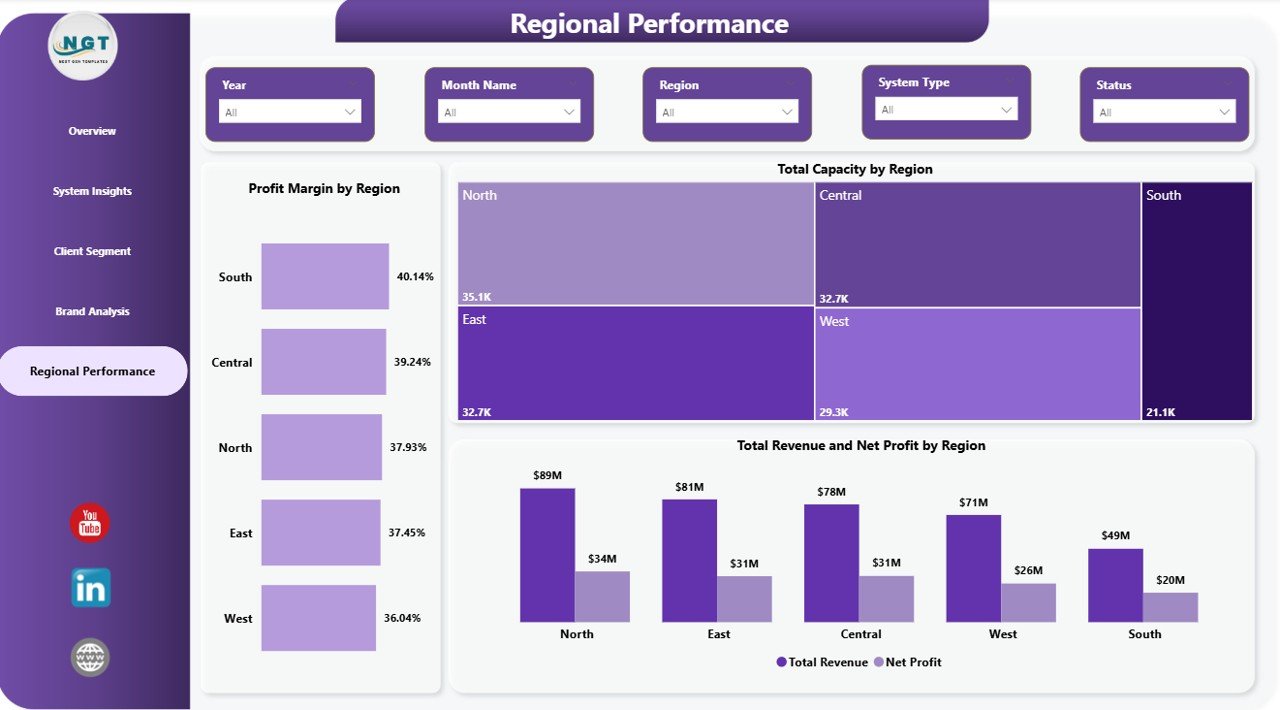
Regional Performance
📊 Solar Energy Dashboard in Power BI vs. Excel Equivalent vs. Paid Solar SaaS — Where This Fits
| Feature | Solar Energy Dashboard in Power BI | Solar Energy Dashboard in Excel | Paid Solar SaaS (Aurora / OpenSolar Pro / Scoop) |
|---|---|---|---|
| Cost | $17.99 one-time ✅ | $17.99 one-time | $49–$199 / user / month |
| Platform | Power BI Desktop + Service ✅ | Microsoft Excel (desktop + web) | Cloud SaaS only |
| Setup time | Under 10 minutes ✅ | Under 10 minutes | 2–6 weeks onboarding |
| Interactive cross-filtering | ✅ Native Power BI | ⚠️ Slicer-only | ✅ Yes |
| Publish to Power BI Service | ✅ Shareable via link | ❌ Not applicable | ✅ Paid seat per viewer |
| Customizable fields | ✅ Fully editable | ✅ Fully editable | ⚠️ Vendor-controlled |
| Brand + region analysis | ✅ Out of the box | ✅ | ⚠️ Higher tier only |
| Year-1 cost at 5 users | $17.99 total ✅ | $17.99 total | $2,940–$11,940 |
| No per-user fees | ✅ One-time | ✅ One-time | ❌ Per seat, per month |
For solar EPC teams already on the Power BI stack who want installation-level analytics without $3K–$12K per year in SaaS fees, the Solar Energy Dashboard in Power BI sits in the sweet spot.
👥 Who This Template Is For — and Who It’s Not For
✅ This template is built for:
- Solar EPC and installation companies with 50–2,000 installations per year already running Power BI for reporting
- Solar finance and operations managers presenting monthly portfolio decks in Power BI Service
- Channel managers who need brand-by-brand margin comparisons across panel suppliers
- Regional solar sales heads tracking revenue and capacity across multiple geographies in one view
- Solar consultants who want a portable Power BI template to replicate across multiple clients
❌ This template is NOT for:
- Utility-scale generation companies needing SCADA-level live telemetry or real-time inverter data feeds
- Solar design teams that need PV system sizing, string layouts, or shading simulations
- Teams requiring SOC 2-audited, SSO-gated cloud platforms with automated utility bill parsing
⚙️ How to Use the Solar Energy Dashboard in Power BI
- Download and unzip the file to your preferred folder.
- Open the .pbix file in Power BI Desktop (free from Microsoft).
- Navigate to the Data view and replace the sample records with your own solar installation data — keep the same column structure.
- Return to Report view and use the slicers on each page to filter by system type, client segment, panel brand, or region.
- Publish to Power BI Service to share the dashboard with your team via a secure link — no per-user fees required beyond your existing Power BI license.
💼 Real-World Use Cases
Priya leads operations at a 60-person solar EPC company in California. Her team installs 400+ rooftop and commercial systems a year across three regions. She uses the Solar Energy Dashboard in Power BI to run a weekly Monday review: open the Regional Performance page, filter by the Southwest, and flag any region where profit margin has slipped more than 3 points month-over-month — then pivot to the Client Segment page to see whether the drop is concentrated in residential or commercial work.
Marco is a finance controller at a European solar developer with ground-mount and carport installations across Germany, Italy, and Spain. His CFO insists on a monthly pack showing Total Revenue vs Net Profit by Region. He publishes the Power BI dashboard to Service, sends a read-only link, and never touches PowerPoint.
Ananya is an independent solar consultant who delivers monthly performance reports to five installer clients. She duplicates the .pbix file for each client, drops in their project data, and presents the Overview and Brand Analysis pages during quarterly reviews. She replaced an $89/user/month reporting SaaS with a one-time $17.99 purchase.
❓ Frequently Asked Questions
What KPIs does the Solar Energy Dashboard in Power BI track?
The Solar Energy Dashboard in Power BI tracks 4 headline KPIs — Total Revenue, Net Profit, Total Capacity, and Total Annual Energy Output — plus chart-level metrics spanning system type, client segment, panel brand, and region across 5 interactive pages.
How long does setup take?
Setup takes under 10 minutes. Open the .pbix file in Power BI Desktop, replace the sample data with your own solar project records, and every KPI card, chart, and slicer updates automatically.
Which version of Power BI do I need?
The Solar Energy Dashboard in Power BI works with Power BI Desktop (free from Microsoft) on Windows. To share via Power BI Service and enable scheduled refresh, a Power BI Pro or Premium Per User license is required. No third-party add-ins or DAX customization is needed to use the template out of the box.
How does this compare to paid solar SaaS like Aurora or OpenSolar?
Aurora and OpenSolar Pro cost $49–$199 per user per month — that’s $2,940–$11,940 per year for a 5-person team. The Solar Energy Dashboard in Power BI is $17.99 one-time and covers the performance-reporting layer most solar EPC teams actually need: revenue, margin, capacity, and regional tracking.
Can I customize the KPIs, charts, and slicers?
Yes. Every visual in the Solar Energy Dashboard in Power BI is fully editable in Power BI Desktop. Add new DAX measures, create additional pages, change the color theme, or connect your own Excel or SQL data source.
Is there a Google Sheets or Excel version available?
Yes. The Solar Energy Dashboard in Excel is available for teams on the Microsoft Excel stack. Both versions cover the same 5 analysis pages and KPI set.
Do I get future updates?
Yes. Every NextGenTemplates purchase includes free updates to the same template file when improvements are released.
👤 About the Author
Built by PK — Microsoft Certified Professional with 15+ years of Excel, Google Sheets, and Power BI experience. Founder of NextGenTemplates, reaching 300K+ subscribers across YouTube channels (@PK-AnExcelExpert, @NextGenTemplates, @NeoTechNavigators). Every template is hand-built and tested before release.
🔗 Explore Related Templates
☀️ Solar Energy Dashboard in Excel — the Excel version with pivot tables and slicers for teams on the Microsoft Excel stack.
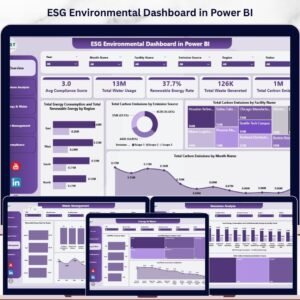
🌿 ESG Environmental Dashboard in Power BI — pair your solar numbers with full carbon emissions, water usage, and compliance tracking.
⚡ Electricity Project Dashboard in Excel — project-oriented view for grid-connected electricity work.
🌱 Renewable Energy KPI Scorecard in Google Sheets — MTD/YTD KPI tracking for renewable energy operations teams.
Browse the full Power BI Dashboard Templates library for 200+ industry-specific dashboards.
📖 Click here to read the Detailed Blog Post
🎥 Visit our YouTube channel for step-by-step video tutorials
👉 YouTube.com/@NextGenTemplates
Watch the step-by-step video tutorial:
YouTube


Reviews
There are no reviews yet.