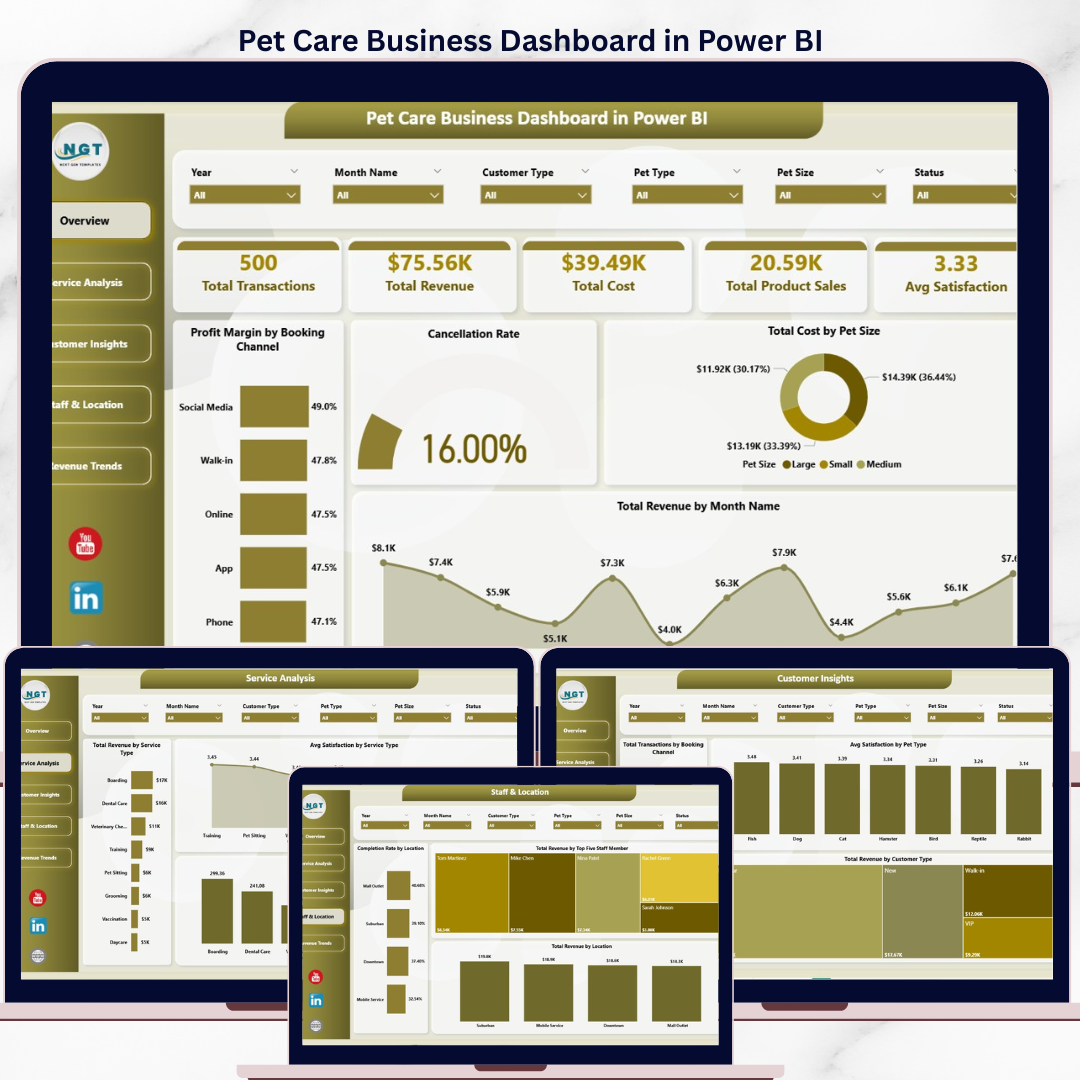
The Pet Care Business Dashboard in Power BI tracks 5 KPI cards across 5 interactive report pages, with 16 pre-built visuals and slicer-driven filters covering Service Type, Booking Channel, Pet Type, Pet Size, and Location. Setup takes under 10 minutes — just replace the sample data and every chart updates automatically.
🌍 Join 8,400+ teams in 40+ countries using Nextgen Templates to replace paid SaaS tools with one-time-purchase Excel, Google Sheets, Power BI, and HTML templates.
✅ Instant download · One-time payment · No subscription · No per-user fees · Lifetime access
Whether you run a solo grooming salon, a multi-location veterinary clinic, or a pet boarding and daycare facility, this dashboard converts raw transaction data into clear answers about which services generate the most profit, which staff members drive the highest revenue, and how satisfaction scores vary by pet type — all inside Power BI Desktop with zero DAX writing required.
🔑 Key Features of Pet Care Business Dashboard in Power BI
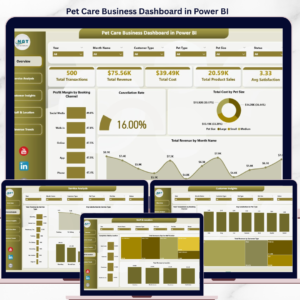
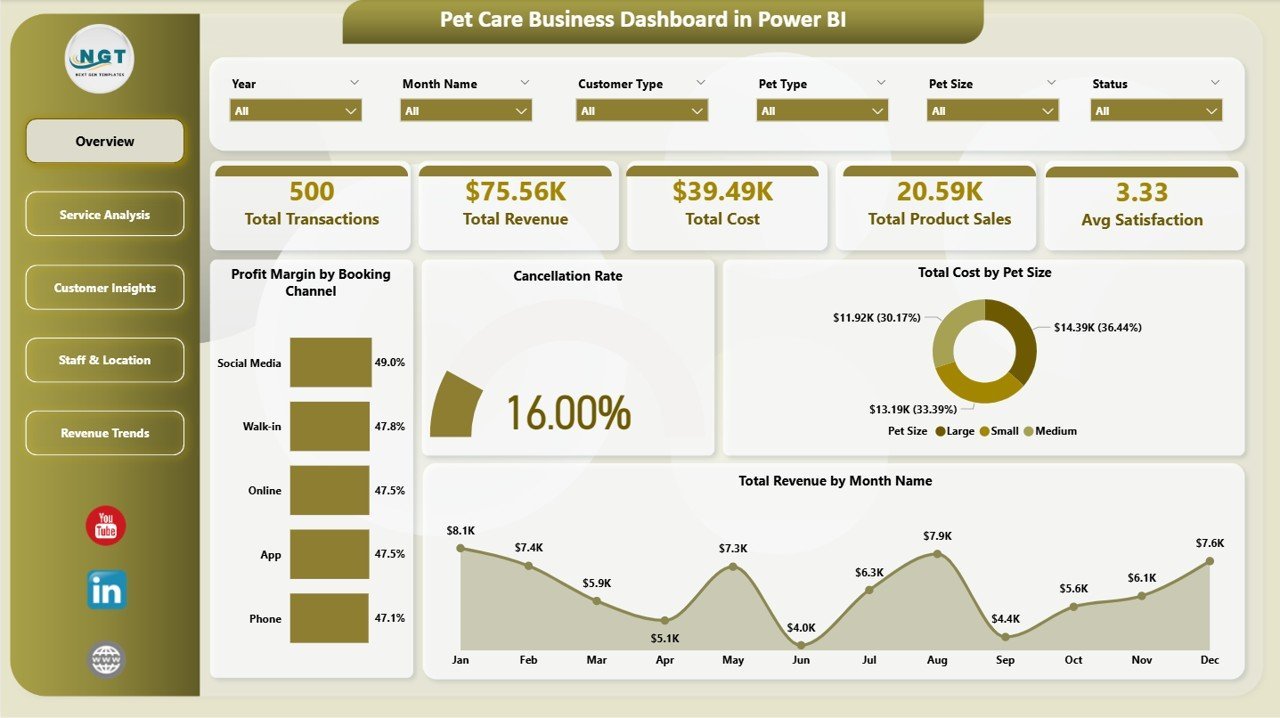
📊 5 KPI cards on the Overview page — Total Transactions, Total Revenue, Total Cost, Total Product Sales, and Avg Satisfaction surface pet business health in under 30 seconds. Every card recalculates instantly when any slicer filter is applied.
📈 16 pre-built visuals across 5 pages — Profit Margin by Booking Channel, Cancellation Rate, Total Cost by Pet Size, Revenue by Month, Service Type breakdowns, Booking Channel analysis, Staff Leaderboard, Location Completion Rate, and Monthly Margin Trends — with zero DAX customization needed.
🔀 5-slicer filtering system — Service Type, Booking Channel, Pet Type, Pet Size, and Location slicers let you segment every page instantly. Apply a Location filter and all 5 report pages update simultaneously.
💰 Profit Margin by Booking Channel — identifies which acquisition channel (walk-in, online, referral, app) delivers the highest net margin, so you know where to focus marketing spend.
👥 Staff revenue leaderboard — Top 5 Staff Members by Revenue makes performance management data-driven rather than anecdotal.
📅 Monthly trend analysis — Revenue by Month and Profit Margin by Month reveal seasonality peaks and dips so you can schedule staff and promotions proactively.
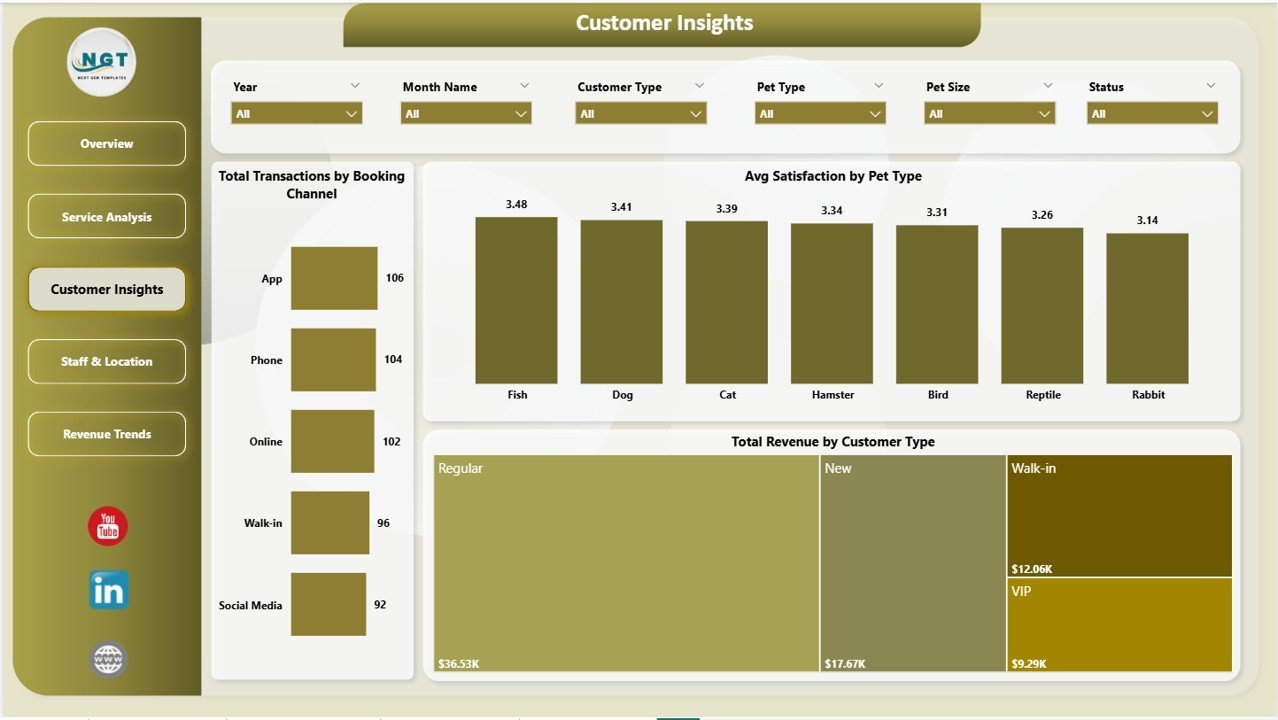
🐾 Pet Type satisfaction breakdown — Avg Satisfaction by Pet Type identifies which animals generate the highest satisfaction scores and revenue per visit — critical for service development decisions.
📦 What’s Inside the Pet Care Business Dashboard in Power BI
🐾 Page 1 — Overview: Total Transactions · Total Revenue · Total Cost · Total Product Sales · Avg Satisfaction · Profit Margin by Booking Channel · Cancellation Rate · Total Cost by Pet Size · Total Revenue by Month Name
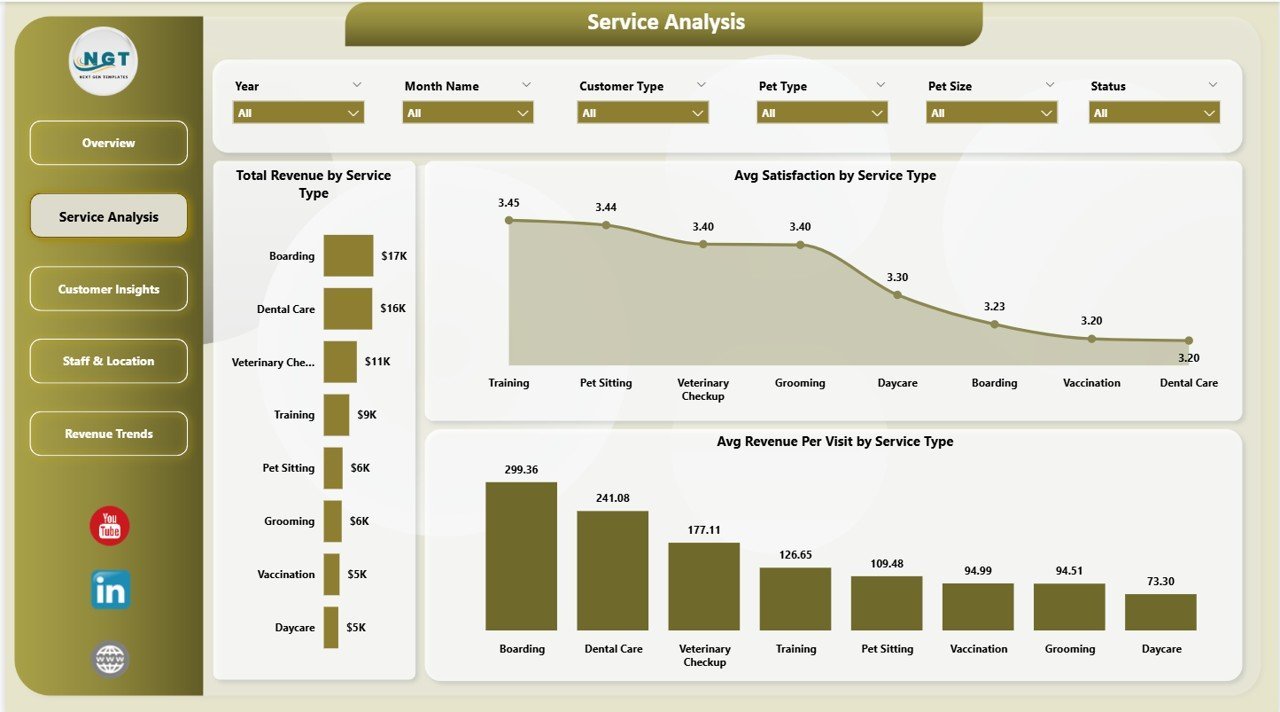
💇 Page 2 — Service Analysis: Total Revenue by Service Type · Avg Satisfaction by Service Type · Avg Revenue Per Visit by Service Type
👤 Page 3 — Customer Insights: Total Transactions by Booking Channel · Avg Satisfaction by Pet Type · Total Revenue by Customer Type
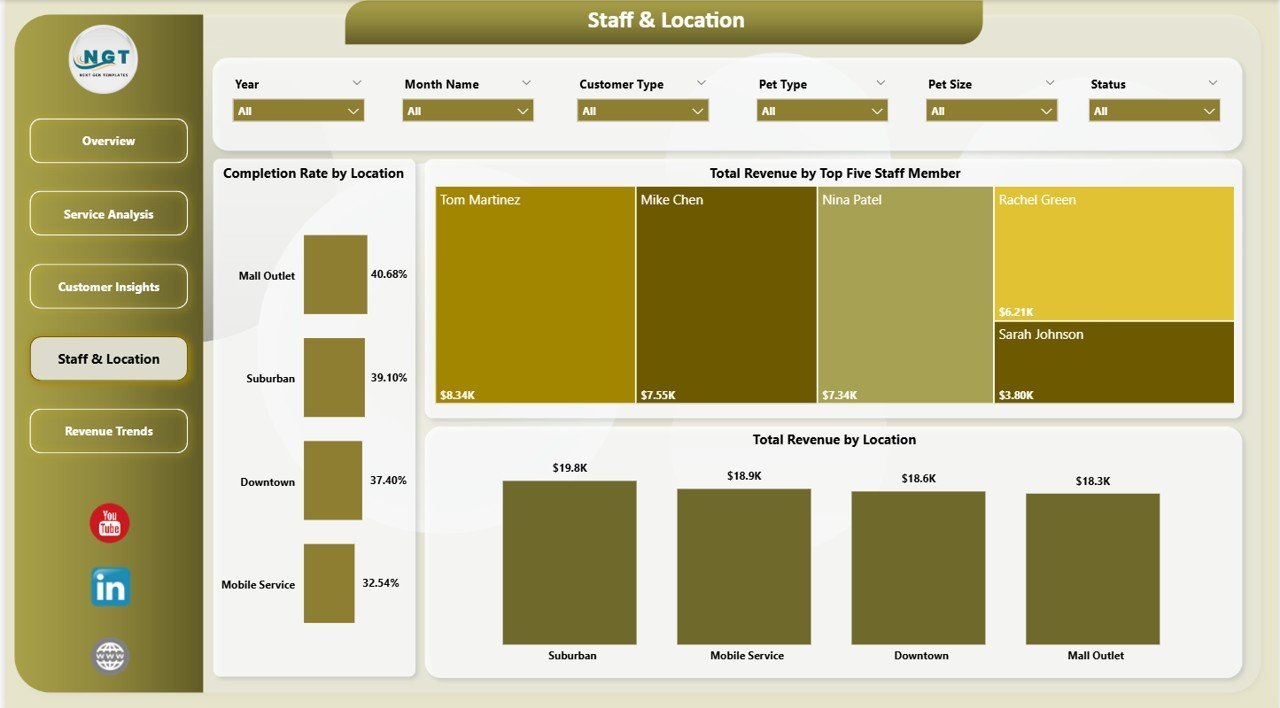
📍 Page 4 — Staff & Location: Completion Rate by Location · Total Revenue by Top Five Staff Member · Total Revenue by Location
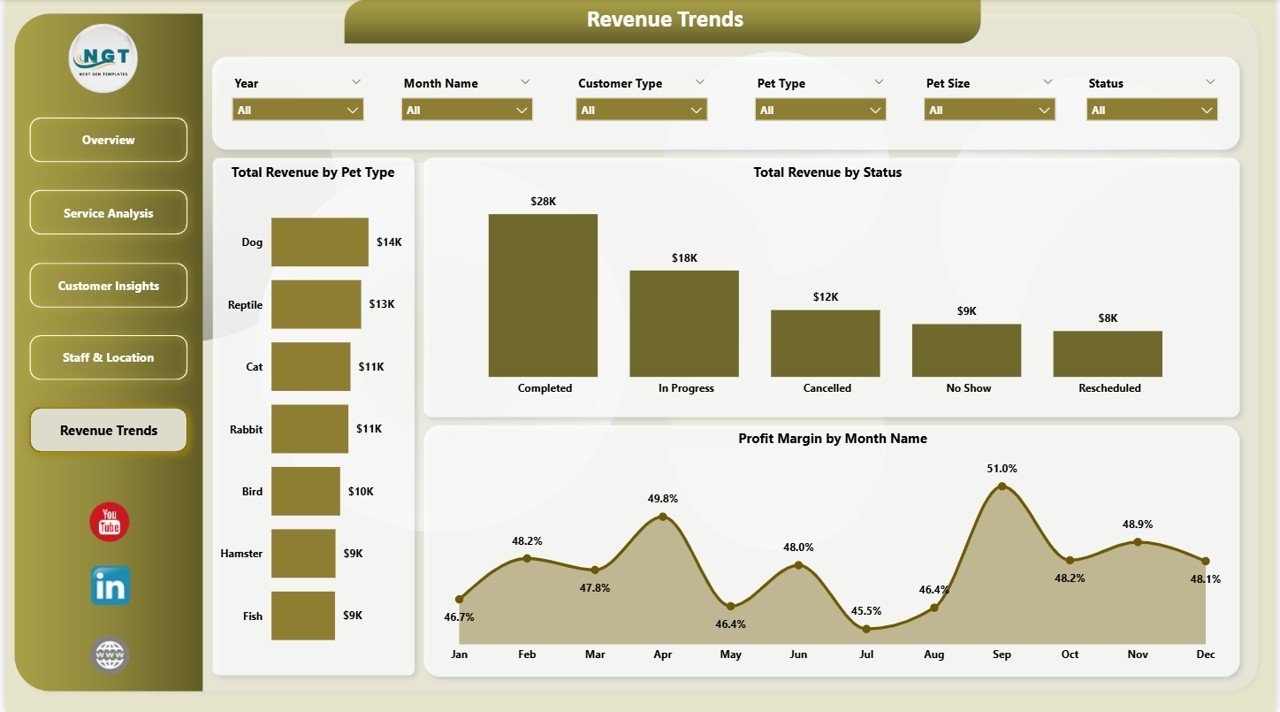
📊 Page 5 — Revenue Trends: Total Revenue by Pet Type · Total Revenue by Status · Profit Margin by Month Name
📊 Pet Care Business Dashboard in Power BI vs. Excel Dashboard vs. Paid Veterinary SaaS — Where This Fits
| Feature | Pet Care Business Dashboard in Power BI | Excel Dashboard | Day Smart Vet / Vet Clinic SaaS |
|---|---|---|---|
| Cost | $17.99 one-time | Included with Excel | $50–300+ / month |
| Platform | Power BI Desktop (free) | Microsoft Excel | Web browser / app |
| Setup time | Under 10 minutes | 30–60 min | 2–8 hours onboarding |
| Interactive slicers | ✅ 5 slicers | Limited | ✅ Yes |
| Customizable fields | ✅ Fully editable .pbix | ✅ Yes | ❌ Fixed |
| Staff revenue leaderboard | ✅ Top 5 staff | Manual | ✅ Yes |
| Pet type satisfaction analysis | ✅ Built-in | Manual | Partial |
| Year-1 cost (1 user) | $17.99 total | ~$0 (if have Excel) | $600–3,600 |
| No subscription required | ✅ | ✅ | ❌ |
For pet care businesses that want clear revenue and satisfaction analytics without paying for practice management software, the Pet Care Business Dashboard in Power BI sits in the sweet spot.
👥 Who This Template Is For — and Who It’s Not For
✅ This template is built for:
- Pet grooming salon owners tracking daily revenue, cost, and cancellation rates across booking channels
- Veterinary clinic managers who need staff performance rankings and multi-location revenue comparisons
- Dog boarding and daycare facility operators analyzing booking channels and pet type revenue trends
- Multi-service pet businesses tracking which services deliver the highest margin per visit
- Business owners presenting monthly KPI summaries and revenue trends to partners or investors
❌ This template is NOT for:
- Businesses that need real-time appointment booking and online scheduling — this is a reporting dashboard, not a booking platform
- Teams requiring cloud-based multi-user simultaneous editing without a Power BI Pro license
- Large veterinary hospital chains needing full ERP, inventory management, and regulatory compliance modules
⚙️ How to Use the Pet Care Business Dashboard in Power BI
- Purchase and download the .pbix file from NextGenTemplates.com
- Open the file in Power BI Desktop (free download from Microsoft)
- Replace the sample data table with your own pet care transaction export (CSV or Excel)
- Use the Service Type, Booking Channel, Pet Type, Pet Size, and Location slicers to filter any page
- Review all 5 report pages: Overview, Service Analysis, Customer Insights, Staff & Location, Revenue Trends
💼 Real-World Use Cases
Maria runs a 3-groomer pet salon in Phoenix. She uses the Profit Margin by Booking Channel chart to discover walk-in customers generate 22% higher margins than online bookings — so she shifts promotions to direct referrals and reduces platform fees. The Avg Satisfaction by Service Type page shows nail trimming appointments score 15% lower than grooming, prompting retraining that closes the gap in two months.
James manages a 4-location pet boarding network. The Staff & Location page reveals his Birmingham site completes 91% of booked appointments vs. 76% at Manchester. After identifying a weekend morning staffing gap and adding a part-time hire, monthly revenue at that site increases 18% the following quarter.
Dr. Priya operates a veterinary and grooming clinic in Singapore. Her Revenue Trends page shows cat grooming peaks in March and October. She runs pre-peak promotions in February and September, filling her calendar ahead of the seasonal surge and averaging 12% more monthly revenue year over year.
❓ Frequently Asked Questions
What KPIs does the Pet Care Business Dashboard in Power BI track?
The Pet Care Business Dashboard in Power BI tracks 5 KPIs on the Overview page: Total Transactions, Total Revenue, Total Cost, Total Product Sales, and Avg Satisfaction. All KPI cards recalculate instantly when slicer filters — Service Type, Booking Channel, Pet Type, Pet Size, and Location — are applied.
Do I need to know DAX to use this Power BI dashboard?
No DAX knowledge is required. The Pet Care Business Dashboard in Power BI comes with all measures and visuals pre-built inside the .pbix file. Replace the sample data with your own transaction export and every chart updates automatically. Power BI Desktop is free from Microsoft.
How does this compare to paid pet care management software?
The Pet Care Business Dashboard in Power BI costs $17.99 as a one-time purchase — no subscription, no per-user fees. SaaS platforms like Day Smart Vet or Vet Clinic typically run $50–300 per month. This template focuses on business intelligence and reporting rather than appointment scheduling.
Can I filter the dashboard by location or staff member?
Yes. The Staff & Location page shows Total Revenue by Top Five Staff Member and Completion Rate by Location. Cross-page slicers also let you filter all charts to a specific location simultaneously, giving site-level visibility across all 5 report pages.
How long does setup take?
Setup for the Pet Care Business Dashboard in Power BI takes under 10 minutes. Download the .pbix file, open in Power BI Desktop, replace the sample data with your booking export (CSV or Excel), and every visual updates automatically — no formula or layout changes needed.
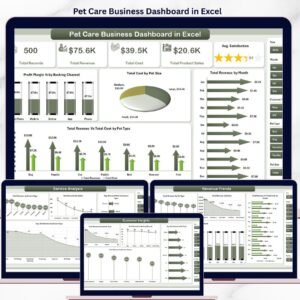
Is there a Google Sheets or Excel version available?
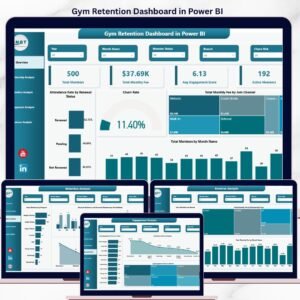
Yes. The Pet Care Business Dashboard in Excel delivers the same 5-page analysis in Microsoft Excel. Also explore the Gym Retention Dashboard in Power BI for a similar multi-page Power BI structure applied to fitness analytics.
What data format does the dashboard require?
The dashboard uses a flat transaction table with fields for date, service type, booking channel, pet type, pet size, location, staff name, revenue, cost, and satisfaction score. Most pet care booking systems export this as a CSV or Excel file that can be pasted directly into the template.
👤 About the Author
Built by PK — Microsoft Certified Professional with 15+ years of Excel, Google Sheets, and Power BI experience. Founder of Nextgen Templates, reaching 300K+ subscribers across YouTube channels (@PK-AnExcelExpert, @NextGenTemplates, @NeoTechNavigators). Every template is hand-built and tested before release.
🔗 Explore Related Templates
Also available: Pet Care Business Dashboard in Excel — same 5-page structure in Microsoft Excel. For other Power BI analytics, explore the Gym Retention Dashboard in Power BI. Browse the full Power BI Dashboard Templates collection on NextGenTemplates.
📖 Click here to read the Detailed Blog Post
🎥 Visit our YouTube channel for step-by-step video tutorials
👉 YouTube.com/@NextGenTemplates
📅 Last updated: May 2026
Watch the step-by-step video tutorial:
YouTube