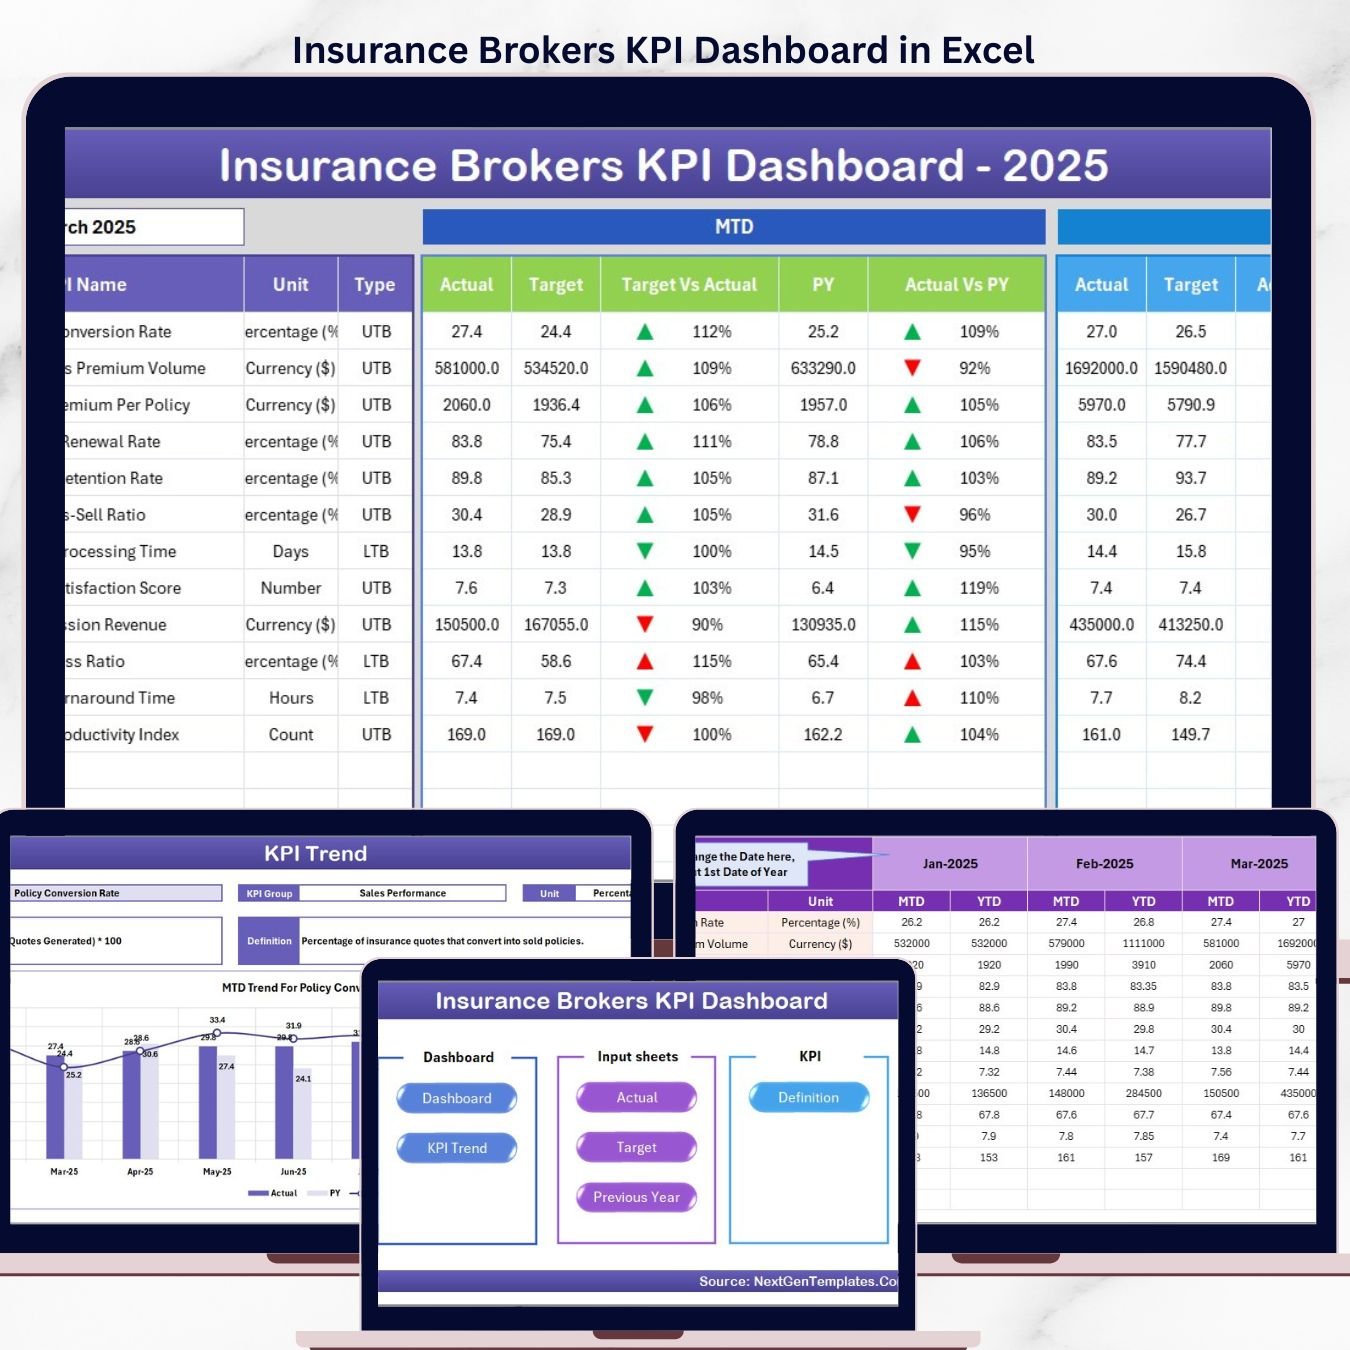


The Insurance Brokers KPI Dashboard in Excel monitors 15+ insurance broker KPIs across 7 interactive worksheets, with MTD and YTD comparisons, conditional formatting arrows, and trend charts — all auto-updating from 3 simple input sheets. Setup takes under 10 minutes: replace sample data and every metric recalculates instantly.
🌍 Join 8,400+ teams in 40+ countries using NextGenTemplates to replace paid SaaS tools with one-time-purchase Excel, Google Sheets, Power BI, and HTML templates.
✅ Instant download · One-time payment · No subscription · No per-user fees · Lifetime access
🔑 Key Features of Insurance Brokers KPI Dashboard in Excel
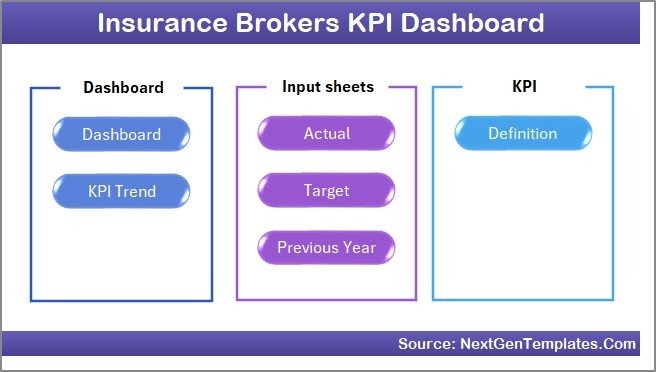
📌 7 Purpose-Built Worksheets — Home, Dashboard, KPI Trend, Actual Numbers Input, Target Number Input, Previous Year Numbers, and KPI Definition sheets give you end-to-end control of insurance broker performance tracking in a single Excel file.
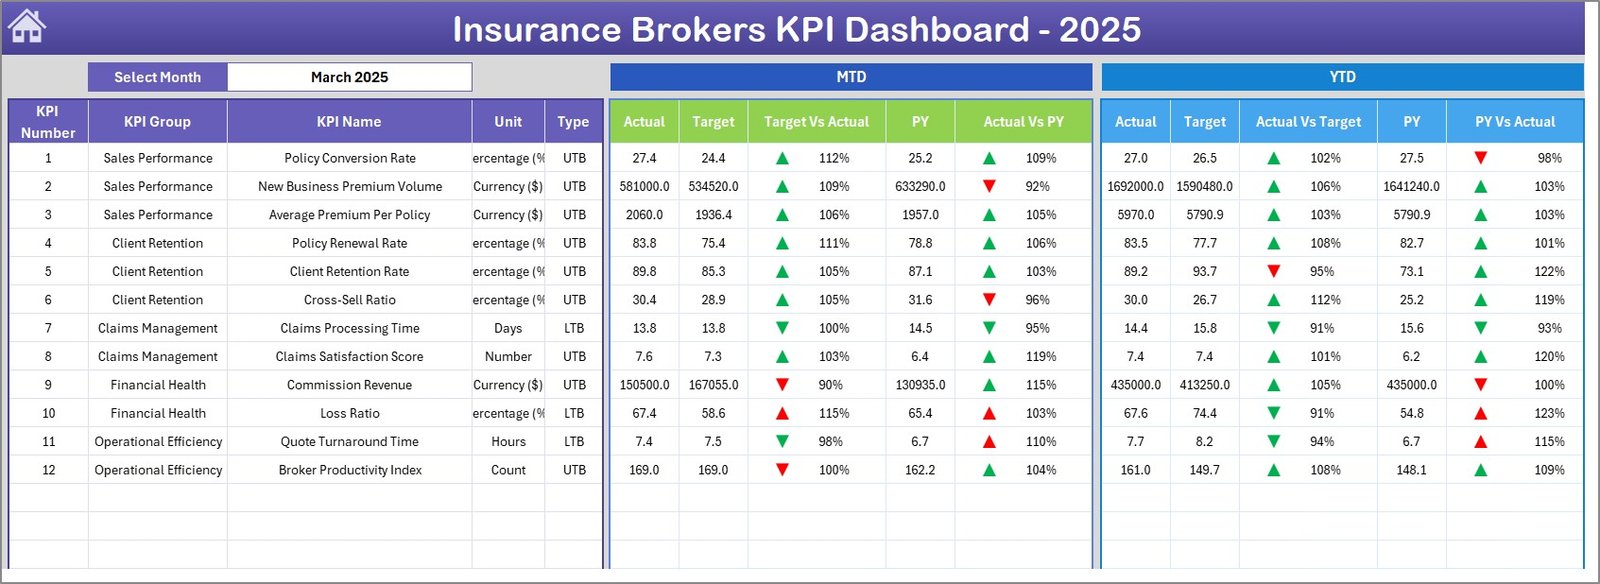
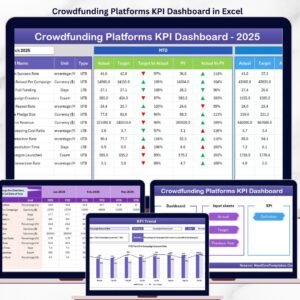
📌 MTD and YTD Comparisons with Conditional Formatting — The Dashboard sheet displays MTD Actual, Target, and Previous Year data alongside YTD equivalents. Up/down arrow indicators instantly flag whether each KPI is beating or missing its target, eliminating manual number-crunching.
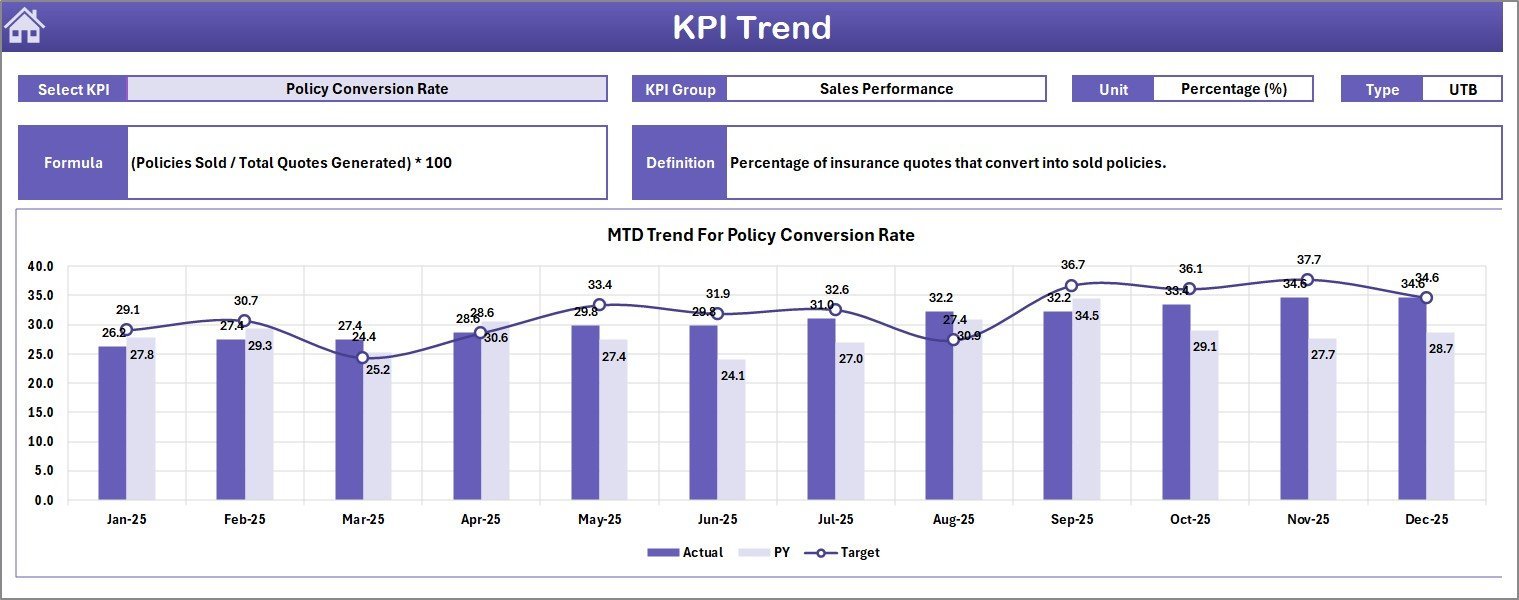
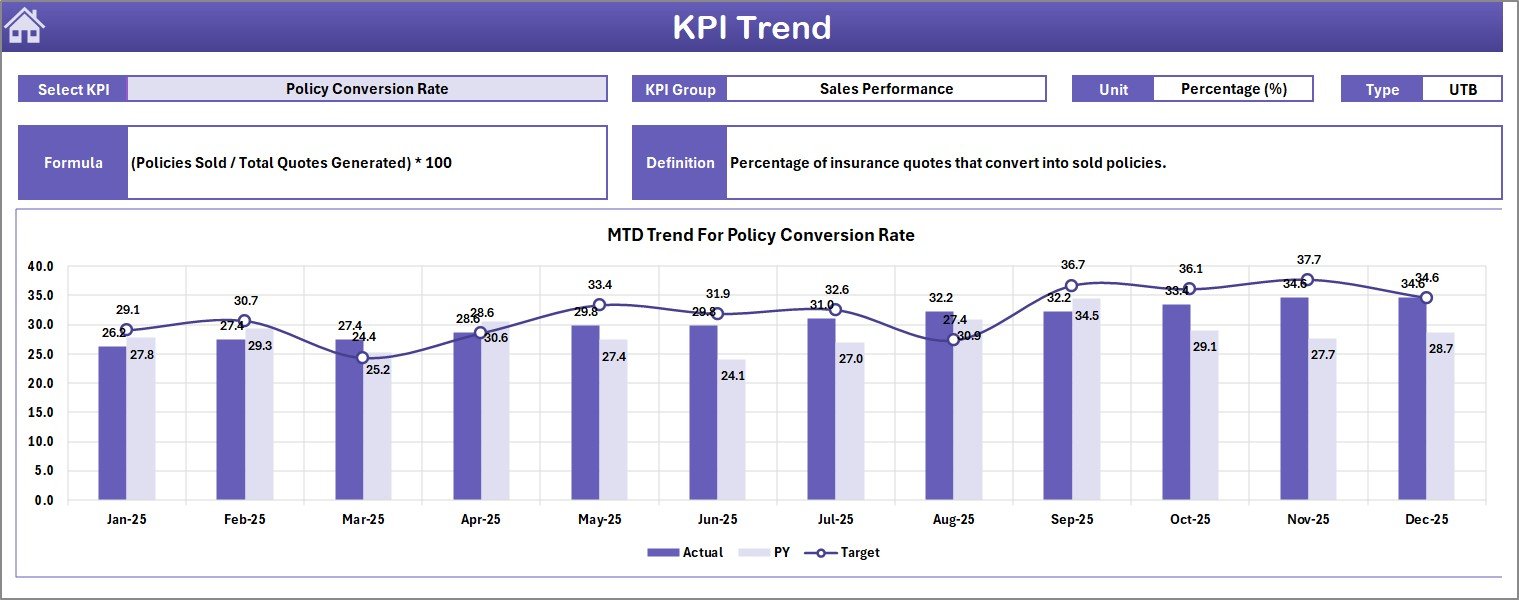
📌 Interactive KPI Trend Analysis — Select any KPI from the dropdown on the KPI Trend sheet to view its definition, formula, unit type (LTB or UTB), and monthly trend charts comparing Actual vs Target vs Previous Year for both MTD and YTD.
📌 Month Selector for Instant Filtering — A single dropdown on cell D3 of the Dashboard sheet changes every number on the page to reflect the selected month — no pivot tables, no slicers, no VBA required.
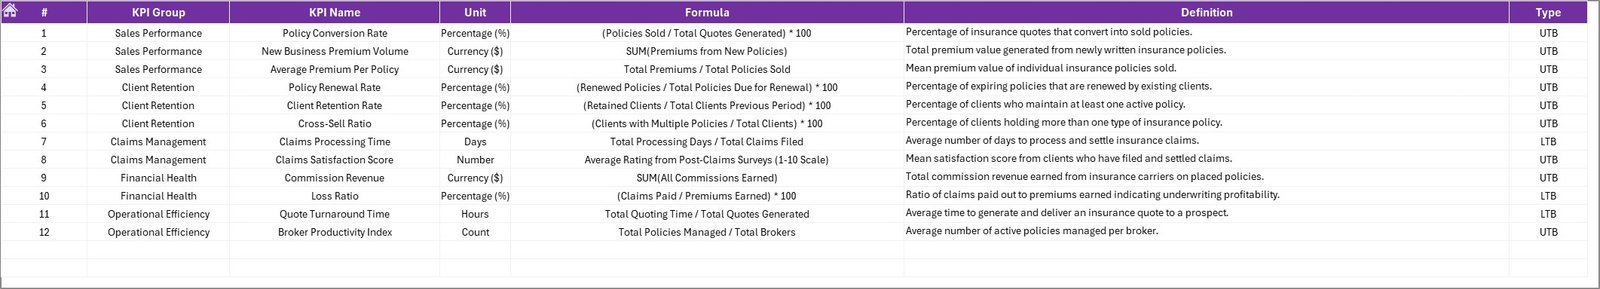
📌 Structured KPI Definition Sheet — Enter each KPI’s name, group, unit, formula, definition, and type (LTB/UTB) in one place. The KPI Trend sheet pulls this metadata automatically for on-screen reference.
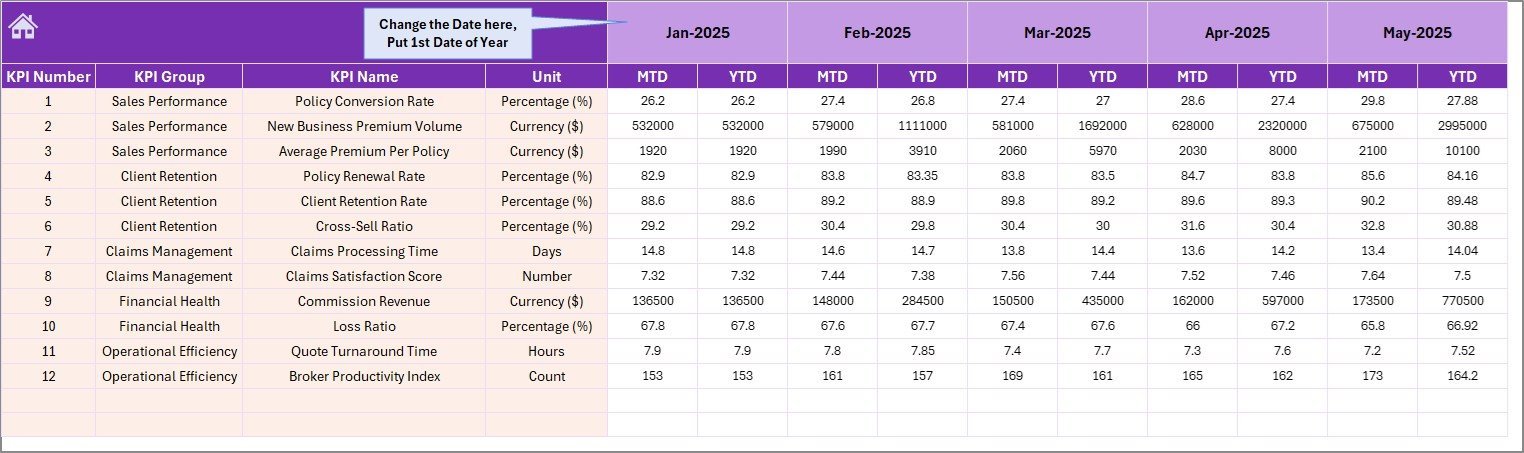
📌 Separate Input Sheets for Actual, Target, and Previous Year — Three clean input sheets keep data organized. Update monthly numbers and the Dashboard reflects changes immediately. The first-month cell on the Actual sheet lets you set your fiscal year start.
📌 One-Click Navigation — The Home sheet includes 6 navigation buttons that jump directly to any worksheet — no scrolling through tabs. Built for insurance brokerage teams managing policy retention, claims ratio, commission rates, premium growth, and loss ratio metrics.
📌 No Macros, No VBA — Works on Excel 2016, 2019, 2021, Microsoft 365, and Excel for Mac. Pure formula-driven — open and use immediately.
📦 What’s Inside the Insurance Brokers KPI Dashboard in Excel
This template includes 7 worksheets designed for insurance brokerage operations:
📂 Home Sheet — An index page with 6 navigation buttons linking to each worksheet for quick access.
 Home Page
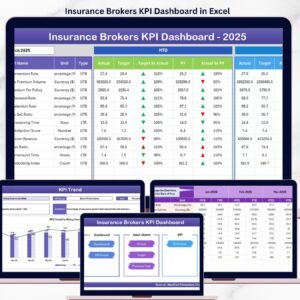
📂 Dashboard Sheet — The main analytics view. Select a month from the dropdown on D3 and view all KPIs with MTD Actual, Target, Previous Year, and YTD equivalents. Conditional formatting arrows (▲▼) highlight Target vs Actual and PY vs Actual variances at a glance.
 Insurance Brokers KPI Dashboard
📂 KPI Trend Sheet — Select any KPI from the dropdown on C3. View the KPI Group, Unit, Type (LTB/UTB), Formula, and Definition. Below, MTD and YTD trend charts plot Actual, Target, and Previous Year lines across 12 months.
 KPI Trend Sheet
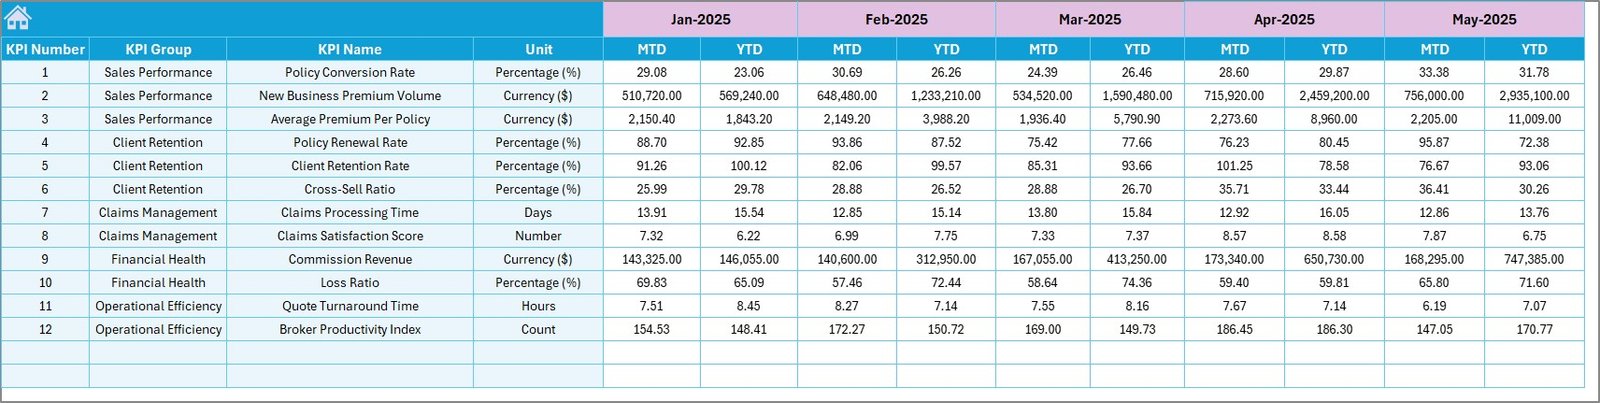
📂 Actual Numbers Input Sheet — Enter actual MTD and YTD numbers for each KPI per month. Set the first month of your fiscal year on cell E1.
 Actual Numbers Input Sheet
📂 Target Number Input Sheet — Enter target numbers for each KPI as MTD and YTD values for every month.
 Target Number Input Sheet
📂 Previous Year Number Sheet — Enter previous year data in the same format as the current year for year-over-year comparison.
Previous Year Number Input Sheet📂 KPI Definition Sheet — Define each KPI’s Name, Group, Unit, Formula, Definition, and Type (LTB or UTB). The KPI Trend sheet references this data automatically.
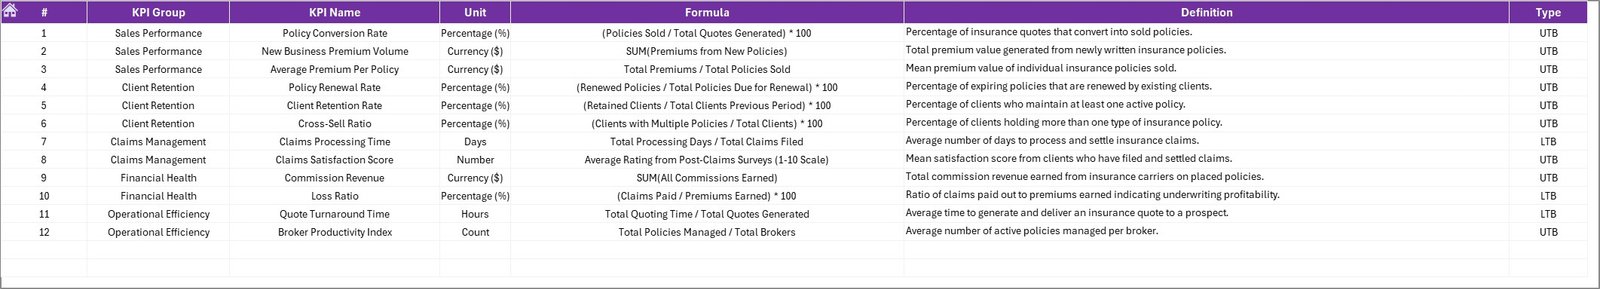 KPI Definition Sheet
📊 Insurance Brokers KPI Dashboard in Excel vs. Google Sheets vs. Applied Epic — Where This Fits
| Feature | Insurance Brokers KPI Dashboard in Excel | Google Sheets Equivalent | Applied Epic / Vertafore |
|---|---|---|---|
| Cost | $14.99 one-time | $9.99 one-time (separate purchase) | $150–$300/user/month |
| Platform | Microsoft Excel (desktop) | Google Sheets (browser) | Cloud SaaS |
| Setup Time | Under 10 minutes ✅ | 10–15 minutes | 4–8 weeks implementation |
| Real-time Collaboration | Via OneDrive/SharePoint | Built-in | Built-in |
| Customizable KPIs | Unlimited ✅ | Manual setup | Limited to plan |
| Offline Access | Full offline ✅ | Limited | No |
| Year-1 Cost (5 users) | $14.99 total ✅ | $9.99 total | $9,000–$18,000 |
| MTD/YTD Trend Charts | Built-in ✅ | Manual | Varies by plan |
| Commission Tracking KPIs | Built-in ✅ | With manual setup | Advanced automation |
For insurance brokerages that want structured KPI tracking without paying $150–$300/user/month for Applied Epic or Vertafore, the Insurance Brokers KPI Dashboard in Excel sits in the sweet spot.
👥 Who This Template Is For — and Who It’s Not For
✅ This template is built for:
- Insurance brokers and agencies with 5–200 employees tracking policy retention, claims ratio, and commission performance monthly
- Brokerage operations managers needing monthly MTD/YTD KPI reports for leadership presentations
- Independent insurance agents comparing actual premium growth against annual targets
- Insurance consultants delivering structured KPI scorecards to brokerage clients
❌ This template is NOT for:
- Large carriers needing API integrations with policy administration systems like Guidewire or Duck Creek
- Agencies requiring automated data feeds from Applied Epic or AMS360 without manual entry
- Teams needing SOC 2 compliance with audit trails on KPI data changes
⚙️ How to Use the Insurance Brokers KPI Dashboard in Excel
1️⃣ Download the Excel file and open it in Microsoft Excel.
2️⃣ Go to the KPI Definition sheet and enter your insurance broker KPIs — name, group, unit, formula, definition, and type (LTB/UTB).
3️⃣ Fill in the Actual Numbers Input sheet with your monthly MTD and YTD data.
4️⃣ Enter corresponding targets on the Target Number Input sheet.
5️⃣ Add previous year data on the Previous Year Number sheet for YoY comparison.
6️⃣ Navigate to the Dashboard sheet, select a month from the dropdown, and review all KPIs instantly.
7️⃣ Use the KPI Trend sheet to drill into individual metric performance over 12 months.
💼 Real-World Use Cases
Rajesh manages a 15-agent insurance brokerage in Mumbai. He uses the Insurance Brokers KPI Dashboard in Excel to track policy retention rate, new business premium, and commission income across all agents monthly. Before quarterly reviews, he selects the relevant month on the Dashboard sheet and exports it as a PDF — replacing a 4-hour manual reporting process with a 10-minute refresh.
Sarah runs operations at a mid-size P&C brokerage in Chicago. She enters monthly targets for loss ratio, claims turnaround time, and premium per client. The conditional formatting arrows instantly show her which KPIs missed target and by how much — helping her prepare variance reports for the CEO without building pivot tables from scratch.
Ahmed is a freelance insurance consultant in Dubai. He uses the KPI Trend sheet to present 12-month performance trajectories to his brokerage clients during quarterly strategy sessions. Comparing Actual vs Target vs Previous Year helps his clients spot seasonal patterns in policy renewals and plan marketing campaigns accordingly.
❓ Frequently Asked Questions
What KPIs does the Insurance Brokers KPI Dashboard in Excel track?
The Insurance Brokers KPI Dashboard in Excel tracks any KPI you define — policy retention rate, new business premium, loss ratio, claims ratio, commission income, premium per client, renewal rate, and more. You enter KPI names and definitions on the KPI Definition sheet, making the dashboard fully customizable.
How long does it take to set up this insurance broker dashboard?
Setup takes under 10 minutes. Enter your KPI definitions, fill in actual and target numbers for the current month, and the Dashboard sheet auto-populates with MTD and YTD comparisons, conditional formatting arrows, and trend charts.
Can I use this dashboard for other insurance verticals besides broking?
Yes. The KPI Definition sheet is completely flexible — you can rename KPIs for underwriting, claims management, actuarial, or reinsurance operations. The structure works for any MTD/YTD KPI tracking use case in the insurance industry.
Does the Insurance Brokers KPI Dashboard work on Mac?
Yes. The Insurance Brokers KPI Dashboard in Excel uses only standard formulas — no macros, no VBA. It works on Excel for Mac, Excel 2016, 2019, 2021, and Microsoft 365 without any compatibility issues.
How does this compare to Applied Epic or Vertafore analytics?
Applied Epic costs $150–$300 per user per month and requires weeks of implementation. The Insurance Brokers KPI Dashboard in Excel costs $14.99 one-time with no subscription, no per-user fees, and full offline access. For brokerages that enter data monthly, this template delivers 90% of the reporting value at less than 1% of the annual cost.
Can I add more KPIs beyond what’s pre-filled?
Yes. Add new rows on the KPI Definition sheet and corresponding rows on the Actual, Target, and Previous Year input sheets. The Dashboard and KPI Trend sheets reference these dynamically — no formula edits needed.
Is there a Google Sheets version of this dashboard?
Yes. Check out the Insurance Policy Analytics Dashboard in Google Sheets for browser-based insurance analytics with slicers and pivot charts. Also explore the Underwriting Efficiency KPI Dashboard in Google Sheets for underwriting-specific KPI tracking.
👤 About the Author
Built by PK — Microsoft Certified Professional with 15+ years of Excel, Google Sheets, and Power BI experience. Founder of NextGenTemplates, reaching 300K+ subscribers across YouTube channels (@PK-AnExcelExpert, @NextGenTemplates, @NeoTechNavigators). Every template is hand-built and tested before release.
🔗 Explore Related Templates
🔹 Insurance Policy Analytics Dashboard in Google Sheets — Track policy performance, commission analysis, and agent performance with slicers and pivot charts.
🔹 Underwriting Efficiency KPI Dashboard in Google Sheets — 15+ underwriting KPIs with MTD/YTD trends and conditional formatting arrows.
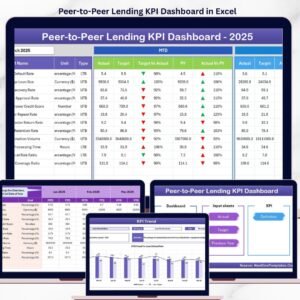
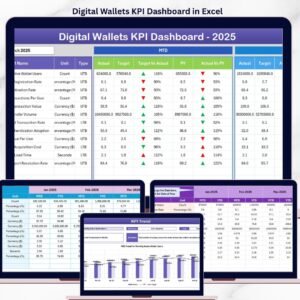
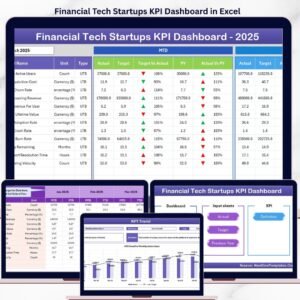
🔹 Digital Wallets KPI Dashboard in Excel — Same 7-sheet Excel KPI structure for fintech and digital payment teams.
🔹 Browse All KPI Dashboard Templates — Explore our full library of KPI dashboards across Excel, Power BI, Google Sheets, and HTML.
📖 Click here to read the Detailed Blog Post
🎥 Visit our YouTube channel for step-by-step video tutorials
👉 YouTube.com/@NextGenTemplates
sheet to drill into individual metric performance.”}]}]}


Reviews
There are no reviews yet.